 Yanyang Wang1*
 Wei Xiong
 Nan Yang
- 1State Grid Yichang Power Supply Company, Yichang, China
- 2State Grid Hubei Electric Power Co. LTD., Hubei, China
- 3China Three Gorges University, Yichang, China
For realizing high-accuracy short-term wind power prediction, a hybrid model considering physical features of data is proposed in this paper, with consideration of chaotic analysis and granular computing. First, considering the chaotic features of wind power time series physically, data reconstruction in chaotic phase space is studied to provide a low-dimensional input with more information in modeling. Second, considering that meteorological scenarios of wind development are various, complicated, and uncertain, typical chaotic time series prediction models and wind scenarios are analyzed correspondingly via granular computing (GrC). Finally, through granular rule-based modeling, a hybrid model combining reconstructed wind power data and different models is constructed for short-term wind power prediction. Data from real wind farms is taken for experiments, validating the feasibility and effectiveness of the proposed wind power prediction model.
Introduction
To mitigate the influence of global warming and energy crisis concerns, wind energy has been developed as one of the most potential energies around the world (Brouwer et al., 2016). Especially in areas with a large amount of wind sources (Li et al., 2017), e.g., Northwest of China, United States, and Europe, large-scale wind farms are being developed to provide more clear power to electricity industries. As more wind power is integrated into power systems with high concentration, the power grid also faces some great challenges caused by wind power generation. For example, the intermittency and variability of wind cause the uncertainty of wind power supply (Doostizadeh et al., 2017), which also causes the difficulties in scheduling wind power and threatens the security of the power grid. Therefore, an accurate wind power prediction system is eagerly required and improved by system operators to mitigate the harmful effects.
Currently, wind power prediction methods are mainly grouped into two categories: physics-based models and data-driven models (Yan et al., 2015). Physics-based models usually make use of meteorological data and physical laws to estimate wind speed, then wind speed is transformed into wind power, e.g. NWPs (Liu et al., 2012). Data-driven models, also called statistical models, utilize big data sets and artificial intelligence (AI) algorithms to train a mathematical model which could express the relationship between inputs and prediction output, e.g., auto-regressive and moving average models (ARMA), neural networks (NN), support vector machines (SVM), and so on (Liu et al., 2016; Shao et al., 2018). Generally, these data-driven models can achieve relatively satisfactory performance on industrial data of wind farms in short-term forecasting. To further improve short-term wind power forecasting performance, hybrid models combining the advantages of several models are also proposed in literature. For example, in Ouyang et al. (2016), a hybrid model via switching models was proposed to obtain the optimal wind power prediction result, and the Markov chain was introduced as the switching regime. Moreover, many hybrid models usually utilize decomposed signals for prediction then combine these sub-predictions at last. For example, a hybrid model based on wind power time series decomposition was proposed for wind direction forecasting (Tang et al., 2020; Tang et al., 2021). Comparing these models, physical models usually explain the trend of the wind process meaningfully, because they govern the atmospheric behaviors in physics (Xiong et al., 2017). However, their precision in short-term prediction is generally low. On the other hand, those models involving data-driven algorithms may face two problems: one involves the subjective selection of AI algorithms; the other involves overfitting and under-fitting in many models, so the reliability and persuadability of these prediction models require more extra explanation.
Aiming at the mentioned problems above, this paper targets to propose a high-accuracy wind power prediction model combining the advantages of physical and data-driven models. First, as we know, the wind process is formed by atmospheric movement from the perspective of physics, namely, via the chaotic analysis of time series data (Lange and Focken, 2006; Lei et al., 2007). Based on chaotic analysis, the wind power time series could be reconstructed in a new phase space which could reflect both physical factors and statistical results of historical data. Second, if we analyze the wind process from a physical perspective, we would see that the pattern behind wind is variable, diversified, complicated, and uncertain. This is the reason why hybrid models with a switching regime and mode decomposition could succeed. Therefore, a hybrid prediction model considering wind patterns would also persuasively improve wind power prediction performance. Based on the above factors, the proposed method makes use of chaotic analysis and granular computing in wind power prediction and aims at realizing two contributions: 1) making use of chaotic analysis to reconstruct data, and to realize high effectiveness and efficiency with the reconstructed data in modeling; 2) considering the complexity and uncertainty of wind patterns, a hybrid model based on granular computing is proposed to reflect both physical and statistical factors. By taking industrial data from a wind farm as a studied case, the proposed approach is applied. Experiments and evaluation are discussed to validate the feasibility of the proposed wind power prediction model.
Time Series Reconstruction
According to the above description, time series reconstruction is to extract effective inputs for modeling. Considering the wind speed time series is physically chaotic (Lei et al., 2007), it could be reconstructed based on physical features in a new space where large information is represented by refined features. Assuming a time series as {x} = {x1, x2, ⋯, xN}, N is the length of the given data set, and it could be reconstructed into a new phase space according to the Takens embedding theory (Rand and Young, 1988). The reconstruction formula is expressed as below:
where {x} is the wind power time series in this paper; x is the reconstructed data belonging to a space Rm; and τ and m are the delay time and embedding dimension parameters in reconstruction. In this way, the reconstructed data could provide as much possible information with a limited number of dimensionalities, namely, improving effectiveness and efficiency in time series modeling (Tang et al., 2020). These two parameters can be calculated by the mutual information (MI) method (Fraser and Swinney, 1986) and false nearest neighbors (FNN) method (Abarbanel and Kennel, 1993), respectively. Through the selection of optimal delay time τ and embedded dimension m, a one-dimension time series could be reconstructed as Rm data by Eq. 1. In this way, the most relevant features could be included in the new data for modeling (Tang et al., 2020).
To judge if the reconstructed phase space is a chaotic system, some criteria are required. The Lyapunov exponent (Packard et al., 1980) was a useful metric to test a system’s characteristic, as expressed in Eq. 2. If the value of Lyapunov exponent is positive, the given system could be considered as a chaotic system. When it equals 0, the system is considered as having bifurcation points or periodic solutions. When its value is negative, the system has stable and fixed solutions. To calculate the value of the Lyapunov exponent, firstly, choosing a start point in the reconstructed space and its nearest neighbor, their distance is defined as L0. After the evolution of a given time T, two new points are obtained, and their new distance is defined as L′0. Then, new data and new distance pair (L1, L′1) are calculated as the same principle. When the last point in the phase space is calculated, we could calculate the Lyapunov exponent as below:
where M is the number of distance pairs. Through the calculation of the Lyapunov exponent in Eq. 2, we could judge if the reconstructed phase space and the original time series have chaotic features according to the above criterion.
Wind Power Prediction Model by Granular Computing
For chaotic time series, several prediction models are studied in the literature, e.g., local prediction models, global prediction methods, prediction methods based on the Lyapunov exponent, Volterra prediction models, and so on (Zhang and Liang, 2012). For wind power prediction, the meteorological regimes behind the wind process are various, so these models may just be suitable at specific time intervals. According to this idea, the hybrid model with a regime switching the optimal models would achieve better performance. However, considering the uncertainty of wind development, the accuracy of meteorological regimes at a given period is complicated and uncertain. Therefore, a hybrid model considering more prediction models and uncertainty is a better choice to improve performance. This is also the reason for proposing a hybrid prediction model via granular computing.
Granular Computing for Dividing Scenarios
Granular computing (GrC) is actually a process of grouping objects which have the same or similar information (Ouyang et al., 2021) (e.g. shapes, sizes, or other features) and use information granules (IGs) to analyze the abstract objects in real world. Based on these ideas, we proposed to construct information granules of different wind development processes and utilized these granules to guide prediction.
Generally, IGs are constructed by two factors: prototype and granule size. To partition an original data set into different categories, the Fuzzy C-Means (FCM) is widely applied (Chuang et al., 2006). Assuming the set {x} having N data points with c clusters, the membership matrix of each data point based on FCM could be calculated by the following expression:
where, xk∈{x}; uik is the membership to the ith cluster center, and m is a fuzzification coefficient and usually m = 2. Then, cluster centers could be selected as prototypes of granules, as below.
After the decision of these prototypes, a blueprint of IGs could be created. By concentrating on a prototype vi, a group of points could form a granule IGi which could also be wind scenario in our study. Besides the position information, the sizes of IGs are also important in evaluating their description performance. Generally, coverage and specificity are two important metrics (Ouyang et al., 2019). Assuming a granule is constructed as a hypersphere granule via Euclidean distance, the coverage and specificity can be calculated as below:
where ρ is the size of granule, satisfying
Wind Power Prediction Modeling
According to the process of granular computing, data sets could be divided into several granules based on similarity. For reconstructed wind power data, to analyze the meteorological scenarios to which each data point belongs, we could also construct scenario granules based on reconstructed wind power data {x}. While considering to utilize results of granular computing to improve the performance of wind power prediction, we propose to add the prediction errors into inputs in granular computing, defined as below:
where x is the reconstructed chaotic data and e1, e2, and e3 are prediction errors of three models (Local linear model, Lyapunov model, Volterra model) forecasting wind power independently. By using these inputs in granular computing, three information granules IGi (i = 1,2,3) reflecting the relationship of wind scenarios and prediction models could be constructed. Then, three fuzzy rules for determining a given data point’s scenario could be given as below:
While the granular computing is based on fuzzy analysis, the uncertainty of the wind process is also considered. According to the above rules, for the current data point xt, its belonging degree to each wind scenarios could be calculated by Eq. 3. Considering the uncertainty of xt belonging to wind scenarios, we propose to utilize the weighted hybrid model as the final prediction model, as below:
where the prediction model is regarded as a weighted model using fuzzy memberships as weights; c = 3 in this paper because only three chaotic time series models are considered.
Experiments and Discussion
According to the above description, we could complete the chaotic analysis and prediction modeling of wind power data. In this paper, we take the industrial data from wind farms as studied cases. The collected data is from a wind farm of northwestern China, which has a sampling interval of 15 min. The objective of this research is to predict the wind power output from the studied wind farm that has a totally installed capacity of 603 MW. The data set has 34,080 data points, among of which 70% is taken as training set and the rest are for testing. Moreover, raw wind data often contains random noise and abnormal values; therefore, suitable data pre-processing is required before modeling, for example, wind power denoising and abnormality cleaning.
Wind Power Data Reconstruction
According to the above description, the proposed prediction model is based on chaotic analysis. Therefore, reconstruction of wind power data and verification of the chaotic system is the first step. As the processes are described in Section 2, we need to select the optimal delay time and embedded dimension for phase space reconstruction via the mutual information method and FNN method. Results are shown in Figure 1.
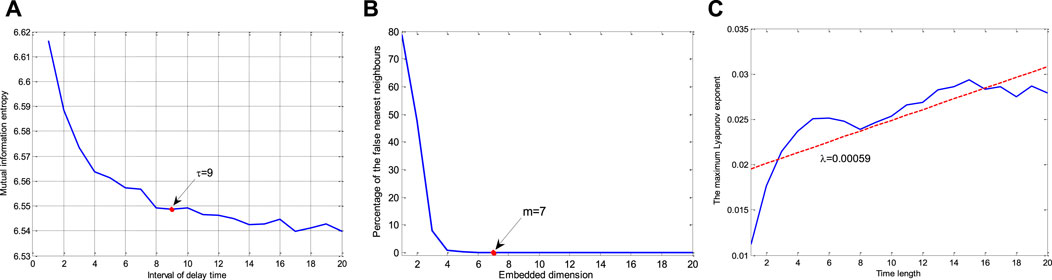
FIGURE 1. Calculation of the delay time (A), the minimum embedded dimension (B), and the Lyapunov exponent (C).
Figure 1A depicts the curve representing values of mutual information when the delay time τ increases. It is seen that the relevance becomes weak when delay time becomes large. Generally, the final delay time τ is decided when the value of mutual information reaches the first local minimum value. Therefore, the delay time of wind power is selected as τ = 9. It means that the closet nine points, e.g. x(t), x (t-1), …, x (t-8) have similar information, namely, dependent relation. In order to provide more information with lower dimensionality in modeling, two independent variables should be taken, such as x(t) and x (t-9). Figure 1B depicts the curve representing the number of false neighbor points when calculating the embedded dimension. When the value of the threshold is selected as ath = 10%, the percentage of false neighbors is 0% with reconstruction parameters m = 7. Combining with τ = 9, it implies that the correlation will be ended at the 7*9 = 63 step, but the new phase space can be considered for the reconstruction of the most important seven points. Then, according to the calculation of the Lyapunov exponent in Eq. 2, the solution of the Lyapunov exponent is calculated as λ = 0.00059. It illustrates that wind power data belongs to a chaotic system (λ > 0) according to the above description of the Lyapunov exponent. Then, the prediction models based on chaotic time series are feasible in wind power prediction.
Wind Power Prediction
By taking 70% of the given data set as the training data, the remaining data is used for validation and testing. First, by applying the reconstruction parameters calculated above, the phase space of wind power data is reconstructed based on Eq. 1. Since the reconstructed wind power time series is verified to be chaotic, it is used to train and predict wind power based on three given chaotic models in Section 3, namely, the local linear model, Lyapunov prediction model, and Volterra prediction model, labeled as S1, S2, and S3 respectively. Considering that each model has its best prediction performance at different time, we could consist of the reconstructed data and prediction errors of three models as inputs; three wind scenarios are analyzed by granular computing.
Figure 2 shows the division of three wind scenarios through granular computing. For convenience of presentation, only two elements [error3, x (t-6τ)] are used in plot. It is seen from Figure 2 that different scenarios for three chaotic time series models have clear division. Then, based on this division, fuzzy rules could be formed and the final hybrid model could be constructed by granular computing (Eq. 9). The performance of wind power prediction is expressed by four error metrics (Wu et al., 2014), namely, mean absolute error (MAE), root mean squared error (RMSE), standard deviation of absolute error (SDofAE), and correlation coefficients (CC), as presented in Table 1.
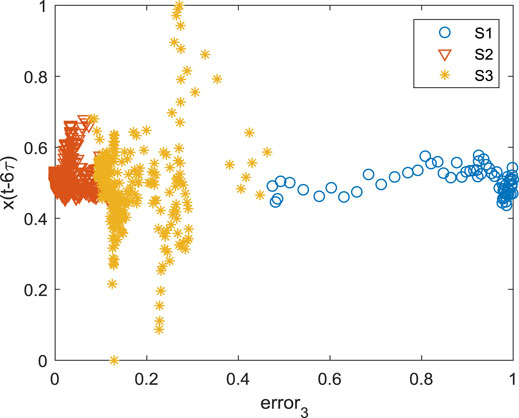
FIGURE 2. Division of wind scenarios.
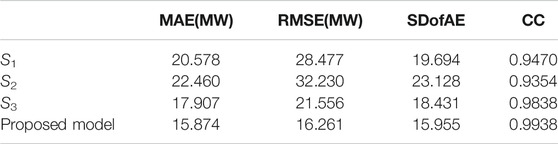
TABLE 1. Four error metrics of different prediction methods
S1, S2, and S3 represent three prediction models, respectively, and the proposed model is also compared. It is seen that the difference between the former three models is not large, and that S1 has the worst prediction performance and S3 has the best prediction performance according to the values of error metrics. In comparison, the performance of the proposed method is presented and improved greatly.
Comparison and Discussion
Moreover, based on the error metrics, some improvement coefficients were defined in (Wu et al., 2014), which are validated to be useful for studying performance improvement, as shown in Eq. 10.
where, IEM is the improvement coefficient and EM represents a given error metric (e.g. MAE, RMSE, etc.). When the value of IEM is larger than 0, it means the given model improves the performance w.r.t. the reference.
Table 2 shows the improvement coefficients of the proposed method by taking S1, S2, and S3 as the reference models. The coefficient of determination R2 is also proposed for analysis in Table 2. R2 is actually the improvement coefficient of the mean square error (MSE) defined in Eq. 11.

TABLE 2. Improvement coefficients of the proposed method vs. S1, S2, and S3
It is seen that the proposed model has an improvement on longitudinal errors by an average of 21.18% on MAE, 39% on RMSE, and 21.14% on SDofAE, which means the proposed method can improve the prediction performance greatly. On the other hand, the value of ICC is improved by an average of 4.07% since the value of CC is good.
Moreover, to compare the performance of other data-driven wind power prediction models, such as neural networks (NN), support vector machine (SVM), random forests (RF), boosting trees (BT), the MSAR model, and the generic linear combined model of S1, S2, and S3, Table 3 presents the improvement coefficients of the proposed method compared with these six models, as presented below.
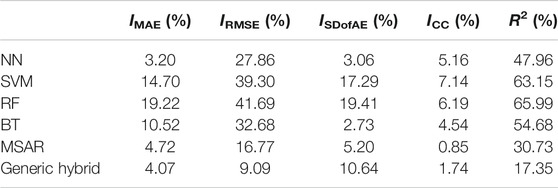
TABLE 3. Improvement coefficients of traditional prediction models
It is seen that the proposed method still improves the prediction performance greatly, compared with traditional methods. By comparing with traditional AI algorithms, the improvements on errors have an average of 11.91% on MAE, 35.38% on RMSE, 10.62% on SDofAE, and 5.76% on CC. By comparing with two advanced hybrid models, the improvements are 4.4% on MAE, 12.93% on RMSE, 7.92% on SDofAE, and 1.3% on CC. It is seen that hybrid models have better performance than traditional AI models. Since all the values are positive, these results verify that the proposed model has indeed improved the wind power prediction performance when compared with both traditional models and hybrid models.
Conclusion
To improve the performance of short-term wind power prediction, this paper proposed a new hybrid model based on granular computing and chaotic data reconstruction. By reconstructing the wind power time series into chaotic phase space, more information could be provided with a low dimensionality for modeling. Then, considering the uncertainty and diversity of wind development scenarios, three chaotic models are constructed and their corresponding scenarios are constructed as information granules by granular computing. Finally, the proposed model is realized by granular computing and chaotic time series prediction models. Experiments on wind power prediction verify the superiority of the proposed model. Through the improvement coefficient shown in Tables 2–3, it is validated that the proposed method improves the accuracy of wind power prediction than most traditional models. Therefore, it is concluded that the proposed method is feasible and effective. It will be helpful for directing wind power scheduling and planning in the future.
Data Availability Statement
The raw data supporting the conclusion of this article will be made available by the authors, without undue reservation.
Author Contributions
YW put forward the main research points; WX completed the manuscript writing and revision; ES and QL completed the simulation research; NY and PF collected relevant background information; KG and YH revised grammar and expression. All authors contributed to manuscript revision and read and approved the submitted version.
Conflict of Interest
SE is employed by State Grid Hubei Electric Power Co. LTD. YW, WX, QL, PF, KG, and YH is employed by State Grid Yichang Power Supply Company.
The remaining authors declare that the research was conducted in the absence of any commercial or financial relationships that could be construed as a potential conflict of interest.
Publisher’s Note
All claims expressed in this article are solely those of the authors and do not necessarily represent those of their affiliated organizations, or those of the publisher, the editors, and the reviewers. Any product that may be evaluated in this article, or claim that may be made by its manufacturer, is not guaranteed or endorsed by the publisher.
References
Abarbanel, H. D. I., and Kennel, M. B. (1993). Local False Nearest Neighbors and Dynamical Dimensions from Observed Chaotic Data. Phys. Rev. E 47 (5), 3057–3068. doi:10.1103/physreve.47.3057
Brouwer, A. S., Van den Broek, M., Özdemir, Ö., Koutstaal, P., and Faaij, A. (2016). Business Case Uncertainty of Power Plants in Future Energy Systems with Wind Power. Energy Policy 89, 237–256. doi:10.1016/j.enpol.2015.11.022
Chuang, K.-S., Tzeng, H.-L., Chen, S., Wu, J., and Chen, T.-J. (2006). Fuzzy C-Means Clustering with Spatial Information for Image Segmentation. computerized Med. Imaging graphics 30 (1), 9–15. doi:10.1016/j.compmedimag.2005.10.001
Doostizadeh, M., Aminifar, F., and Lesani, H. (2017). Coordinated Multi-Area Energy and Regulation Joint Dispatch under Wind Power Uncertainty. J. Renew. Sustain. Energ. 9 (2), 023303. doi:10.1063/1.4978305
Fraser, A. M., and Swinney, H. L. (1986). Independent Coordinates for Strange Attractors from Mutual Information. Phys. Rev. A. 33 (2), 1134–1140. doi:10.1103/physreva.33.1134
Lange, M., and Focken, U. (2006). Physical Approach to Short-Term Wind Power Prediction. Berlin: Springer, 1–208.
Lei, D., Lijie, W., Shi, H., Shuang, G., and Xiaozhong, L. (2007). “Prediction of Wind Power Generation Based on Chaotic Phase Space Reconstruction Models,” in Power Electronics and Drive Systems, 2007. PEDS'07. 7th International Conference on (IEEE), 744–748. doi:10.1109/peds.2007.4487786
Li, L., Teng, Y., and Wang, X. (2017). Dynamic Equivalent Modeling of Wind Farm Considering the Uncertainty of Wind Power Prediction and a Case Study. J. Renew. Sustain. Energ. 9 (1), 013301. doi:10.1063/1.4973445
Liu, K., Zhang, Y., and Qin, L. (2016). A Novel Combined Forecasting Model for Short-Term Wind Power Based on Ensemble Empirical Mode Decomposition and Optimal Virtual Prediction. J. Renew. Sustain. Energ. 8 (1), 013104. doi:10.1063/1.4939543
Liu, Y., Shi, J., Yang, Y., and Lee, W.-J. (2012). Short-Term Wind-Power Prediction Based on Wavelet Transform-Support Vector Machine and Statistic-Characteristics Analysis. IEEE Trans. Ind. Applicat. 48 (4), 1136–1141. doi:10.1109/tia.2012.2199449
Ouyang, T., Pedrycz, W., and Pizzi, N. J. (2019). Record Linkage Based on a Three-Way Decision with the Use of Granular Descriptors. Expert Syst. Appl. 122, 16–26. doi:10.1016/j.eswa.2018.12.038
Ouyang, T., Pedrycz, W., Reyes-Galaviz, O. F., and Pizzi, N. J. (2021). Granular Description of Data Structures: A Two-phase Design. IEEE Trans. Cybern. 51 (4), 1902–1912. doi:10.1109/tcyb.2018.2887115
Ouyang, T., Zha, X., Qin, L., Xiong, Y., and Xia, T. (2016). Wind Power Prediction Method Based on Regime of Switching Kernel Functions. J. Wind Eng. Ind. Aerodynamics 153, 26–33. doi:10.1016/j.jweia.2016.03.005
Packard, N. H., Farmer, J. P. J. D., Shaw, R. S., Farmer, J. D., and Shaw, R. S. (1980). Geometry from a Time Series. Phys. Rev. Lett. 45 (9), 712–716. doi:10.1103/physrevlett.45.712
Shao, H., Deng, X., and Jiang, Y. (2018). A Novel Deep Learning Approach for Short-Term Wind Power Forecasting Based on Infinite Feature Selection and Recurrent Neural Network. J. Renew. Sustain. Energ. 10 (4), 043303. doi:10.1063/1.5024297
Tang, Z., Zhao, G., and Ouyang, T. (2021). Two-phase Deep Learning Model for Short-Term Wind Direction Forecasting. Renew. Energ. 173, 1005–1016. doi:10.1016/j.renene.2021.04.041
Tang, Z., Zhao, G., Wang, G., and Ouyang, T. (2020). Hybrid Ensemble Framework for Short-Term Wind Speed Forecasting. IEEE Access 8, 45271–45291. doi:10.1109/access.2020.2978169
Wu, B., Song, M., Chen, K., He, Z., and Zhang, X. (2014). Wind Power Prediction System for Wind Farm Based on Auto Regressive Statistical Model and Physical Model. J. Renew. Sustain. Energ. 6 (1), 013101. doi:10.1063/1.4861063
Xiong, Y., Zha, X., Qin, L., Ouyang, T., and Xia, T. (2017). Research on Wind Power Ramp Events Prediction Based on Strongly Convective Weather Classification. IET Renew. Power Generation 11 (8), 1278–1285. doi:10.1049/iet-rpg.2016.0516
Yan, J., Gao, X., Liu, Y., Han, S., Li, L., Ma, X., et al. (2015). Adaptabilities of Three Mainstream Short-Term Wind Power Forecasting Methods. J. Renew. Sustain. Energ. 7 (5), 053101. doi:10.1063/1.4929957
Keywords: wind power prediction, hybrid model, time series, chaotic analysis, granular computing
Citation: Wang Y, Xiong W, E. S, Liu Q, Yang N, Fu P, Gong K and Huang Y (2022) Wind Power Prediction Based on a Hybrid Granular Chaotic Time Series Model. Front. Energy Res. 9:823786. doi: 10.3389/fenrg.2021.823786
Received: 28 November 2021; Accepted: 27 December 2021;
Published: 04 February 2022.
Edited by:
Tinghui Ouyang, National Institute of Advanced Industrial Science and Technology (AIST), JapanReviewed by:
Davide Astolfi, University of Perugia, ItalyLin Zhu, South China University of Technology, China
Copyright © 2022 Wang, Xiong, E., Liu, Yang, Fu, Gong and Huang. This is an open-access article distributed under the terms of the Creative Commons Attribution License (CC BY). The use, distribution or reproduction in other forums is permitted, provided the original author(s) and the copyright owner(s) are credited and that the original publication in this journal is cited, in accordance with accepted academic practice. No use, distribution or reproduction is permitted which does not comply with these terms.
*Correspondence: Yanyang Wang, MTM5NzI1Nzg0MjBAMTYzLmNvbQ==