 Qingqing Hu
 Xue Li
 Yanhong Feng3*
- 1School of International Studies, Hunan Institute of Technology, Hengyang, China
- 2School of Economics and Statistics, Guangzhou University, Guangzhou, China
- 3School of Economics, Management and Law, University of South China, Hengyang, China
Understanding the effects of green credit on green total factor productivity (GTFP) is conductive to promoting the sustainable economy development. This paper examines the total effects, influence mechanism, and heterogeneous impacts of green credit on GTFP based on GTFP data of 30 provinces in China from 2008 to 2017. The findings show that, firstly, on the whole, green credit significantly increases GTFP, which is tested by the panel regression model. Secondly, according to the result of the panel quantile model, the increasing effect of green credit on GTFP is strengthened by the improvement of GTFP. Thirdly, green credit has heterogeneous impact on GTFP, which is reflected in economic development with different level, especially for different degrees of environmental regulation. Fourthly, under the full samples, green credit impacts GTFP through green technology innovation, but it has no effect on energy consumption structure. Besides, the influence mechanism is heterogeneous in the variation of sample characteristics. Finally, some significant policy recommendations are provided for policymakers based on these conclusions.
Introduction
The United Nations environmental programme points that financing is one of the greatest challenges to promote green economy transformation. In fact, the government-centered financing mode cannot be adapted to the requirements of sustainable development (Ming et al., 2014). However, as an act of the financial institution, it actively supports the financing of environmental protection and energy conservation projects. Green finance can guide social funds to the field of green production and promote green economic transformation through the innovation of financial instruments. Then, for most developing countries, “green credit” still plays a role of the main channel of green project financing, and also the main force to build green financial system. Moreover, GTFP is developed based on the traditional total factor productivity accounting framework, which takes both environmental factors and the impact of energy consumption into consideration (Mohtadi, 1996). Consequently, GTFP is considered as a suitable indication for measuring the sustainable development of a country or region (Li et al., 2020a; Li et al., 2021a). In view of the above analysis, it is of great practical significance to study the impact of green credit on the GTFP.
Existing researches on GTFP mainly focuses on its measurements and influencing factors. Parametric method and non-parametric method are common ways to measure GTFP. Among these measurement methods, Solow residual method and stochastic frontier analysis method are representative methods of parametric methods (Carroll et al., 2011). The most widely used non-parametric method is data envelopment analysis (DEA) (Lin and Chen, 2018; Demirtaş et al., 2020). Then, the influencing factors of GTFP are rich and diverse. In general, the existing studies mainly study the influencing factors of GTFP from the following perspectives: firstly, technological progress or innovation is an important factor. Some researchers examine the relationship between manufacturing GTFP and technological progress, and also prove that technological progress plays a significant role in improving manufacturing GTFP (Shi and Li, 2019). Innovation promotes GTFP; whereas economic policy uncertainty inhibits GTFP based on research of 30 provinces in China from the period 2005 to 2016 (Yuan et al., 2021), as well as the revelatory from its affect on the corporate risk-taking and carbon futures prices (Wen et al., 2021a; Wen et al., 2021b). Base on the research of 285 Chinese cities from 2003 to 2017, green technology progress is conducive to the improvement of urban GTFP (Yu et al., 2021). Besides, the major crisis events and important political and economic events also have certain influence on market, exchange rate and global efficiency (Li et al., 2020b; Hou et al., 2021; Zheng et al., 2021), which effect GTFP indirectly to some extent. Secondly, environmental regulation has a significant positive effect on the GTFP (Liang et al., 2020). Thirdly, appropriate fiscal decentralization can improve GTFP; otherwise, GTFP decreases (Song et al., 2018). In addition, other study indicates that GTFP is negatively influenced by coal intensity and industrial structure (Zhang et al., 2016). In particular, a few scholars analyze the relationship between financial development and GTFP. For example, by examining 40 countries from 1991 to 2014, they find that there is an inverted U-shaped relationship between financial development and GTFP (Li and Liao, 2020). It can be seen that GTFP is affected by different factors with different forms and directions.
However, the existing literature pays less attention to the impact of green credit on GTFP and its heterogeneity directly. Previous studies mainly pay more attention to the role of green credit or green finance in green economic growth or sustainable development. A research believes that green credit is a sustainable financing method, that is, banks provide financing facilities for green projects through credit that can achieve the purpose of guiding sustainable development (Jeucken, 2001). Another research argues that green finance is an innovative move in the development of financial institutions, which can realize the coordinated and healthy development of economy and environment (Scholtens, 2006). Besides, an empirical research verifies that the development of green credit can promote green economic growth (Hu et al., 2011). Actually, green finance can create a win-win situation regarding economic development and the environment through developing a model based on the theory of the environmental Kuznets curve (Zhou et al., 2020). In addition, in view of the coordination between green finance and green economy, some investigations prove that the coordination degree of green finance and the green economy is relatively low and show strong spatial dependence (Liu et al., 2020). From the above, it should be noted that few studies have investigated the relationship between green credit and green economic growth from the perspective of GTFP, and even the heterogeneous influence of green credit on GTFP.
As an important financial means, green credit can guide the capital flow to green and low-carbon areas. Green credit is the main force of ecological civilization construction, which is conducive to curb the blind expansion of high energy consumption and heavy pollution industries (Zhang et al., 2011), and plays an important role in promoting the development of GTFP. In addition, the impact of green credit on GTFP is heterogeneous under different factors. On this basis, taking China as an example, this study of the impact of green credit on GTFP is of great significance to the sustainable development of a country’s economy. Here are the main contributions as follows.
Firstly, from the perspective of efficiency, the impact of green credit on green economic development by measuring GTFP is studied for the first time. This is a significant supplement to the previous research in terms of green finance and green economy development. Previous studies pay attention to the relationship between green finance and green economic growth, but the literatures of the impact of green credit on GTFP is relatively scarce. Because efficiency of green development is an important factor of sustainable development, it is significant to explore the impact of green credit on GTFP.
Secondly, the heterogeneous impact of green credit on GTFP is investigated from different perspectives, which also provides new empirical research perspectives and evidences for their relationships. However, the heterogeneous effect of green credit on GTFP has not attracted more attention. On the one hand, the promotion effect is heterogeneous under different GTFP levels. Specifically, with the improvement of the GTFP level, the promotion effect of green credit on GTFP is significantly strengthened. On the other hand, the impact of green credit on GTFP is closely related to the sample characteristics such as different economic development levels, especially environmental regulation degrees.
Thirdly, based on the heterogeneous impact under the characteristics of different samples, the impact mechanism and its heterogeneity are further discussed, which helps to better understand the impact of green credit on GTFP. This paper finds that green credit can impact GTFP through green technology innovation, but has no effect through energy consumption structure on the whole. However, the impact mechanism of green credit on GTFP is heterogeneous under different sample characteristics.
The remainder of this paper is arranged as follows. Section 2 expounds the research hypothesis and introduces the model and data. Section 3 studies the total effects and influence mechanism of green credit on GTFP. Then, the heterogeneity of the impact of green credit on GTFP is tested based on the characteristics of different samples in section 4. Section 5 not only discusses the deviation degree of different subsamples from the full sample, but also analyzes the heterogeneity of the impact mechanism of green credit on GTFP under different samples. Lastly, section 6 concludes our paper with a note on limitation and implications.
Hypotheses, Method, and Data
Hypotheses
Green credit improves GTFP. Credit capital is an important driving force of modern economic development, which supports and guides the development of a real economy. Based on the national environmental protection policy and related industrial policies, green credit is an important part of “Green development,” and guided by the core value of social responsibility (He et al., 2019). Through differentiated monetary and financial policies, green credit guides funds to invest in green fields by utilizing credit tilt and interest rate floating, and then forms green investment and provides capital support for green economic growth (Soundarrajan and Vivek, 2016). Meanwhile, by controlling the direction of credit, polluting industrial structures can be eliminated or restructured, and then promote green economic growth. A research theoretically confirms that green credit can promote cleaner production innovation (Li et al., 2018). For the enterprises, green credit provides R&D investment capital for their green technology innovations, which increasingly becomes an important driving force to improve their competitive advantages and green transformation (He et al., 2019). Green credit is the innovation of financial concepts, which reflects the sustainable development of the economy and Society (Xu, 2020). Therefore, green credit has a promoting effect on the promotion of GTFP. Based on the above analysis, the following hypothesis is put forward:
H1: Green credit has a promoting effect on GTFP.
Green credit aims to support regional energy conservation and environmental protection industries. These are capital-intensive and technology-intensive industries with a long output cycle and require a large amount of capital input and capital support (Feng et al., 2020; Huang et al., 2021). Therefore, the full improvement of green credit on GTFP requires a certain amount of capital and technology accumulation. When the certain region’s GTFP is low, it means that they don’t have good green technology conditions and infrastructure. Hence, it is difficult for green credit to produce effects in a short time, and also has little effect on the improvement of GTFP. With the improvement of GTFP, the enterprises in certain areas have better green technology level and infrastructure, and also have more confidence in green development. Under this condition, green credit further provides financial support for the promotion of green development level. Therefore, enterprises pay more and more attention to green development and adopt environment-friendly technology to carry out green production actively. And then the production efficiency of enterprise is improved greatly due to the Capital and technological advantages, which further improves GTFP in the region further.
H2: The promoting effect is heterogeneous with the change of GTFP level.
Influenced by economic development level and environmental regulation, the impact of green credit on GTFP is heterogeneous. Firstly, the impact of green credit on GTFP is related to the level of economic development. On one hand, economic development brings technological progress, and technological progress is conducive to breaking through the technical bottleneck of the green industry and then promoting green economic development (Meirun et al., 2021). Compared to areas with a low level of economic development, the green economy development level of areas with a high level of economic development is also higher. In this case, the effect of introducing green credit to different economic development level areas is different. Therefore, the difference in economic development level makes different impact of green credit on GTFP.
H3: With different economic development level, the impact of green credit on GTFP is heterogeneous.
In addition, environmental regulation is one of the most effective measures to solve the problem of excessive use of elements and externality of environmental pollution (Li and Wu, 2017). Compared with the low-level environmental regulation areas, the areas with high environmental regulation need to invest more funds and energy for pollution control and emission reduction. In this case, the introduction of green credit can provide financial support for environmental governance. Therefore, with different environmental regulations, the impact of green credit on GTFP is heterogeneous. From the above analysis, the following hypothesis is also provided:
H4: With different environmental regulation degree, the impact of green credit on GTFP is heterogeneous.
Green credit may impact GTFP through two channels of green technology innovation and energy consumption structure. On one hand, green credit guides capital flow to green and low-carbon areas, which has a profound impact on the business decision-making like green technology innovation investment of relevant enterprises (Li et al., 2018). In other words, green credit can improve the green technology innovation due to solving the financing problem for environmental protection enterprises to a certain extent. And then, green technology innovation can significantly promote the improvement of GTFP (Wang et al., 2021). Therefore, green credit may affect GTFP through green technology innovation.
On the other hand, through controlling the scale and direction of credit, green credit transfers funds to green industries such as new energy, energy conservation, and environmental protection, and help enterprises to eliminate with high energy consumption and high pollution (Soundarrajan and Vivek, 2016), which changes the energy consumption structure. In addition, green credit will attract extensive attention from the public. With consideration for their own health, consumers will also require enterprises to reduce the emission of high-carbon pollutants. Hence, it indirectly promotes enterprises to enhance their sense of social responsibility and optimize the energy consumption structure. The increase of the proportion of clean energy is conducive to the reduction of pollutant emissions (Dogan and Seker, 2016; Zoundi, 2017), and then improve energy efficiency. Therefore, green credit may affect GTFP through energy consumption structure. Here are the following hypotheses:
Methods
Benchmark Panel Regression Model
To test the impact of green credit on GTFP, this paper refers to some existing studies and establishes the following panel benchmark panel regression model (Tuzcuoğlu, 2020; Chen et al., 2021):
Where, the subscripts i and t represent the province and year respectively. GTFP is the explained variable, namely green total factor productivity. GC is the core explanatory variable, namely green credit. Control stands for controlling variables. T is the year fixed effect, and
Panel Quantile Model
In order to further test the heterogeneity of the impact of green credit on GTFP under different levels of GTFP, the panel quantile model which is considered superior to OLS for verification is used (Li et al., 2021b). Compared with ordinary regression methods, quantile regression can make an estimate of explanatory variables at various quantiles in the conditional distribution (Canay, 2011), and it can effectively avoid the heteroscedasticity problem of the data. Therefore, the following panel quantile regression model is established:
Where
Mediating Effect Model
In addition, in order to analyze the impact mechanism of green credit on GTFP, the mediation effect model for verification is used. Firstly, verify the comprehensive effect of green credit on GTFP, the intermediary variables are temporarily not added to the model, as shown in Formula (1)). Secondly, in order to identify whether green credit has an impact on the intermediary variables, the intermediary variables are taken as the explained variables, and the green credit is taken as the core explanatory variable, as the following Formula (3). Finally, Formula (4) is constructed which including the explained variables, intermediary variables, core explanatory variables, and control variables, in order to test the mediating effect of intermediary variables in the impact of green credit on GTFP.
Where M is the intermediary variable, and the implication of the rest variables are consistent with Formula (1).
Based on these formulas, the improved stepwise regression method of causality test is adopted for testing by taking the practice of Wen and Ye (2014) as reference (Wen and Ye, 2014). The specific inspection steps are as follows:
Variables and Data Source
Measurement of GTFP
This paper measures GTFP index by the DEA method. Compared with Solow residual method and stochastic frontier analysis method, DEA has been widely used in GTFP calculation, which can avoid the deviation caused by setting production function form in advance. Non-radial, non-angular SBM directional distance function and GML index (Oh, 2010) are adopted in this work measuring the GTFP level of each province in China. The basic idea is to treat each province as a decision-making unit, and each unit includes input, desired output, and undesired output. Assuming that each province uses M kinds of inputs
Where
Because input and output slack variables have an impact on efficiency, the SBM direction function is applied by considering undesired output (Fukuyama and Weber, 2009). The SBM direction function is shown in Formula (6).
Further, according to the research of Oh (2010) (Oh, 2010), the GML index is established as shown in Formula (7).
GML represents the growth rate of GTFP relative to the former period. When
The measurements of GTFP are including input elements and output elements. Among them, the input elements include labor input, capital input, and resource input; whereas the output elements include desirable outputs and undesirable outputs. The variables involved in GTFP measuring and their measurement methods are shown in Table 1. Figure 1 reports the average distribution of GTFP levels of sample provinces and cities during the investigation period (The figure only shows sample provinces and cities in this research, excluding sea areas, etc.).

TABLE 1. The selection index of GTFP measurement.
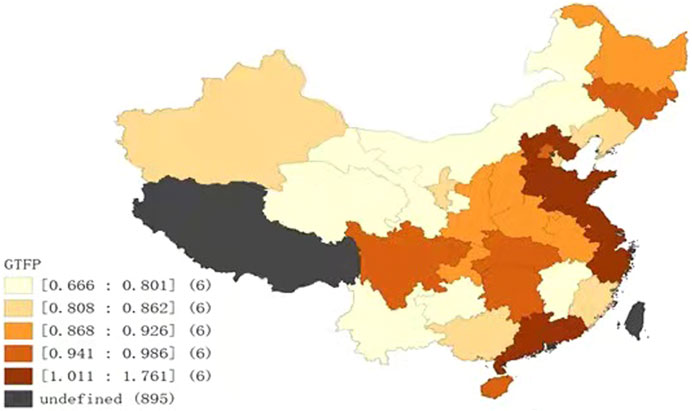
FIGURE 1. Mean GTFP values from 2008 to 2017.
Measurement of Other Variables
For the green credit (GC) index, according to Guo et al. (Guo et al., 2019), the proportion of interest expenditure in the six high-energy-consuming industries is adopted for its measurement. However, the proportion of interest expenditure of the six industries is a reverse index to measure the green credit, so this paper measures the green credit by taking 1 to minus the proportion of interest expenditure of the six industries. Six high energy-consuming industries include chemical raw materials and chemical products manufacturing industry, non-metallic mineral products industry, ferrous metal smelting and rolling processing industry, non-ferrous metal smelting and rolling processing industry, petroleum processing coking and nuclear fuel processing industry and power, thermal production and supply industry.
In addition, some relevant variables to control the impact of green credit on GTFP are also introduced. Due to the numerous influencing factors of GTFP, five control variables are added, namely environmental regulation, FDI, GDP, industrial structure, and human capital into the modeling process based on the existing research (Kong et al., 2021; Yu et al., 2021). The detailed description and calculation methods of the above variables are shown in Table 2.
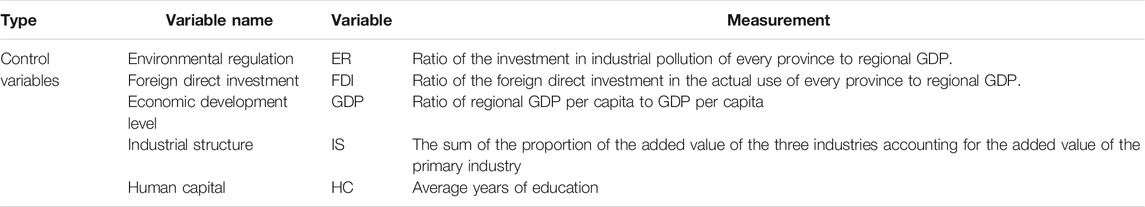
TABLE 2. Controlling variables.
The research targets are 30 provinces in China (except Tibet). Considering the availability of provincial data, the data frequency selected in this paper is annual data, and the time dimension of the selected data is from 2008 to 2017. The data come from the National Bureau of Statistics, the Regional Statistical Yearbook, the China Industrial Statistical Yearbook, the China Science and Technology Statistical Yearbook, and EPS. Some missing data are supplemented by the interpolation method.
Descriptive Statistics
Table 3 reports the description of each variable statistics results. The minimum value of GTFP is 0.534104, the maximum value is 2.193947, and the mean value is 0.930598, indicating that the overall level of GTFP is low. The minimum value of green credit is 0.093954, the maximum value is 0.779496, and the mean value is 0.455714, showing that the overall level of green credit was moderate. In order to clearly understand the GTFP and time change trend of green credit, the GTFP average and green credit average time trend diagram is shown in Figure 2A. Moreover, in order to further analyze the heterogeneity between GTFP and the green credit with different sample characteristics, all samples are grouped by 50% quantile of the economic development level, and degree of environmental regulation. The average time trend diagram of GTFP and green credit under different samples are shown in Figures 2B,C.
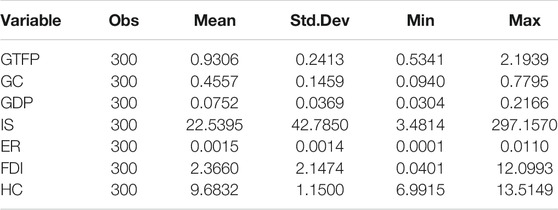
TABLE 3. Descriptive statistics of variables.
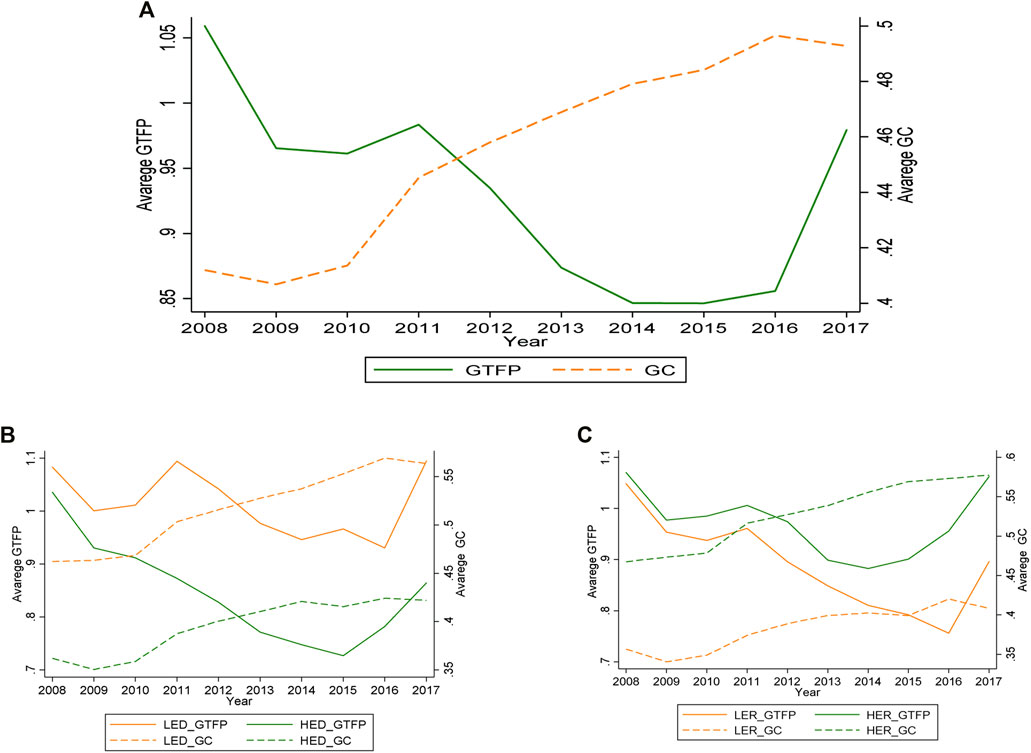
FIGURE 2. The annual mean time trend of GTFP and GC.
Figure 2 shows the annual mean trend of GTFP and green credit across the country in different subsamples. From Figure 2A GTFP shows a trend of the first decline and then rise. To be specific, GTFP shows a downward trend from 2008 to 2014; whereas it begins to increasing after 2014. Overall, the green credit shows a trend of rising. From Figure 2B, among the provinces with different economic development levels, the annual mean values of GTFP and green credit in the provinces with lower economic development levels are much higher than those in the provinces with higher levels. It can be seen that the average levels of GTFP and green credit are significantly different in regions with different levels of economic development. Figure 2C shows that provinces with higher levels of environmental regulation have higher GTFP and green credit average than in the low-level province. The GTFP gap gradually increases with time. In conclusion, the average levels of GTFP and green credit in regions with different environmental regulation degrees are heterogeneous.
Table 4 is the Pearson correlation matrix, which reports the correlation coefficients among variables. It shows that the correlation coefficient is significantly positive between GTFP and green credit, and also between GTFP and GDP, but significantly negative between GTFP and environment, which suggests that there is a positive correlation connection between GTFP and green credit.
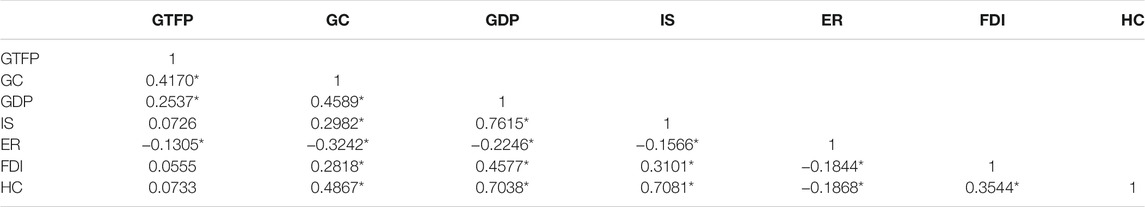
TABLE 4. Results of the variable correlation coefficient.
Total Effect and Mechanism Analysis
Next, the stationarity test and other related preprocessing on the variables are carried out. Then, the panel benchmark regression model is used to test the impact of green credit on GTFP as a whole. Finally, the panel quantile regression model is used to analyze the heterogeneity of the impact of green credit on GTFP with different GTFP levels.
Table 5 reports the stationarity test results of each variable. In this paper, two common methods are used to test the stationarity of data. The first method is the Levin-Lin-Chu unit-root test (Levin et al., 2002); the second one is the standard Augmented Dickey-Fuller t-test (Dickey and Fuller, 1981). Table 5 reports the test results of these two methods, which show that the null hypothesis of the existence of unit roots can be rejected at the significance level of 1%, that is, the variables are considered to be stable.
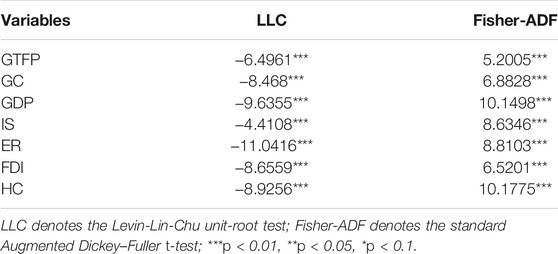
TABLE 5. The results of Unit root tests.
Benchmark Regression Analysis of GC on GTFP
Table 6 shows the results based on the benchmark panel regression model, i.e. the model parameter estimation results of Formula (1). As can be seen as below, the improvement of green credit is conducive to the improvement of GTFP. In the column (1) and (2), the baseline regression results without considering control variables show that green credit has a significant promoting effect on the improvement of GTFP, whether control the time effect or not. In order to control the influence of other variables on GTFP, the influence of green credit on GTFP by introducing controlled variables is analyzed. Columns (3) and (4) represent situations that consider control variable without or with time effect, respectively. The regression coefficients of green credit in column (3) and (4) are 0.7436, 0.8047, which are significant at the significance level of 1%. It indicates that the improvement of green credit is conducive to the improvement of GTFP, which proves the Hypothesis 1. On one hand, green credit guides funds to invest in green fields, and then forms green investment and provides capital support for green economic growth (Soundarrajan and Vivek, 2016). On the other hand, by controlling the direction of credit, polluting industrial structures can be eliminated or restructured, and then promote GTFP.
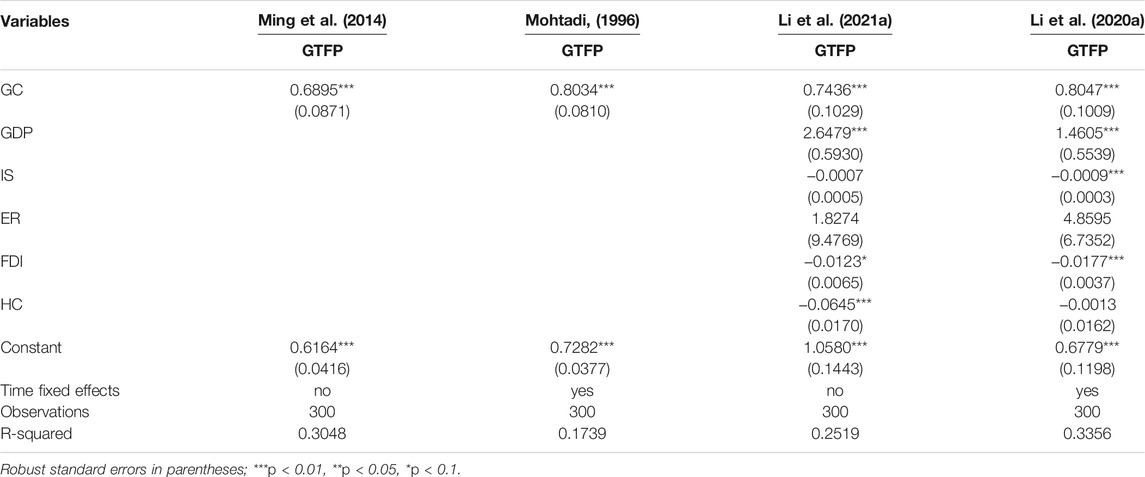
TABLE 6. Benchmark regression results.
Robustness Test
Endogeneity Problem
The robustness test results in the column (1)–(4) of Table 7 indicate that the estimated results are robust. This paper carries out a robustness test from the following three perspectives. Firstly, to alleviate the model of endogenous, the one-period-lagging green credit is introduced as a tool variable, and GMM model are used for estimation (Column (1)). Secondly, considering the lag effect of GTFP, it introduces one-period-lagging GTFP into the fixed panel model for estimation (Column (2)). Thirdly, due to the large time span involved in the sample, the sample time is shortened to 2011–2017, and the panel benchmark regression model is used for estimation (Column (3)). The regression results of the columns (1), (2) and (3) show that green credit has a promoting effect on GTFP significantly. Compared with the regression results in the column (4) in Table 6, the sign of the green credit regression coefficient in the robustness test results is same, but there are slight differences in the absolute value and significance of the coefficient, which indicating that the estimation results of the benchmark regression model are robust.
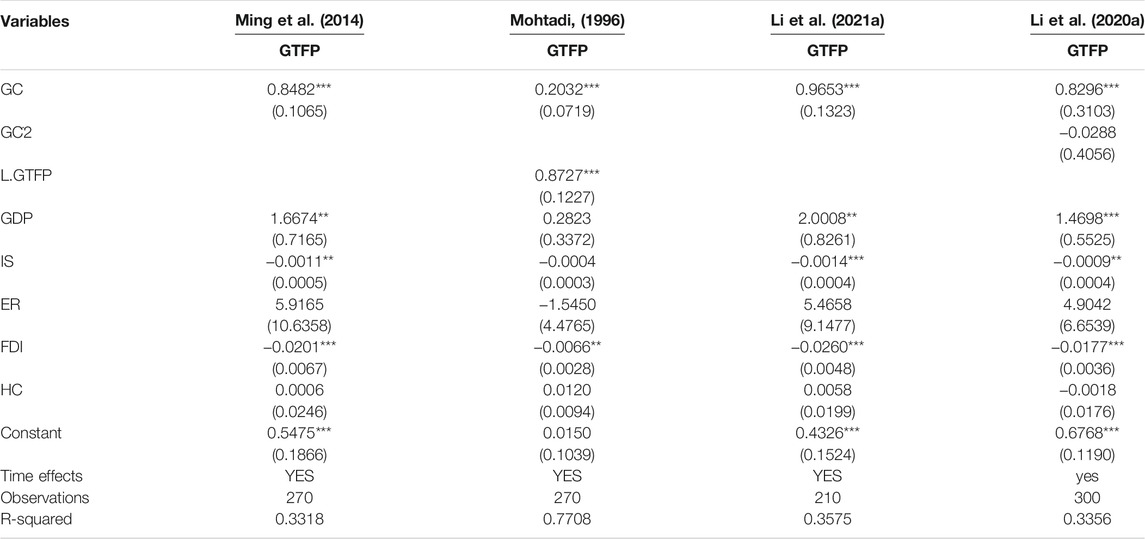
TABLE 7. Robustness regression results.
Test of Nonlinear Relationship
In order to test the nonlinear relationship between green credit and GTFP, we take references of the existing studies (Matei, 2020; Li et al., 2021c), and add the green credit squared item (GC^2) in the benchmark model. The estimated results are shown in Column (4) in Table 7. The regression coefficient of green credit is significant at the level of 1% significantly, whereas the green credit squared item (GC^2) is not significant. Hence, it indicates that green credit and GTFP don’t have nonlinear relationship, which means that the conclusion of linear benchmark regression is robust.
Multicollinearity Problem
Considering that multicollinearity may lead to the deviation of the estimation results, the variance inflation factor (VIF) of the regression model is calculated to test whether multicollinearity exists in the multivariable model or not. As can be seen from Table 8, VIF of all influencing factors is less than 10. In addition, the mean VIF is 2.6, also less than 10. Therefore, it can be considered that there is no multicollinearity between explanatory variables and control variables, which indicates that the results of the benchmark regression model are more reliable.
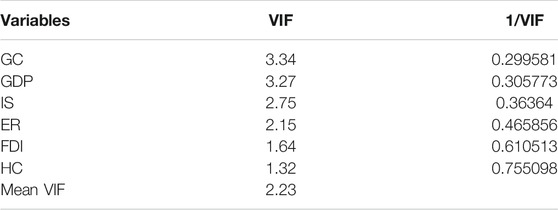
TABLE 8. Multicollinearity diagnosis.
Influnece Mechanism Test
In this subsection, green technology innovation and energy consumption structure are selected as mediating variables to test the mediating effect of green credit impact on GTFP respectively. In this test, green technology innovation (GTI) is measured by the logarithm of green patent application numbers. Energy consumption structure (ECS) is measured by taking 1 minus the proportion of coal terminal consumption that equivalent to standard coal in energy terminal consumption. The data are from the regional statistical yearbook and China Statistical Yearbook on Science and Technology. The results of the mediating model (1), (3) and (4) are estimated respectively based on the OLS method, which are shown in Table 9.
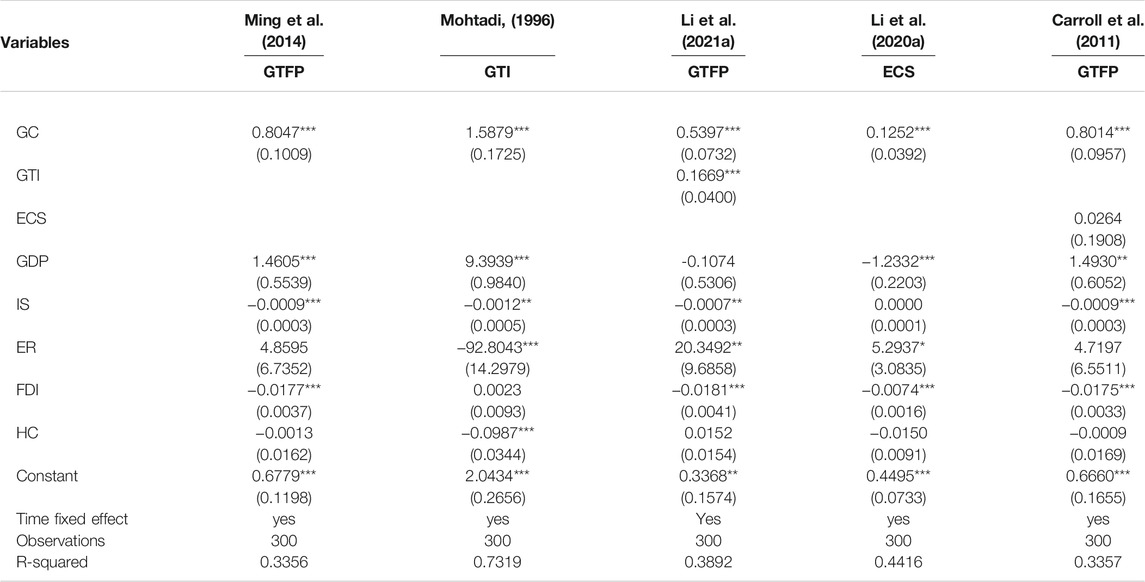
TABLE 9. Test of mediating effect of green technology innovation and energy consumption structure.
To begin with, column (1), (2) and (3) in Table 9 shows the test results of mediating effect of green technology innovation on the impact of green credit on GTFP. More specifically, the estimated value of regression coefficient of green credit on GTFP in column (1), that of green credit on green technology innovation in column (2), and that of green technology innovation on GTFP in column (3) are all significant at 1% significance level. It proves that there is a significant mediating effect of green technology innovation on the impact of green credit on GTFP. This supports Hypothesis 5a. The reason is that green credit is conducive to improving R&D investment, thus it improves the level of green technology innovation, and then affects GTFP.
Next, the mediating effect of energy consumption structure on the impact of green credit on GTFP is also tested. The results are shown in the column (4)–(6) in Table 9 and in Table 10, which indicates that energy consumption structure doesn’t play a mediating role in green credit and GTFP again. Hence, Hypothesis 5b cannot be verified. Because of the endowment advantage and price advantage of coal, China’s primary energy consumption structure is still dominated by coal. The average observed value of the sample energy consumption structure is 56.9%. In addition, the conception of green development proposed in China is late. Hence, for most enterprises, the energy consumption mode transitioning from traditional energy to clean energy in a short time is unbearable. Therefore, it is temporarily impossible for green credit to improve GTFP by changing the energy consumption structure on the whole.
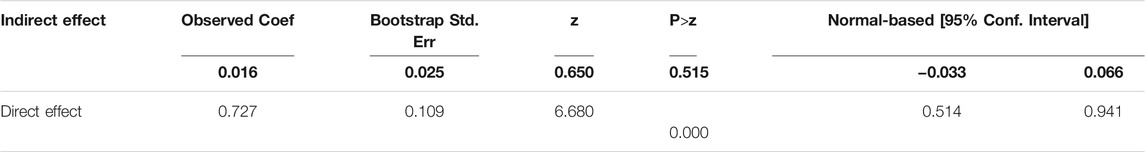
TABLE 10. Bootstrap test of the mediating effect of energy consumption structure in the impact of green credit on GTFP.
Heterogeneous Effects
Heterogeneity Analysis with Different Level of GTFP
The impact of GC on GTFP may be different with different level of GTFP. Therefore, in this part, the panel quantile regression model is selected to test the heterogeneous effect. Table 11 shows the parameter estimation results of Formula (2) based on the panel quantile regression model. Then, the regression models are estimated with quantiles of 10, 25, 50, 75, and 90%, respectively.
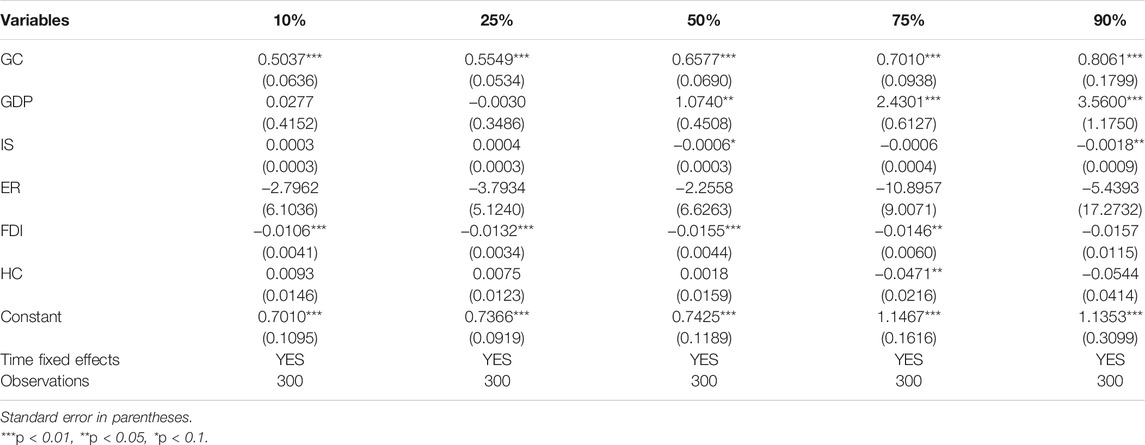
TABLE 11. Panel quantile regression results.
From Table 11, the regression coefficients of green credit are 0.5037, 0.5549, 0.6577, 0.7010, and 0.8061, respectively at the 10, 25, 50, 75, and 90% quantiles. They are all significantly positive, and increasing with the quantile. These show that the impact of green credit on GTFP is heterogeneous with different GTFP levels. As the quantile point increases from 10 to 90%, the regression coefficient of green credit increases from 0.5037 to 0.8061. This shows that the promotion of GTFP by green credit is strengthened with the increase of GTFP level. Thus, hypothesis 2 is proved. This is consistent with reality. In the context of the vigorous development of green finance in China, green credit plays a role in promoting economic development, the level of green economy development will be improved (Zheng et al., 2020), which in turn has a positive effect on the level of GTFP. When GTFP is at a low level, it indicates more undesired outputs and environmental problems are relatively serious. At this time, the positive effect of green credit on GTFP needs to neutralize some of the negative effects of undesired output. Therefore, green credit failed to play the best role. When GTFP is at a high level, the level of green economy, resource utilization efficiency, and the environment will be improved. At this time, the promotion of GTFP by green credit can be brought into full play.
Heterogeneity Analysis with Other Different Characteristics
Considering the possible heterogeneity of the impact of green credit on GTFP, this section selects other two factors of the level of economic development and the degree of environmental regulation based on the characteristics of the sample in a subsample test. According to 50% quantile of the level of economic development, the full sample is divided into two subsamples of low level of economic development and high level of economic development. Similarly, low degree of environmental regulation and a high degree of environmental regulation are also divided into two subsamples.
Table 12 reports the parameter estimation results, and the results show that the impact of green credit on GTFP is heterogeneous, which supports Hypothesis 3 and Hypothesis 4.
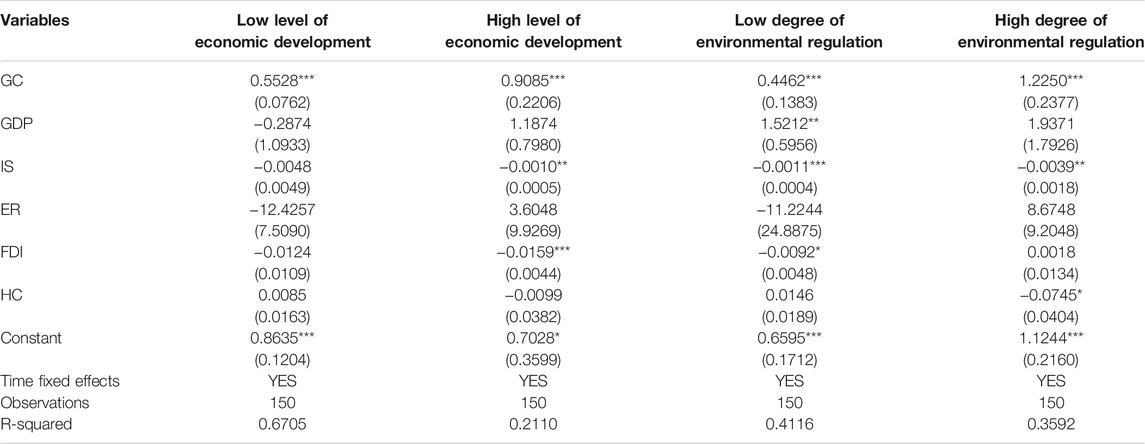
TABLE 12. Heterogeneity test based on different characteristics.
In the group regression of different economic development levels, the regression coefficients of green credit in areas with low and high levels are 0.5528 and 0.9085, and both have passed the 1% significance level test. At the same time, it also can be found that the promotion effect of green credit on GTFP is greater in areas with high economic development levels, and even exceeds the promotion effect in the full sample. Thus, regions with different levels of economic development, the impact of green credit on GTFP is heterogeneous. Based on the analysis of Figure 2B, although the GTFP level and green credit level in areas with low level of economic development are higher than those areas with high levels of economic development, areas with high levels of economic development have a solid economic foundation and greater market space. In areas with a high level of economic development, the introduction of green credit and the original funding base can better provide support for green projects, thereby promoting the further improvement of the level of GTFP.
In the group regression of different levels of environmental regulation, the regression coefficients of green credit in areas with low and high levels of environmental regulation are both have passed the 1% significance level test. At the same time, it can be found that the promotion effect of green credit on GTFP is greater in regions with higher levels of environmental regulation, about 1.5 times than that of the full sample. Therefore, in regions with different levels of environmental regulation, the impact of green credit on GTFP is heterogeneous. Combined with Figure 2C, the GTFP levels and green credit levels of regions with high environmental regulation are higher when comparing with regions with low levels of environmental regulation. Regions with a high degree of environmental regulation have a strong awareness of energy conservation and emission reduction (Hong et al., 2020), which in turn improves environmental governance performance, promotes the improvement of GTFP level and further improves the level of green economy development. Therefore, the commercial banking industry is also more willing to issue green credits to areas with a higher degree of environmental regulation for the development of green projects, thereby, it promotes the improvement of the GTFP level in the region.
Discussion
Deviation Degree of Different Subsamples from the Full Sample
Based on section 4.2, we further discuss the degree of deviation of different subsamples from the full sample. To analyze combining the full-sample regression results in Table 6, the regression coefficient of green credit is 0.8482. Based on this coefficient, the degree of deviation of different subsamples from the full sample can be calculated. From the perspective of regions with different levels of economic development, the impact of green credit on GTFP in areas with low economic development levels deviates downward by 34.83%, whereas the impact of green credit on GTFP in areas with high economic development levels deviates upward by 7.11%, which indicating that green credit has an impact on GTFP, and the role of promotion in areas with high levels of economic development is stronger. From the perspective of regions with different environmental regulations, the impact of green credit on GTFP in low-environmentally regulated areas deviates downward by 47.39%, and the impact of green credit on GTFP in high-environmentally regulated areas deviates upward by 44.42%, which indicating the promotion of green credit on GTFP. It shows that the promotion effect of green credit on GTFP is stronger in areas with high environmental regulation. Considering the characteristics of the samples, comparing geographical location, economic development level, and different impacts caused by environmental regulations, it is found that the degree of deviation caused by environmental regulations is greater, indicating that the heterogeneity of the impact of green credit on GTFP is mainly manifested in different levels of environmental regulation.
Heterogeneous Mediating Effect Tests Under Different Samples
Due to the differences in economic development level and environmental regulation, the impact mechanism of green credit on GTFP may be heterogeneous. Therefore, further research of the heterogeneity of influencing mechanism of green credit on GTFP is conducted.
Table 13 reports the test results of mediating effect in different regions with different economic development levels. It can be seen from Table 13 that the impact mechanism of green credit on GTFP has heterogeneity for regions with different levels of economic development. For low economic development level areas, the mediating effects of green technology innovation and energy consumption structure are significant. For high economic development level area, the mediating effects of green technology innovation is significant, but energy consumption structure is not significant. The reason is that the R&D investment in low-level economic development areas is relatively insufficient, which consumes more traditional energy. Green credit is conducive to increasing R&D investment and improving the energy consumption structure, which has a further impact on GTFP. For the regions with high economic development level, they have a strong economic foundation, high development level, advanced R&D and innovation technology, and low dependence on traditional energy. Therefore, the effect of green credit on GTFP through energy consumption structure is not significant.
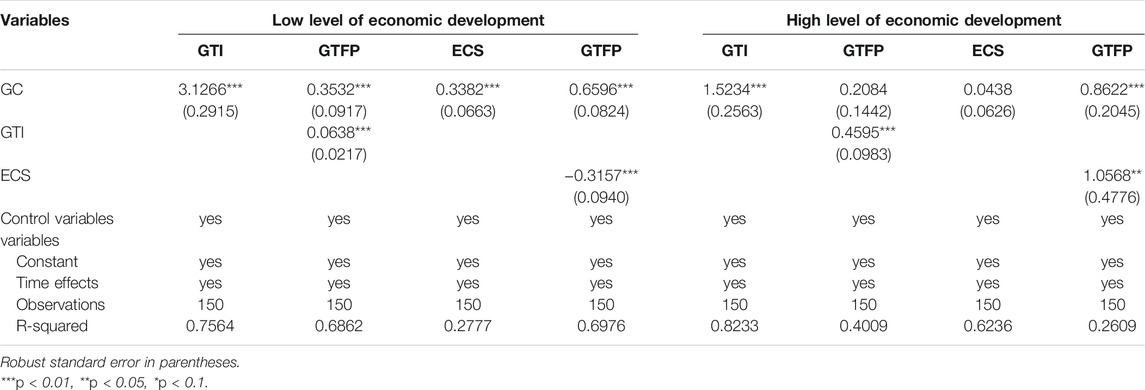
TABLE 13. Test of mediating effect based on different levels of economic development.
Table 14 reports the test results of mediating effect in regions with different levels of environmental regulation. It can be seen from Table 14 that the impact mechanism of green credit on GTFP is heterogeneous in regions with different levels of environmental regulation. For regions with a low level of environmental regulation, the mediating effect of green technology innovation is not significant, but that of energy consumption structure is significant. While for regions with a high level of environmental regulation, it’s the other way around.

TABLE 14. Test of mediating effect based on different levels of environmental regulation.
Conclusion
This paper examines the total effects, influence mechanism, and heterogeneous impacts of green credit on GTFP based on GTFP data of 30 provinces in China from 2008 to 2017. It mainly draws the following conclusions.
First, green credit has a positive effect on GTFP. Specifically, with the gradual improvement of the GTFP level, the promotion effect of green credit on GTFP is also strengthened. As the quantile point increases from 10 to 90%, the regression coefficient of green credit on GTFP increases from 0.5037 to 0.8061.
Second, heterogeneity exists in the effect of green credit on GTFP, which is reflected in different level of economic development, especially for different degrees of environmental regulation. To be specific, the promotion effect of green credit on GTFP in high economic development level areas is significantly greater than that in low economic development areas; whereas the promotion effect of green credit on GTFP in a high degree of environmental regulation areas is far greater than that in a low degree of environmental regulation areas. Moreover, the heterogeneity deviation caused by the degree of environmental regulation is the largest when it is more than 40%. Therefore, the heterogeneity of the impact of green credit on GTFP is mainly reflected in different degrees of environmental regulation.
Thirdly, on the whole, green credit can impact GTFP through green technology innovation, but not through energy consumption structure, and the influence mechanism is heterogeneous in the variation of sample characteristics. From the perspective of different economic development level, green technology innovation plays a significant mediator role in the impact of green credit on GTFP in both areas with low and high levels of economic development. However, the mediating effect of energy consumption structure is only significant in low level economic development areas. From the perspective of the different environmental regulation degree, the mediating effect of green technology innovation is only significant for the regions with a high environmental regulation degree. In contrast, energy consumption structure only plays a significant mediator role in the impact of green credit on GTFP in areas with low degree of environmental regulation.
Based on the above conclusion, the following enlightenment is drawn. First of all, perfecting the green credit policy (with which the benefit of relieving financial stress (Liu et al., 2021) and enhancing the promotion effect of green credit on GTFP through the establishment of high energy consumption industry credit constraint mechanism (Wen et al., 2021c) and green industry credit incentive mechanism. Secondly, green credit should be adjusted dynamically according to the change of GTFP level, and implement differentiation strategy with different GTFP levels, so as to give full play to the importance of green credit in the process of green economic growth. Finally, considering the regional heterogeneity for the green credit policy, such as enlightenments from researches on credit among assets types (Cao et al., 2021), investor sentiment (Wen et al., 2021d), portfolio diversification (Xiao et al., 2021), which guiding the credit funds flow to the green environmental protection industry according to the regional characteristics, and giving full play to the maximum effect of green credit on the growth of GTFP.
Besides, this paper also has the following limitations: first, the measurement method of core explanatory variables is unitary, and green credit can be measured via calculating the proportion of green credit line in the total loan line of financial institutions. Second, the mediating effect of green credit on GTFP takes fewer variables into account, and the channels of green credit on GTFP are rich. We can also explore the mediating effect of industrial structure upgrading. The above aspects should be considered in the directions to be explored in the future research.
Data Availability Statement
The original contributions presented in the study are included in the article/Supplementary Material, further inquiries can be directed to the corresponding authors.
Author Contributions
Conceptualization, QH and YF; Data curation, QH and XL; Formal analysis, QH and YF; Investigation, QH and XL; Methodology, YF and XL; Resources, YF; Software, QH and XL; Supervision, QH and YF; Validation, QH, YF, and XL; Writing—original draft, QH, XL, and YF; Writing—review and editing, QH, XL, and YF.
Funding
This research was funded by the Education Special Project of National Social Science Fund of China (grant number BIA180197). This research was also funded by the Horizontal Project of Zhongda Health Limited Company in Hunan Province (grant number: HYW-2019-003). This funder had no role in this study design, data collection and analysis, decision to publish, or preparation of the manuscript.
Conflict of Interest
The authors declare that the research was conducted in the absence of any commercial or financial relationships that could be construed as a potential conflict of interest.
Publisher’s Note
All claims expressed in this article are solely those of the authors and do not necessarily represent those of their affiliated organizations, or those of the publisher, the editors and the reviewers. Any product that may be evaluated in this article, or claim that may be made by its manufacturer, is not guaranteed or endorsed by the publisher.
Acknowledgments
We are grateful for the support of Hunan Institute of Technology and Guangzhou University. We also appreciate all participants who contributed to the data collection and analysis in this study. We would like to thank reviewers for helpful comments.
References
Canay, I. A. (2011). A Simple Approach to Quantile Regression for Panel Data. Econom. J. 14, 368–386. doi:10.1111/j.1368-423X.2011.00349.x
Cao, J., Wen, F., Stanley, H. E., and Wang, X. (2021). Multilayer Financial Networks and Systemic Importance: Evidence from China. Int. Rev. Financial Anal. 78, 101882. doi:10.1016/j.irfa.2021.101882
Carroll, J., Newman, C., and Thorne, F. (2011). A Comparison of Stochastic Frontier Approaches for Estimating Technical Inefficiency and Total Factor Productivity. Appl. Econ. 43, 4007–4019. doi:10.1080/00036841003761918
Chen, S., Wang, Y., Albitar, K., and Huang, Z. (2021). Does Ownership Concentration Affect Corporate Environmental Responsibility Engagement? The Mediating Role of Corporate Leverage. Borsa Istanbul Rev. 21, S13–S24. doi:10.1016/j.bir.2021.02.001
Dickey, D. A., and Fuller, W. A. (1981). Likelihood Ratio Statistics for Autoregressive Time Series with a Unit Root. Econometrica 49, 1057–1072. doi:10.2307/1912517
Dogan, E., and Seker, F. (2016). The Influence of Real Output, Renewable and Non-renewable Energy, Trade and Financial Development on Carbon Emissions in the Top Renewable Energy Countries. Renew. Sust. Energ. Rev. 60, 1074–1085. doi:10.1016/j.rser.2016.02.006
Demirtaş, Y. E., Kececi, N. F., and Fidan Keçeci, N. (2020). The Efficiency of Private Pension Companies Using Dynamic Data Envelopment Analysis. Quantitative Finance Econ. 4, 204–219. doi:10.3934/qfe.2020009
Feng, Y., Chen, S., and Failler, P. (2020). Productivity Effect Evaluation on Market-type Environmental Regulation: A Case Study of SO2 Emission Trading Pilot in China. Ijerph 17, 8027. doi:10.3390/ijerph17218027
Fukuyama, H., and Weber, W. L. (2009). A Directional Slacks-Based Measure of Technical Inefficiency. Socio-Economic Plann. Sci. 43, 274–287. doi:10.1016/j.seps.2008.12.001
Guo, Q., Zhou, M., Liu, N., and Wang, Y. (2019). Spatial Effects of Environmental Regulation and Green Credits on Green Technology Innovation Under Low-Carbon Economy Background Conditions. Ijerph 16, 3027. doi:10.3390/ijerph16173027
He, L., Zhang, L., Zhong, Z., Wang, D., and Wang, F. (2019). Green Credit, Renewable Energy Investment and Green Economy Development: Empirical Analysis Based on 150 Listed Companies of China. J. Clean. Prod. 208, 363–372. doi:10.1016/j.jclepro.2018.10.119
Hong, M., Drakeford, B., Drakeford, B., and Zhang, K. (2020). The Impact of Mandatory CSR Disclosure on Green Innovation: Evidence from China. Green. Finance 2, 302–322. doi:10.3934/gf.2020017
Hou, Y., Li, S., and Wen, F. (2021). Time-varying Information Share and Autoregressive Loading Factors: Evidence from S&P 500 Cash and E-Mini Futures Markets. Rev. Quant Finan Acc. 57, 91–110. doi:10.1007/s11156-020-00940-7
Hu, M. Z., Li, W., and Zhang, B. (2011). “Analysis of China's Green Credit Policy Towards Green Economic Growth,” in 2011 Asia-Pacific Power and Energy Engineering Conference, Wuhan, China, March 25–28, 2011.
Huang, C., Wen, S., Li, M., Wen, F., and Yang, X. (2021). An Empirical Evaluation of the Influential Nodes for Stock Market Network: Chinese A-Shares Case. Finance Res. Lett. 38, 101517. doi:10.1016/j.frl.2020.101517
Jeucken, M. (2001). Sustainable Finance and Banking: The Financial Sector and the Future of the Planet. London: Earthscan Publications Ltd.
Kong, Q., Shen, C., Li, R., and Wong, Z. (2021). High-speed Railway Opening and Urban Green Productivity in the Post-COVID-19: Evidence from Green Finance. Glob. Finance J. 49, 100645. doi:10.1016/j.gfj.2021.100645
Levin, A., Lin, C.-F., and James Chu, C.-S. (2002). Unit Root Tests in Panel Data: Asymptotic and Finite-Sample Properties. J. Econom. 108, 1–24. doi:10.1016/s0304-4076(01)00098-7
Li, B., and Wu, S. (2017). Effects of Local and Civil Environmental Regulation on Green Total Factor Productivity in China: A Spatial Durbin Econometric Analysis. J. Clean. Prod. 153, 342–353. doi:10.1016/j.jclepro.2016.10.042
Li, T., Li, X., and Li, X. (2020). Does Structural Deceleration Happen in China? Evidence from the Effect of Industrial Structure on Economic Growth Quality. Natl. Account. Rev. 2, 155–173. doi:10.3934/nar.2020009
Li, T., Li, X., and Liao, G. (2021). Business Cycles and Energy Intensity. Evidence from Emerging Economies. Borsa Istanbul Rev. [Epub ahead of print]. doi:10.1016/j.bir.2021.07.005
Li, T., and Liao, G. (2020). The Heterogeneous Impact of Financial Development on Green Total Factor Productivity. Front. Energ. Res. 8, 29. doi:10.3389/fenrg.2020.00029
Li, X., Xu, C., Cheng, B., Duan, J., and Li, Y. (2021). Does Environmental Regulation Improve the Green Total Factor Productivity of Chinese Cities? A Threshold Effect Analysis Based on the Economic Development Level. Ijerph 18, 4828. doi:10.3390/ijerph18094828
Li, Z., Ao, Z., and Mo, B. (2021). Revisiting the Valuable Roles of Global Financial Assets for International Stock Markets: Quantile Coherence and Causality-In-Quantiles Approaches. Mathematics 9, 1750. doi:10.3390/math9151750
Li, Z., Liao, G., Wang, Z., and Huang, Z. (2018). Green Loan and Subsidy for Promoting Clean Production Innovation. J. Clean. Prod. 187, 421–431. doi:10.1016/j.jclepro.2018.03.066
Li, Z., Tian, M., Ouyang, G., and Wen, F. (2020). Relationship Between Investor Sentiment and Earnings News in High‐ and Low‐sentiment Periods. Int. J. Fin Econ. 26, 2748–2765. doi:10.1002/ijfe.1931
Liang, Z., Chiu, Y.-h., Li, X., Guo, Q., and Yun, Y. (2020). Study on the Effect of Environmental Regulation on the Green Total Factor Productivity of Logistics Industry from the Perspective of Low Carbon. Sustainability 12, 175. doi:10.3390/su12010175
Lin, B., and Chen, Z. (2018). Does Factor Market Distortion Inhibit the Green Total Factor Productivity in China? J. Clean. Prod. 197, 25–33. doi:10.1016/j.jclepro.2018.06.094
Liu, J., Zhang, Z., Yan, L., and Wen, F. (2021). Forecasting the Volatility of EUA Futures with Economic Policy Uncertainty Using the GARCH-MIDAS Model. Financ. Innov. 7, 76. doi:10.1186/s40854-021-00292-8
Liu, N., Liu, C., Xia, Y., Ren, Y., and Liang, J. (2020). Examining the Coordination Between Green Finance and Green Economy Aiming for Sustainable Development: A Case Study of China. Sustainability 12, 3717. doi:10.3390/su12093717
Matei, I. (2020). Is Financial Development Good for Economic Growth? Empirical Insights from Emerging European Countries. Quantitative Finance Econ. 4, 653–678. doi:10.3934/QFE.2020030
Meirun, T., Mihardjo, L. W., Haseeb, M., Khan, S. A. R., and Jermsittiparsert, K. (2021). The Dynamics Effect of Green Technology Innovation on Economic Growth and CO2 Emission in Singapore: New Evidence from Bootstrap ARDL Approach. Environ. Sci. Pollut. Res. 28, 4184–4194. doi:10.1007/s11356-020-10760-w
Ming, Z., Ximei, L., Yulong, L., and Lilin, P. (2014). Review of Renewable Energy Investment and Financing in China: Status, Mode, Issues and Countermeasures. Renew. Sust. Energ. Rev. 31, 23–37. doi:10.1016/j.rser.2013.11.026
Mohtadi, H. (1996). Environment, Growth, and Optimal Policy Design. J. Public Econ. 63, 119–140. doi:10.1016/0047-2727(95)01562-0
Oh, D.-h. (2010). A Global Malmquist-Luenberger Productivity Index. J. Prod. Anal. 34, 183–197. doi:10.1007/s11123-010-0178-y
Scholtens, B. (2006). Finance as a Driver of Corporate Social Responsibility. J. Bus Ethics 68, 19–33. doi:10.1007/s10551-006-9037-1
Shi, X., and Li, L. (2019). Green Total Factor Productivity and its Decomposition of Chinese Manufacturing Based on the MML index:2003-2015. J. Clean. Prod. 222, 998–1008. doi:10.1016/j.jclepro.2019.03.080
Song, M., Du, J., and Tan, K. H. (2018). Impact of Fiscal Decentralization on Green Total Factor Productivity. Int. J. Prod. Econ. 205, 359–367. doi:10.1016/j.ijpe.2018.09.019
Soundarrajan, P., and Vivek, N. (2016). Green Finance for Sustainable Green Economic Growth in India. Agric. Econ. - Czech 62, 35–44. doi:10.17221/174/2014-agricecon
Tuzcuoğlu, T. (2020). The Impact of Financial Fragility on Firm Performance: An Analysis of BIST Companies. Quantitative Finance Econ. 4, 310–342. doi:10.3934/qfe.2020015
Wang, M., Pang, S., Hmani, I., Hmani, I., Li, C., and He, Z. (2021). Towards Sustainable Development: How Does Technological Innovation Drive the Increase in Green Total Factor Productivity? Sust. Dev. 29, 217–227. doi:10.1002/sd.2142
Wen, F., Cao, J., Liu, Z., and Wang, X. (2021). Dynamic Volatility Spillovers and Investment Strategies Between the Chinese Stock Market and Commodity Markets. Int. Rev. Financial Anal. 76, 101772. doi:10.1016/j.irfa.2021.101772
Wen, F., Li, C., Sha, H., and Shao, L. (2021). How Does Economic Policy Uncertainty Affect Corporate Risk-Taking? Evidence from China. Finance Res. Lett. 41, 101840. doi:10.1016/j.frl.2020.101840
Wen, F., Zhang, K., and Gong, X. (2021). The Effects of Oil price Shocks on Inflation in the G7 Countries. North Am. J. Econ. Finance 57, 101391. doi:10.1016/j.najef.2021.101391
Wen, F., Zou, Q., and Wang, X. (2021). The Contrarian Strategy of Institutional Investors in Chinese Stock Market. Finance Res. Lett. 41, 101845. doi:10.1016/j.frl.2020.101845
Wen, Z., and Ye, B. (2014). Analyses of Mediating Effects: The Development of Methods and Models. Adv. Psychol. Sci. 22, 731–745. doi:10.3724/SP.J.1042.2014.00731
Xiao, J., Wen, F., Zhao, Y., and Wang, X. (2021). The Role of US Implied Volatility index in Forecasting Chinese Stock Market Volatility: Evidence from HAR Models. Int. Rev. Econ. Finance 74, 311–333. doi:10.1016/j.iref.2021.03.010
Xu, S. (2020). International Comparison of Green Credit and its Enlightenment to China. Green. Finance 2, 75–99. doi:10.3934/gf.2020005
Yu, D., Li, X., Yu, J., and Li, H. (2021). The Impact of the Spatial Agglomeration of Foreign Direct Investment on green Total Factor Productivity of Chinese Cities. J. Environ. Manage. 290, 112666. doi:10.1016/j.jenvman.2021.112666
Yuan, B., Li, C., and Xiong, X. (2021). Innovation and Environmental Total Factor Productivity in China: The Moderating Roles of Economic Policy Uncertainty and Marketization Process. Environ. Sci. Pollut. Res. 28, 9558–9581. doi:10.1007/s11356-020-11426-3
Zhang, B., Yang, Y., and Bi, J. (2011). Tracking the Implementation of Green Credit Policy in China: Top-Down Perspective and Bottom-Up Reform. J. Environ. Manage. 92, 1321–1327. doi:10.1016/j.jenvman.2010.12.019
Zhang, J., Fang, H., Peng, B., Wang, X., and Fang, S. (2016). Productivity Growth-Accounting for Undesirable Outputs and its Influencing Factors: The Case of China. Sustainability 8, 1166. doi:10.3390/su8111166
Zheng, Y., Chen, S., Chen, S., and Wang, N. (2020). Does Financial Agglomeration Enhance Regional Green Economy Development? Evidence from China. Green. Finance 2, 173–196. doi:10.3934/gf.2020010
Zheng, Y., Zhou, M., and Wen, F. (2021). Asymmetric Effects of Oil Shocks on Carbon Allowance price: Evidence from China. Energ. Econ. 97, 105183. doi:10.1016/j.eneco.2021.105183
Zhou, X., Tang, X., and Zhang, R. (2020). Impact of Green Finance on Economic Development and Environmental Quality: A Study Based on Provincial Panel Data from China. Environ. Sci. Pollut. Res. 27, 19915–19932. doi:10.1007/s11356-020-08383-2
Keywords: green credit, green total factor productivity, heterogeneous effects, mediating effects, green technology innovation
Citation: Hu Q, Li X and Feng Y (2022) Do Green Credit Affect Green Total Factor Productivity? Empirical Evidence from China. Front. Energy Res. 9:821242. doi: 10.3389/fenrg.2021.821242
Received: 24 November 2021; Accepted: 20 December 2021;
Published: 02 February 2022.
Edited by:
Xiaohang Ren, Central South University, ChinaReviewed by:
Yan Zheng, Central South University, ChinaZhifeng Liu, Hainan University, China
Jie Chen, Yangzhou University, China
Copyright © 2022 Hu, Li and Feng. This is an open-access article distributed under the terms of the Creative Commons Attribution License (CC BY). The use, distribution or reproduction in other forums is permitted, provided the original author(s) and the copyright owner(s) are credited and that the original publication in this journal is cited, in accordance with accepted academic practice. No use, distribution or reproduction is permitted which does not comply with these terms.
*Correspondence: Yanhong Feng, MTExMTg2NDAwOEBlLmd6aHUuZWR1LmNu