- College of Energy and Power Engineering, Lanzhou University of Technology, Lanzhou, China
According to the structural characteristics of a steam generator and a reactor pressure vessel, the reactor primary circuit system of HPR1000 is simplified to make the reactor coolant pump (RCP) characteristics match the resistance characteristics of the system pipeline, so a simplified model of reactor primary circuit closed system is formed. On this basis, the RCP shutdown accident in a single circuit of the reactor is numerically simulated. Results show that the pressure in the pipeline system has changed greatly compared. The flow rate drops rapidly and decreases to 1.7% of stable operation at 10s. The torque drops sharply to −51.89% of stable operation, and then rises slowly to zero. The pressure at the inlet and outlet of the impeller changes dramatically which leads to the change of blade load and the velocity in the impeller passage decreases gradually. The pressure and velocity in the guide vane continue to decrease.
Introduction
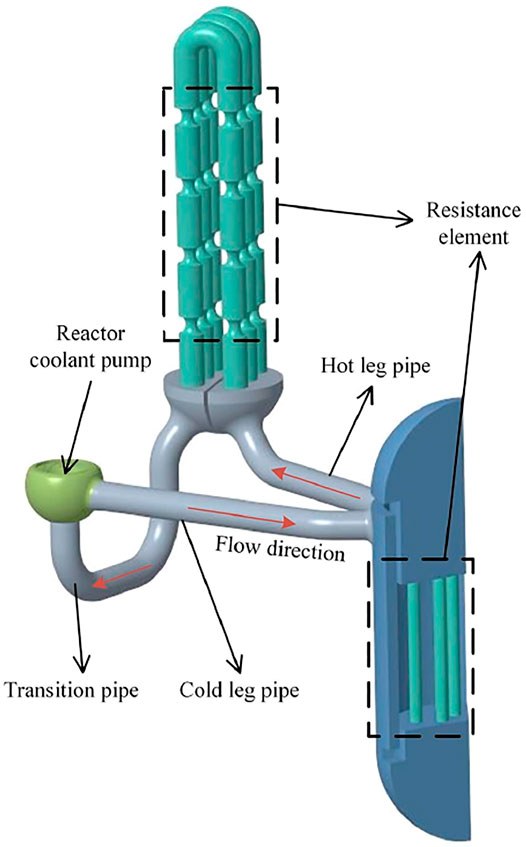
Nuclear power is a kind of efficient environmental protection energy, HPR1000 is China’s independent third generation nuclear power technology (Long et al., 2020), and the reactor primary system is mainly a closed energy generation and exchange system composed of reactor pressure vessel, RCP, pressurizer, steam generator, and pipeline. It is the most basic core part of all reactor systems. Figure 1 is a schematic diagram of the primary circuit of the reactor. Safe and stable operation is the most important for nuclear power plants, so it is of great significance to study the transient process of emergency shutdown of reactor primary circuit closed system. Many scholars have done a lot of research on different transient processes of pumps. Kim et al. (2014) analyzed the transient characteristics of pump-rising pipeline system with an air chamber using the method of characteristics. Wang et al., (2020) studied the transient characteristic of RCP under the condition of the rotor seizure accident by experiment. Fu et al. (2020) conducted experimental and numerical studies of the transient characteristics during the start-up process of the axial flow pump. Lu et al. (2019) used different models of RCP to carry out transient performance test research of RCP during shutdown coasting transition. Zhong (2018) built the transient test system of RCP shaft sticking accident, and calculated the transient flow of RCP shaft sticking accident by bidirectional fluid structure coupling. Gao et al. (2013) and Su et al. (2017) studied the RCP transient performance in primary coolant system during the start-up period and mathematically solved and elucidated the RCP start-up mechanism. Tang et al. (2021) carried out transient three-dimensional numerical simulation of CEFR primary circuit pump shaft sticking accident, and obtained three-dimensional thermal hydraulic characteristics of key structures and components during shaft sticking accident. Liu et al. (2009) has carried out experimental research on the transient hydraulic characteristics of the RCP during the shutdown and idling process, and found that the instantaneous flow and rotation speed of power failure rapidly decreased, the vibration of bearing seat suddenly increases at the moment of power failure. Wu et al. (2010) reported the transient flow of the RCP in the transient process of rapid valve opening. Azzoune et al. (2019) took the main pump of AP1000 reactor as the research object, studied the transient transition process under the condition of a stuck rotor, and carried out two-way fluid structure coupling calculation. Sabotinov and Srivastava (2010) simulated and analyzed the large break loss of coolant accident of VVER-1000 reactor. A large number of researchers have also calculated and analyzed the influence of some transient processes of pump shutdown on the system in multi-pump system (Farhadi, 2010; Liu et al., 2021). In the study of pump shutdown transition process, most numerical calculations need to give boundary conditions, but in this paper, the reactor primary circuit closed system model of the RCP is adopted, so the boundary conditions of the RCP inlet and outlet cannot be given, and the transient process of the RCP shutdown can be simulated more accurately.
Model Simplification
The primary circuit system of HPR1000 includes three circuits. It is assumed that the circuit in the reactor three circuits are independent of each other and do not affect each other, and the probability that the RCP rotor accident occurs in the reactor three circuit systems is extremely low, so it is assumed when a pump shutdown accident occurs in a single circuit of the reactor, the other two circuits are in normal operating conditions at this time, which can simplify the reactor’s three circuits power system to a single circuit power system. If the pipeline performance curve is superimposed with curve of the pump performance, the meeting point will be the operating point of the pump for that system. The pipe resistance can be controlled by regulating the pipe diameter of the resistance element. The local resistance loss formula is as follows and changing the diameter of the resistance element can change the resistance.
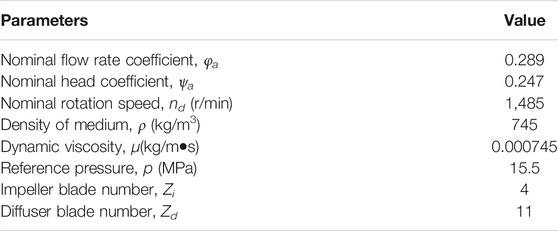
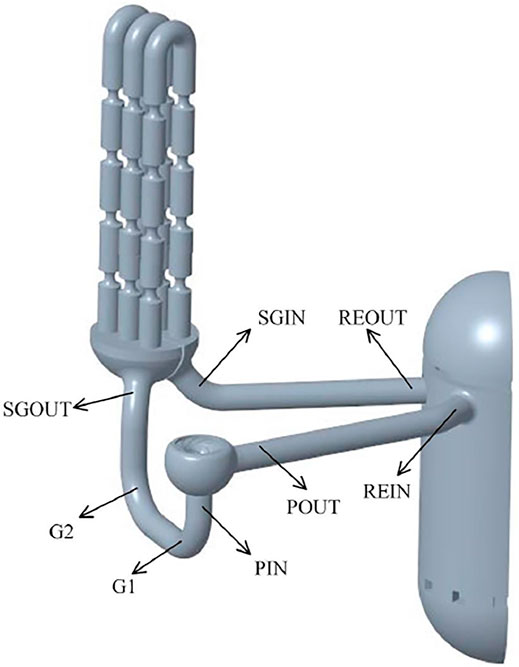
Due to the complicated internal structure of the steam generator and the reactor pressure vessel, the steam generator in the reactor single circuit system needs to be simplified in structure. Use CREO software to model the water body of the RCP suction section, impeller, guide vane, and pressurized water chamber (Li et al., 2020), the rated parameters of the main pump are shown in Table 1. According to the structural characteristics of large number of heat transfer tubes, small diameter, and thin tube wall in the ZH-65 steam generator (He et al., 2021) of HPR1000. Therefore, it is difficult to carry out numerical simulation for all heat transfer tubes, so the heat transfer tubes can only be simplified. Based on the equal flow cross-section method for heat transfer tubes, the equal area of heat transfer tubes is further simplified to three inverted U-bends. Similarly, the cold leg pipe, heat leg pipe, transition pipe, and reactor pressure vessel of single circuit reactor are simplified, and resistance characteristic elements are added into the simplified structure of inverted U-bend and reactor pressure vessel. By adjusting the resistance values of each part and comparing with the theoretical resistance values, it shows that the simplification is reasonable as shown in Figure 1.
Condition Matching of Reactor Primary Circuit System
According to the principle of determining the operating point of the closed pump system, the resistance performance curve of the reactor primary circuit pipeline can only be adjusted by controlling the flow radius of the resistance element, so that the reactor single circuit system can operate at the rated operating condition. By adjusting and controlling the resistance characteristics of the heat transfer tube and the reactor pressure vessel, the resistance characteristics of the simplified three inverted U-bends are in line with the resistance characteristics of the original heat transfer tube, and the resistance characteristics of the reactor pressure vessel are in line with the actual situation.
Mesh Generation
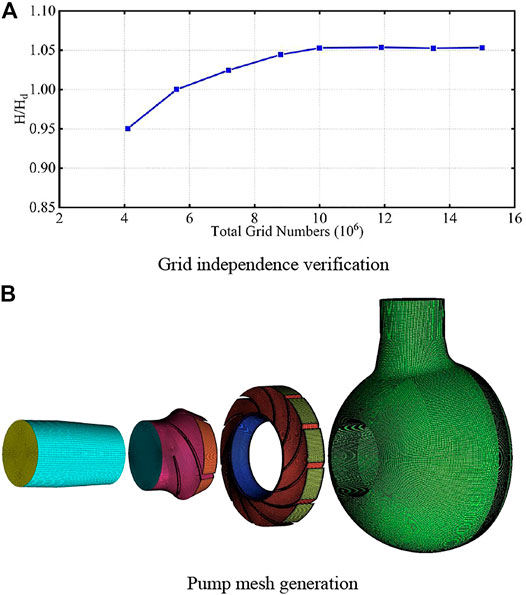
Use ANSYS ICEM software to divide the water body of the pump with high-quality hexahedral meshes and encrypt the wall meshes. The distance between the first layer of mesh and the wall is 0.3–0.4 mm to meet the requirements of the turbulence model y+ = 30–300. In order to ensure the reliability of numerical calculation and reduce the cost of the calculation, the grid independence test is performed with the head of the RCP as a verification index. When the number of grids reached 8.8 million, the head of the RCP stabilized. Therefore, the total number of grids of each flow-through component reaches 9.0305 million to meet the requirements. Among them, the number of grid units of the impeller is 2.7978 million, the guide vane is 2.5503 million, the pressurized water chamber is 2.896 million, and the suction section is 786,400. The grid of each part of the pump is shown in Figure 2. Tetrahedral grids with good adaptability are used in the pipeline system, and the total number of pipeline grids is 24.3372 million. The total grid number of the whole system is about 33 million.
Experimental Verification of Calculation Model and Condition Adjustment
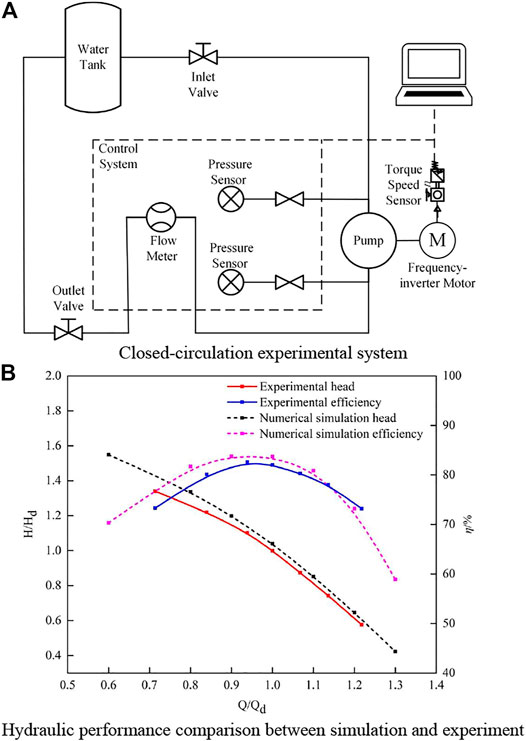
The reliability of the numerical calculation is verified by the external characteristic experiment of the RCP. Test the change of RCP head and efficiency under different flow conditions, draw the external characteristic curve. The hydraulic performance test device included the console, motor, closed water tank, pump, control system, and valves, as shown in Figure 3A. The comparison between the experimental results and the steady-state calculation results is shown in Figure 3B. The curve of numerical calculation results and the curve of experimental results have the same change trend, and the consistency of each point is high under the full condition. At rated flow, the error between the calculated head of RCP and the experimental value is 4.0% and the error between the calculated efficiency of RCP and the experimental value is 1.73%, the maximum error is less than 5%. The calculation model of the RCP meets the requirements of the engineering calculation.
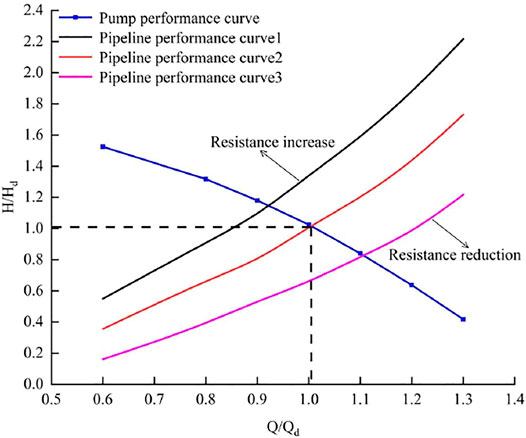
If the pipeline performance curve is superimposed with the curve of the pump performance, the meeting point will be the operating point of the pump for that system. The pipe resistance can be controlled by regulating the pipe diameter of the resistance element. The local resistance loss formula is as follows and changing the diameter of the resistance element can change the resistance.
In this formula, ΔP is the pressure drop, K is the resistance coefficient, A is the cross-sectional area of the pipeline, and Q is fluid volume flow rate.
As shown in Figure 4, if the resistance is too small, the position of the pipeline performance curve 1 deviates from the rated operating point of the pump. Currently, it is necessary to reduce the pipe diameter. If the resistance is too large, it will reach the position of pipeline performance curve 2. Currently, it is necessary to increase the pipe diameter. After several adjustments, the pipeline performance curve 3 is finally obtained. Currently, the error of the steam generator resistance is 3.3%, the error of the reactor pressure vessel resistance is 2.9%, the error between the pump flow of the closed system and that of the rated condition is 0.998%, the error between the pump head of the closed system and that of the rated condition is 3.76%. The error of the two methods is small, which meets the requirements of overall simplification.
Numerical Simulation of Transition Process
For the transient process of pump stop, according to the above parameters, the commercial ANSYS-CFX software platform was used to calculate, and the RNG κ-ε turbulence model was selected to consider the influence of curved wall on the flow as much as possible. The near wall area is treated by the standard wall function. The pressure and velocity are coupled by SIMPLEC algorithm. The second-order central difference scheme is used to discretize the diffusion term, the second-order upwind scheme is used to discretize the diffusion term, and the second-order discrete scheme is used to discretize the governing equations, which can reduce the influence of truncation error and improve the calculation accuracy. The time step of transient calculation is 1.122 × 10⁻⁴s, the starting time of shutdown is 0.404 s (the pump rotates for 10 turns). Refer to the experimental data of literature (Zhong, 2018), and the pump stop time is selected as 0.6 s. Since the primary circuit system of RCP is a closed system, the transition process of stopping the pump can be realized only by changing the speed of the pump. The function of the pump speed n changing with time is shown below, the unit is r/min, and the transient calculation lasts for a total of 10 s.
In this formula, n is rotation speed, t is time.
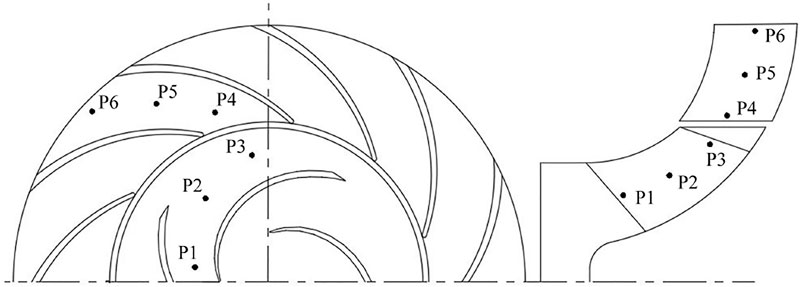
Eight monitoring points: PIN, REIN, REOUT, SGIN, SGOUT, G1, G2, and POUT located in the middle of the pipeline section as shown in Figure 5 are arranged in the primary circuit pipeline system of the pump to monitor the change of instantaneous pressure with time in the pipeline system during the shutdown transition of the pump. In the impeller passage of the pump, 6 monitoring points are arranged along the direction of fluid flow as shown in Figure 6 which are P1, P2, and P3 in the impeller passage, and 3 monitoring points in the guide vane passage are P4, P5, and P6, respectively, to monitor the instantaneous changes of pressure and velocity in the pump.
Numerical Simulation of Transition Process
Pressure Change in Piping System
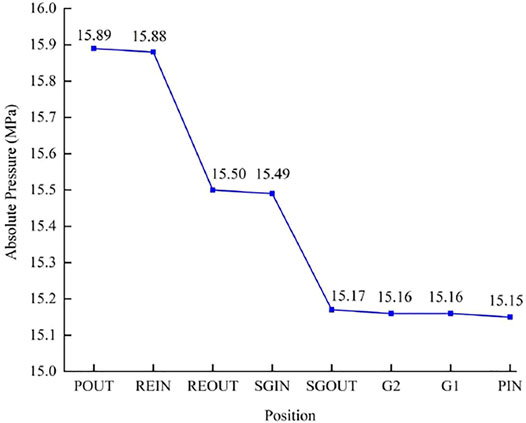
Figure 7 shows the average transient absolute pressure value at each position of the reactor primary circuit when the RCP operates normally. The calculation results show that the pressure distribution in the whole closed primary system is not uniform under the stable operation of the reactor primary system. Because of pipeline resistance, the pressure in all parts of the system decreases from the outlet of RCP along the direction of transition pipe, reactor pressure vessel, hot leg pipe, steam generator, cold leg pipe, and RCP inlet.
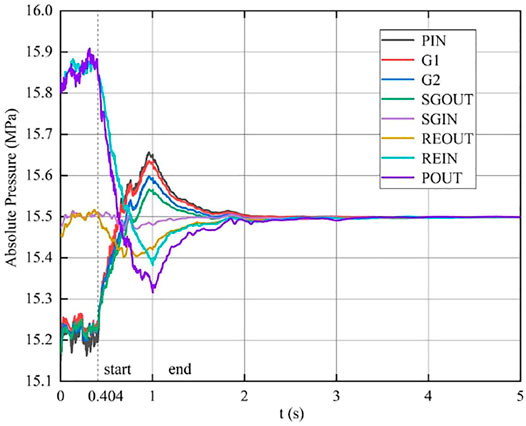
Figure 8 is the absolute pressure change diagram of each monitoring point in the pipeline system during the pump shutdown transition process. After the start of the pump shutdown transition process, due to the rapid stop of the impeller hindering the fluid flow, the fluid in the pipeline system generates pressure wave due to inertia, and strong oscillation occurs in the pipeline system. The pressure wave is transmitted along the direction of the transition pipe, steam generator, and hot leg pipe, and the peak point of the transient pressure wave gradually presents a downward trend. The maximum peak pressure is located at the PIN monitoring point at the inlet pipeline of the pump, and the value is 15.65 MPa at the end of pump shutdown. The minimum value is located at the POUT monitoring point at the outlet section, and the time is also at the end of the pump stop, and the value is 15.31 MPa.
The pressure values at the monitoring points of PIN, G1, G2, and SGOUT all rose rapidly to the end of the clamping shaft and reached the peak value, and then decreased slowly. They were close to stable around 2 s and finally reached the reference pressure of 15.5 MPa. In addition, due to the dissipation effect of pressure wave propagation in the pipeline, the closer to the pump inlet, the greater the peak value, and the smaller the peak value away from the pump inlet. The pressure values at SGIN, REOUT, REIN, and POUT monitoring points all rapidly decrease to the end of pump shutdown and reach the minimum value, then slowly rise. The closer to the pump outlet, the greater the decrease value will be, and it is close to stable around 2 s, finally reaching the reference pressure of 15.5 MPa.
Analysis of External Characteristics of RCP
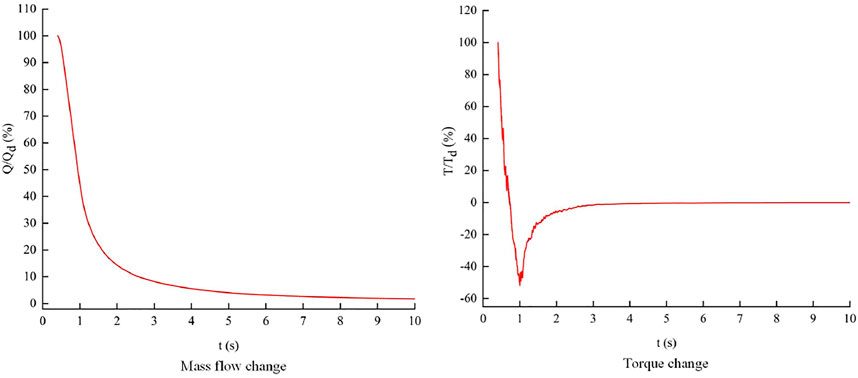
The change of flow rate and torque with time during pump shutdown is shown in Figure 9. It can be seen from the figure that when the pump rotation speed drops to 0r/min, due to the inertia effect of the fluid in the pipeline system, the mass flow rate does not immediately drop to 0 m3/h, but rapidly decreases before the time point when the rotation speed of the pump decreases to 0r/min, and then slowly decreases. The overall trend shows an exponential function, and by 10 s, the mass flow rate decreases to 1.7% of the stable operation. The torque decreased sharply with the transition process of pump stopping. The torque decreases sharply at first and becomes 0N•m at 0.68 s. When the pump speed drops to 0r/min, it drops to −51.89% of the stable operation. Then it rises slowly and becomes flat at 2.2 s, close to 0N•m.
Flow Analysis in Impeller Passage
Figure 10A shows the pressure change in the impeller passage during the pump stop transition. The pressure from impeller inlet to outlet presents obvious gradient change in the stable operation state. As a result of rapid stop blocking of impeller flow and fluid inertia, the transition process stopped after the start in the pump, the impeller import part of the fluid to the impeller flow in inlet pressure increases first and then, within the impeller outlet outside part of the fluid to the impeller flow in inlet pressure increases after the first decreases, and export pressure decreases then increases first. Figure 11A shows the pressure change at the monitoring point in the impeller passage of the pump during the pump shutdown transition process, which is consistent with the trend of change in Figure 10A. When the monitoring point P1 runs smoothly, the pressure value is the smallest in the monitoring points P1, P2, and P3. In the process of pump shutdown transition, the pressure value rises sharply to the maximum value of 15.64 MPa and then decreases slowly. The next monitoring point, P2, dropped sharply to 15.27 MPa and then rose. When the pressure value of P3 is the largest in stable operation, the pressure value drops sharply to the minimum value of 15.19 MPa and then rises. With the process of pump shutdown transition, the pressure values in the impeller flow passage tend to be stable and close to the reference pressure of 15.5 MPa.
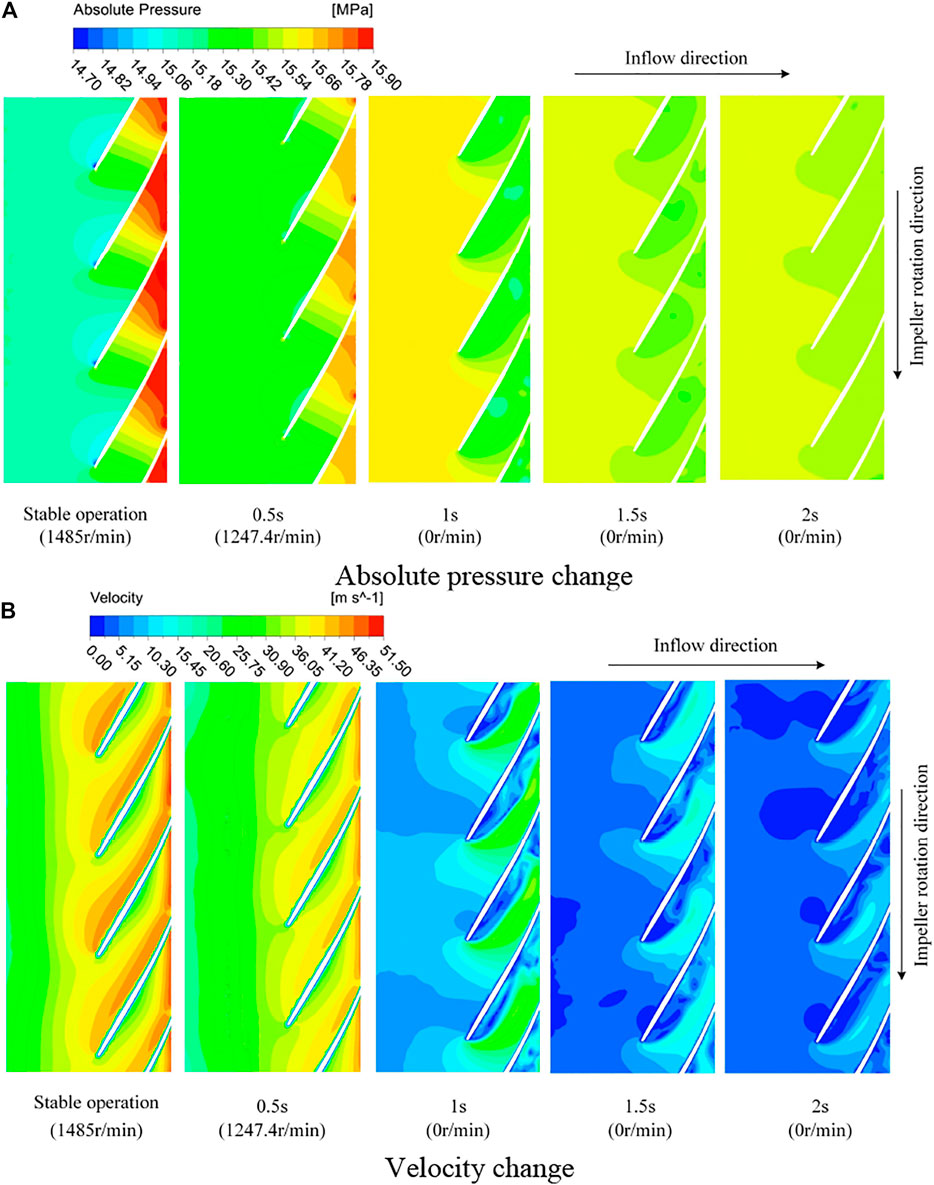
FIGURE 10. Change of absolute pressure (A) and velocity (B) in impeller passage during the transition process.
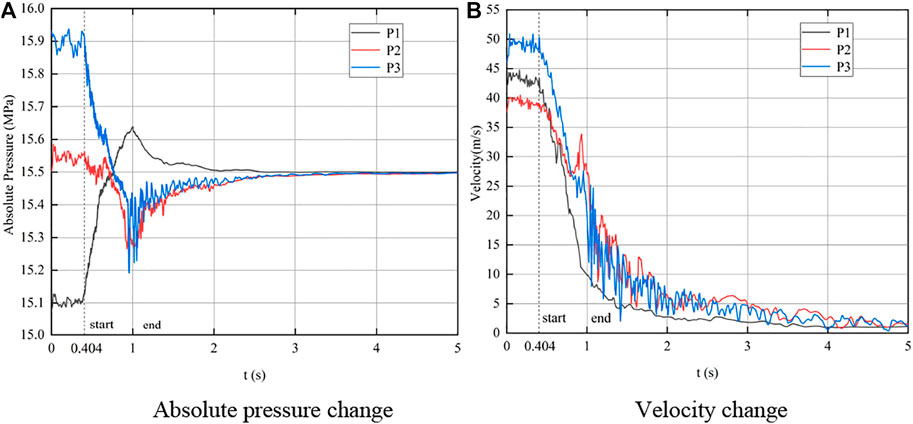
FIGURE 11. Change of absolute pressure (A) and velocity (B) at monitoring points in impeller passage during the transition process.
Figure 10B shows the velocity changes in the impeller during the pump shutdown transition process. After the pump shutdown transition process starts, the velocity in the flow passage gradually decreases compared with the stable operation state of the pump. Figure 11B shows the velocity changes at the monitoring points in the impeller passage of the pump during the transition process of pump shutdown. The velocity at P1 gently decreases during the transition process, while the velocity at P2 and P3 gradually decreases and is accompanied by oscillation. At 5s, the speed of each monitoring point was close to 0 m/s.
Load Analysis of Blade
Figure 12 shows the pressure distribution on different spans of blades along the flow direction during the pump shutdown transition process. The variation trend of blade load along with the transition process is relatively consistent on the span of 0.1, 0.5, and 0.9. At 0.5 s, the pump shutdown transition process has begun, the pressure on the pressure surface is greater than the pressure on the suction surface, and the pressure difference becomes smaller compared with the stable operation. The torque is smaller than that of smooth operation. All these make the torque relatively stable and the operating value smaller. Currently, the torque of the impeller to the fluid is active. In the transition process of pump shutdown, the pressure on the pressure surface gradually decreases, and the pressure on the suction surface gradually increases. The pressure on the suction surface begins to become larger than the pressure surface, leading to the negative torque, and the torque of the fluid on the impeller gradually becomes active. At 1 s, the pressure difference between the suction surface and the working pressure surface reaches the maximum, resulting in reverse peak torque. At 1.5 s, the pressure on the suction surface is still greater than that on the pressure surface, but less than the pressure difference at 1 s, so the torque value is still negative, but the value decreases somewhat. When it reaches 2 s, the pressure of the pressure surface is close to that of the suction surface, and the torque is close to 0N•m. The overall trend of torque is consistent with Figure 9.
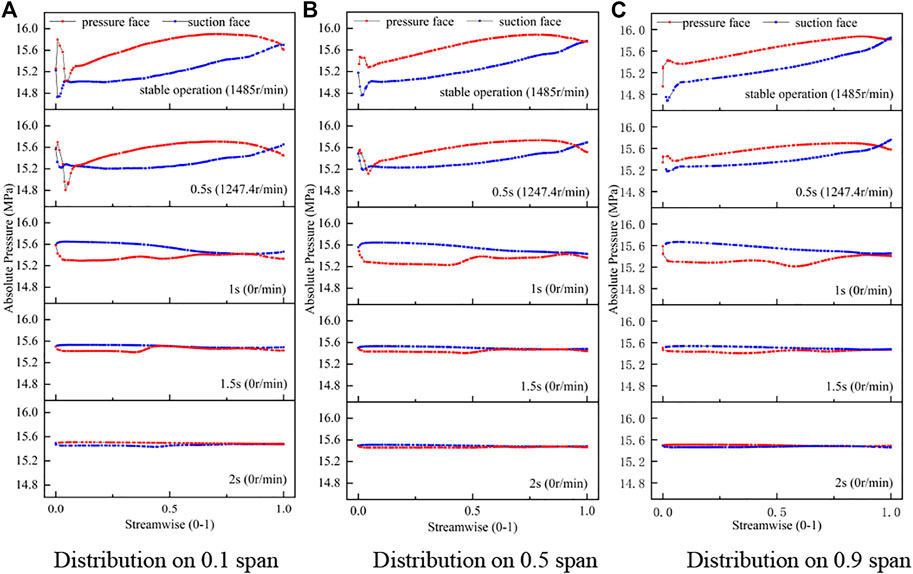
FIGURE 12. Absolute pressure distribution on one blade 0.1 span (A) 0.5 span (B) and 0.9 span (C) during the transition process.
Flow Analysis in Guide Vane Passage
Figure 13A shows the pressure changes in the guide vane during the pump stop transition process. After the start of the pump shutdown transition process, the fluid continues to flow to the outlet of the pump because the impeller stops fast and hinders the flow and the inertia of the fluid, leading to the pressure in the guide vane dropping first and then rising slowly. Figure 13A shows the change diagram of the pressure monitoring points during the pump stop transition process. The pressure values of the monitoring points P4, P5, and P6 inside the guide vane flow passage all drop sharply. The pressure value of P5 point decreases most sharply, reaching 15.21 MPa. Then there is the pressure value at P6, which drops to 15.29 MPa. The pressure value of P4 drops slightly, which is 15.38 MPa. With the progress of the pump shutdown transition process, the final pressure values in the guide vane passage are close to the reference pressure of 15.5 MPa and tend to be stable.
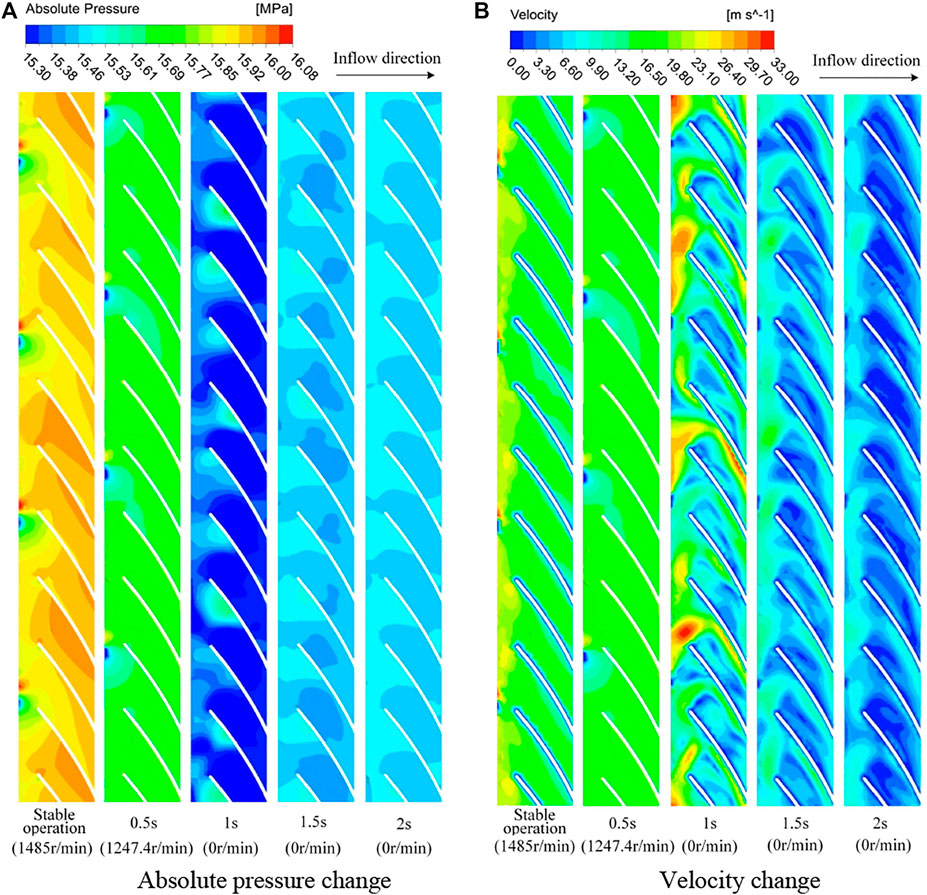
FIGURE 13. Change of absolute pressure (A) and velocity (B) in guide vane passage during the transition process.
Figure 14B shows the velocity changes in guide vane passage during the pump stop transition process. After the start of the pump shutdown transition process, the velocity in the flow passage first decreases, then increases, and then decreases. Figure 14B shows the change diagram of velocity monitoring points in guide vane passage during the pump stop transition process. The speed of the monitoring point in the guide vane channel increases suddenly and then decreases slowly at about 1 s. At 5 s, the velocity of the monitoring point in the guide vane passage is close to 0 m/s.
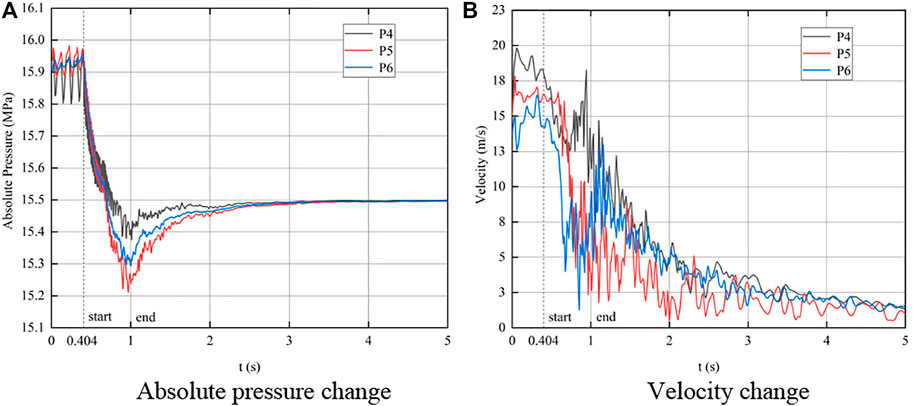
FIGURE 14. Change of absolute pressure (A) and velocity (B) at monitoring points in the guide vane passage during the transition process.
Conclusion
1) In the pump under the shutdown accident shows obvious transient effect, the pressure near the RCP inlet in the pipeline system increases and then decreases, and the pressure near the RCP outlet first decreases and then increases. The maximum pressure is at the pump inlet and the minimum pressure is at the pump outlet.
2) With the process of pump shutdown, the flow rate decreases rapidly. The torque curve first drops sharply to zero and continues to decrease to the negative extreme when the pump rotation speed drops to zero, finally the torque rises slowly and then tends to zero.
3) During the transition process of pump shutdown, the work capacity of the impeller decreases gradually. The pressure at the inlet of the impeller passage first increases and then decreases, the pressure the outlet of the impeller passage first decreases and then increases, and the velocity in the impeller channel gradually decreases to zero. The load of the impeller blade changes from the pressure on the pressure surface is greater than that on the suction surface during stable operation to the pressure on the suction surface is greater than that on the pressure surface, after reaching the peak value, the pressure difference gradually decreases to zero.
4) The pressure in the guide vane passage decreases rapidly at first and then increases slowly during the transition process of pump shutdown. When the velocity in the guide vane channel decreases, the velocity rises suddenly when the pump rotation speed drops to 0r/min, and then continues to drop to zero.
Data Availability Statement
The original contributions presented in the study are included in the article/Supplementary Material. Further inquiries can be directed to the corresponding author.
Author Contributions
D-HL: Data curation, software, formal analysis, writing-original draft. Y-BL: Resources, formal analysis, supervision, funding acquisition. FZ: Formal analysis, validation. Y-LG: Visualization, investigation. C-XY: Methodology. X-YW: Resources, data curation.
Funding
The work in this paper is supported by the National Defense Basic Scientific Research Program of China (Grant No. JCKY2019427D001) and the National Natural Science Foundation of China (Grant No. 51866009).
Conflict of Interest
The authors declare that the research was conducted in the absence of any commercial or financial relationships that could be construed as a potential conflict of interest.
Publisher’s Note
All claims expressed in this article are solely those of the authors and do not necessarily represent those of their affiliated organizations, or those of the publisher, the editors, and the reviewers. Any product that may be evaluated in this article, or claim that may be made by its manufacturer, is not guaranteed or endorsed by the publisher.
References
Azzoune, M., Boumedien, A., Lababsa, D., Boulheouchat, M. E.-H., and Ameur, A. (2019). Analysis of a Loss-Of-Flow Accident Resulting from the Primary Pump Shaft Break Transient of the NUR Research Reactor. J. Nucl. Sci. Tech. 56 (1), 130–145. doi:10.1080/00223131.2018.1532845
Farhadi, K. (2011). Transient Behaviour of a Parallel Pump in Nuclear Research Reactors. Prog. Nucl. Energ. 53 (2), 195–199. doi:10.1016/j.pnucene.2010.05.001
Fu, S., Zheng, Y., Kan, K., Chen, H., Han, X., Liang, X., et al. (2020). Numerical Simulation and Experimental Study of Transient Characteristics in an Axial Flow Pump during Start-Up. Renew. Energ. 146, 1879–1887. doi:10.1016/j.renene.2019.07.123
Gao, H., Gao, F., Zhao, X., Chen, J., and Cao, X. (2013). Analysis of Reactor Coolant Pump Transient Performance in Primary Coolant System during Start-Up Period. Ann. Nucl. Energ. 54, 202–208. doi:10.1016/j.anucene.2012.11.020
He, G. N., Zhang, F. Y., Li, D. H., Wu, G., Hu, Y., and Lu, J. (2021). Design Research and Performance Tests of HPR1000 Model ZH-65 Steam Generator. Press. Vessel Tech. 38 (4), 48–52.
Kim, S.-G., Lee, K.-B., and Kim, K.-Y. (2014). Water Hammer in the Pump-Rising Pipeline System with an Air Chamber. J. Hydrodyn 26 (6), 960–964. doi:10.1016/S1001-6058(14)60105-0
Li, Y.-b., Fan, Z.-j., Guo, D.-s., and Li, X.-b. (2020). Dynamic Flow Behavior and Performance of a Reactor Coolant Pump with Distorted Inflow. Eng. Appl. Comput. Fluid Mech. 14 (1), 683–699. doi:10.1080/19942060.2020.1748720
Liu, X. J., Liu, J. S., Wang, D. Z., and Yang, Z. (2009). Test Study on Safety Features of Station Black-Out Accident for Nuclear Main Pump. At. Energ. Sci. Tech. 43 (05), 448–451.
Liu, Y.-f., Zhou, J.-x., Guo, Q., Shen, A.-l., and Zhang, J. (2021). 3-D CFD Simulation of Transients in Multiple Pump System with Some Pumps Being Stopped. J. Hydrodyn 33 (3), 583–592. doi:10.1007/S42241-021-0042-8
Long, Y., Yuan, S. Q., Zhu, R. S., Qiang, F. U., and Tianbin, L. I. (2020). Review on Research Status of Internal Flow and Technological Development of Reactor Coolant Pump. J. Drainage Irrigation Machinery Eng. 38 (11), 1081–1097. doi:10.3969/j.issn.1674-8530.20.0238
Lu, Y., Zhu, R., Wang, X., An, C., Zhao, Y., and Fu, Q. (2019). Experimental Study on Transient Performance in the Coasting Transition Process of Shutdown for Reactor Coolant Pump. Nucl. Eng. Des. 346 (4), 192–199. doi:10.1016/j.nucengdes.2019.03.007
Sabotinov, L., and Srivastava, A. (2010). Large Break Loss-Of-Coolant Accident Analysis of VVER-1000 Reactor Using CATHARE Code. Nucl. Tech. 170 (1), 123–132. doi:10.13182/NT10-A9451
Su, S. Z., Wang, P. F., Xu, Z. B., Ruan, X. D., and Kong, W. J. (2017). Study on Pressure Fluctuation and Radial Force during Startup of Reactor Coolant Pump. Nucl. Power Eng. 38 (3), 110–114.
Tang, J., Lu, D., Liang, J., Ma, X., Liu, Y., Ye, S., et al. (2021). Numerical Simulation on Asymmetrical Three-Dimensional Thermal and Hydraulic Characteristics of the Primary Sodium Pool under the Pump Stuck Accident in CEFR. Nucl. Sci. Eng. 195 (5), 478–495. doi:10.1080/00295639.2020.1834314
Wang, X., Lu, Y., Zhu, R., Fu, Q., Chen, Y., and Zhong, W. (2020). Experimental Study on Transient Characteristics of Reactor Coolant Pump under Rotor Seizure Accident. Ann. Nucl. Energ. 136, 107039. doi:10.1016/j.anucene.2019.107039
Wu, D., Wu, P., Li, Z., and Wang, L. (2010). The Transient Flow in a Centrifugal Pump during the Discharge Valve Rapid Opening Process. Nucl. Eng. Des. 240 (12), 4061–4068. doi:10.1016/j.nucengdes.2010.08.024
Zhong, W. Y. (2018). Study on Fluid-Solid Interaction Transient Characteristics of Nuclear Reactor Coolant Pump under Shaft-Stuck Accident Condition. Jiangsu: Jiangsu University.
Nomenclature
RCP reactor coolant pump
Q mass flow rate
Qd nominal mass rate flow
H pump head
Hd pump head under nominal rate flow
t time
T torque
Td torque under rated condition
n pump speed
K resistance coefficient
ΔP pressure drop
A cross-sectional area of the pipeline
Greek
η efficiency
ρ density
Keywords: reactor coolant pump, reactor primary circuit closed system, shutdown, transition process, computational fluid dynamics
Citation: Li D-h, Li Y-b, Zhang F, Guo Y-l, Yang C-x and Wang X-y (2022) Study on Hydraulic Characteristics of Reactor Coolant Pump Shutdown Transition Process Based on Primary Circuit Closed System. Front. Energy Res. 9:808393. doi: 10.3389/fenrg.2021.808393
Received: 03 November 2021; Accepted: 13 December 2021;
Published: 02 February 2022.
Edited by:
Ling Zhou, Jiangsu University, ChinaReviewed by:
Dong Liu, Jiangsu Second Normal University, ChinaHao Yan, Hefei University of Technology, China
Copyright © 2022 Li, Li, Zhang, Guo, Yang and Wang. This is an open-access article distributed under the terms of the Creative Commons Attribution License (CC BY). The use, distribution or reproduction in other forums is permitted, provided the original author(s) and the copyright owner(s) are credited and that the original publication in this journal is cited, in accordance with accepted academic practice. No use, distribution or reproduction is permitted which does not comply with these terms.
*Correspondence: Yi-bin Li, bGl5aWJpbjU4QDE2My5jb20=
 Dong-hao Li
 Yi-bin Li