 Mengchao Yi
 Fachao Jiang1*
94% of researchers rate our articles as excellent or good
Learn more about the work of our research integrity team to safeguard the quality of each article we publish.
Find out more
ORIGINAL RESEARCH article
Front. Energy Res. , 17 December 2021
Sec. Electrochemical Energy Storage
Volume 9 - 2021 | https://doi.org/10.3389/fenrg.2021.806929
Lithium-ion batteries are widely used in electric vehicles and energy storage systems. Sudden fire accident is one of the most serious issue, which is mainly caused by unpredicted internal short circuit. Metal particle defect is a key factor in internal short circuit it will not show an obvious abnormal change in battery external characteristic just like mechanical and thermal abuse. So, a non-destructive testing of battery internal metal defect is very necessary. This study is first time to scan and analyze different types of defects inside a battery by using ultrasonic technology, and it shows the detection capability boundary of this methodology. A non-contact ultrasonic scanning system with multi-channel was built to scan the battery sample with aluminum foil, copper foil and copper powder defects. The position and shape of those defects were clearly shown by using tomography methodology. It was found that the acoustic properties difference between metal defects and battery active materials has a strong influence on detection sensitivity. Compared with aluminum foil, copper foil and copper powder are easier to be detected and change the ultrasonic signal greatly, they will produce an obvious shadowing artifacts and speed displacement phenomena in tomography images. Ultrasonic tomography technology is an effective method for non-destructive testing of lithium-ion batteries.
Characterized by high energy densities, wide operating voltage windows, and long service lifetimes, lithium (Li)-ion batteries (LIBs) are vital energy storage devices in new-energy vehicles and electronic products (Han et al., 2019). The performance and quality of LIBs have a direct impact on products in terms of the user experience and cyclic sustainability (Cordoba-Arenas et al., 2015; Xiang et al., 2017). However, during use, batteries undergo degradation and irreversible side reactions, and this can lead to accidents including fires and explosions (Ould Ely et al., 2019; Ren et al., 2019b; Huang et al., 2021) reviewed the LIB accidents that had occurred worldwide in recent years, including those related to electric vehicles, backup power-supply systems, and consumer electronics. In the absence of damage caused by external forces (e.g., collision or puncturing), internal short circuits (ISCs) (Ecker et al., 2017), overcharging (Ren et al., 2019a; Wang et al., 2021), and internal battery defects (IBDs) (Mohanty et al., 2016) have been found to be the primary causes of battery accidents. Battery abuse (e.g., overcharging) is identifiable and preventable when the battery management system is in normal operation, while ISCs and IBDs are problems that are hidden more deeply. In contrast to mechanical and thermal abuse that leads to significant abnormal changes in external battery parameters (e.g., voltage or temperature), ISCs and IBDs are more likely to cause unexpected safety accidents (Mohanty et al., 2016; David et al., 2018).
Both ISCs and IBDs share a common characteristic: the presence of metal-particle impurities—such as Li dendrites (formed after Li plating in batteries), copper (Cu) dendrites (formed after overdischarging), and scrap iron and welding slag splashes [accumulated during the manufacturing process (Mohanty et al., 2016)]—on the surface of the battery active material. In extreme situations, particularly after being charged at a high rate, there can be ultrahigh-temperature and -stress conditions between the electrode plates of a battery, allowing relatively large metal particles to crush the separator, which in turn causes an ISC.
To ensure undisrupted use of LIBs, nondestructive testing (NDT) methods have been developed. These mainly include neutron diffraction (ND) (Zinth et al., 2014), X-ray tomography (XRT) (Cai et al., 2020; Magnier et al., 2021), and ultrasonic testing (UT). Because a certain level of radiation is emitted during both the ND and XRT test processes, these two techniques require good protective measures. In addition, their implementation is costly. In contrast, as a common NDT technique, UT allows for accurate characterization of metal defects (e.g., pores, impurities, and cracks) without the need for ionizing radiation.
With the help of UT, researchers have gradually identified the relationships between the state of charge and state of health of batteries and the acoustic signals they reflect (Davies et al., 2017; Ladpli et al., 2017; Ladpli et al., 2018; Guorong et al., 2019; Zhao et al., 2021). Moreover, ultrasonic technology shows conspicuous advantages in the detection of some local, microscopic defects that cannot be easily identified using electrical signals. By producing tomographic scan images at different depths with high-frequency probes, (Bauermann et al., 2020), effectively analyzed the internal structures and defects of coin cells. Deng et al. (2020) analyzed electrolytes in terms of their wetting effects and gas generation based on variations in C-scan images. Chang and Steingart (2021) investigated color-palette variations in the C-scan images of batteries at different numbers of cycles and discovered internal Li-plating areas. Li and Zhou (2019) ultrasonically imaged and simulated pores of different sizes and at different depths in batteries. Bommier et al. (2020) provided the correlations between Li plating and acoustic signals in batteries under different operating conditions. Wu et al. (2019) put forward a method that monitors the thermal safety of batteries based on the time-of-flight (TOF) gate.
The use of UT to detect and locate metal impurities in batteries is a research topic with huge potential; however, to date, relatively few results using this approach have been published. Therefore, it is crucial to take advantage of the unique identification capacity of ultrasonic-based NDT techniques to detect and identify common highly hazardous metal impurities [e.g., aluminum (Al) and Cu] in batteries.
In this study, specific defects were first manually prepared and then implanted into a multilayer battery structure to produce a quantifiable and qualifiable defect-containing battery sample, which was subsequently comprehensively scanned using a noncontact, multichannel UT technique. The waveform signals and scan images corresponding to these defects were thoroughly analyzed to determine the effectiveness of the ultrasonic wave selected in this study for detecting different types of defect in the battery structure.
The uncertain nature of the growth of metal dendrites and distribution of metal slag in batteries precludes quantifiable preparation of a sample with local defects. In addition, metal particle impurities formed during the manufacturing process are randomly distributed on the surface of the battery active material, presenting a challenge to the selection of a sample with the required quality from commercially available batteries. Therefore, for the ultrasound-based defect-detection tests in this study, a battery sample was designed with the raw materials found in the dry cells in commercial batteries. Because this study was focused primarily on the variation of signal characteristics with the type of defect and battery material, defects were designed mainly on one side of the battery sample, while battery layers were added on the other side to analyze the effects of thickness on signals. The particle sizes of lithium and copper dendrites are relatively small, about 10–20 µm. Therefore, copper powder with a particle diameter of 10 µm in this work was used to imitate the deposition of metal dendrites and tiny debris. In addition, in order to explore the influence of material properties for ultrasonic signal, copper and aluminum foil are also used as the defects. And it is possible to compare the signal difference between the same material in the form of powder and pressed sheet. The following procedure was followed to prepare the battery sample.
1) Select four pairs of cathode and anode plates and remove their tabs (the extension from current collector).
2) Cut the cathode and anode tabs (Al and Cu foils, respectively) into halves along the center and diagonal lines to produce a rectangular Al-foil defect and a triangular Cu-foil defect. The shapes are only used to distinguish aluminum and copper foil more clearly on the C-scan image, and it will not have any influence on the ultrasonic signal.
3) Place one anode on a separator, then place the Cu and Al foils in the upper half of the surface according to Figure 1A, and subsequently spread and sufficiently compact approximately 3 g of Cu Figure 1A powder with a particle diameter of 10 µm on the separator.
4) Fold the separator and cover the anode, then place a Cu foil, an Al foil, and Cu powder on the separator in the same quantities as those on the anode surface according to Figure 1B, and subsequently add a cathode plate.
5) Stack the remaining three pairs of cathode and anode plates layer by layer from the bottom up, separate each cathode and anode using separators in a “Z”-shaped pattern. Figure 1C shows a sectional view of the overall structure.
6) Package the separators with high-temperature-resistant tape according to Figure 1D to form the main body of the battery cell.
7) Fix the battery cell with clamping plates and then subject it to hot pressing in a heating chamber at 80°C for 1 h.
8) Place the battery cell in a custom-made Al-plastic-film packaging bag, then add electrolyte into the bag. Subsequently, place the bag in a heating chamber at 40°C to sufficiently wet the battery cell, and finally complete the packaging process in a vacuum plastic-packaging machine to produce a defect-containing battery sample, as shown in Figure 1E.
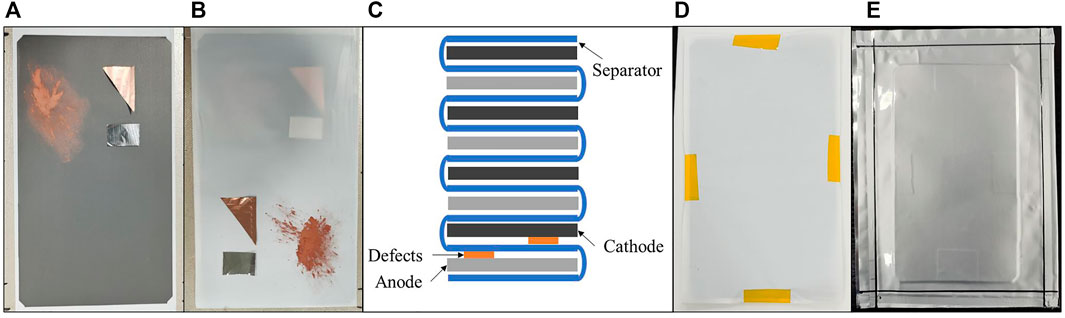
FIGURE 1. Internal structure of defective battery sample.
A separator was used to separate the defects on the cathode and anode surfaces. However, because this separator was relatively thin, the two sets of defects can be essentially considered to be located at the same depth in the battery. Table 1 summarizes the materials used to prepare the battery sample and their corresponding thicknesses. The overall thickness of the sample was approximately 1,600 µm. The thicknesses of the Cu and Al foils accounted for approximately 6.25 and 9.38‰ of the total thickness of the sample, respectively. The thickness of the Cu powder was further reduced during the battery preparation process. Detailed measurements performed after the battery was disassembled revealed that the thickness of the powder areas ranged approximately from 10 µm (at the edge) to 60 µm (at the thickest location) and accounted for less than 3.7% of the total thickness of the sample.
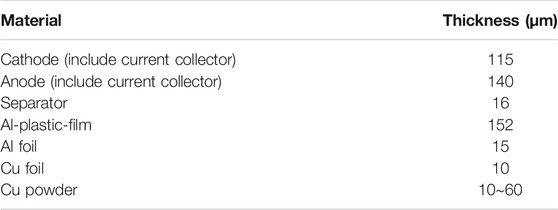
TABLE 1. Sample material thickness.
Color contrast in ultrasonic imaging arises from the difference between A-scan signal amplitudes. The signal amplitude reflects the variation of the sound pressure and is a primary basis for analyzing internal anomalies in a sample. Ultrasonic waves propagate steadily and continuously in homogeneous media, and their signals change only at the interface of two different materials. Sound-wave changes primarily involve the following phenomena. 1) The speed of a sound wave changes as it propagates from one material to another. 2) A sound wave scatters or is absorbed at an interface. 3) An inhomogeneous physical field alters both the amplitude and phase of a sound wave (Rahiman et al., 2008). The extent of these changes can be described by the difference between the acoustic impedances Z of the materials:
where Z is the acoustic impedance,
For example, a structure consisting of a material with an acoustic impedance of Z2 (material B) into which a material with an acoustic impedance of Z1 (material A) (Z1 < Z2) is embedded is used as an example for illustration. Figure 2 shows the changes in the pressure of a sound wave in this multilayer structure. The transmittance values (t1 and t2, respectively) and reflectance values (r1 and r2, respectively) at interfaces 1 and 2 are calculated using Eqs 2–5 (Rahiman et al., 2008):
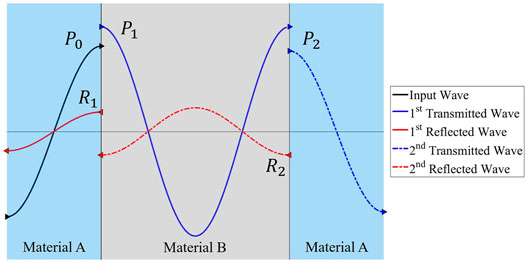
FIGURE 2. Principles of sound wave transmission and reflection in multilayer structure.
Without considering its energy loss, the total incident pressure of a sound wave equals its total outgoing sound pressure. As an initial incident sound wave with a pressure of P0 (solid black line) propagates from material A to material B, there is an increase in the pressure of the primary transmitted sound wave, P1 (solid blue line), which is accompanied by the generation of a reflected wave with the same phase and a pressure of R1 (solid red line). As the sound wave propagates from material 2 to material 1, there is a decrease in the pressure of the secondary transmitted sound wave, P2 (dotted blue line), which is accompanied by the generation of a reflected wave with an opposite phase and a pressure of R2 (dotted red line). The sound pressure attenuation coefficient α of this type of sandwich structure is calculated using:
Interfacial changes in the transmittance and reflectance are major parameters for analyzing defect locations and types. If the two materials have notably different acoustic impedances (e.g., when a sound wave encounters air while propagating in a solid medium), most of the sound-wave energy is reflected, allowing for clear identification of defects. Conversely, if the two materials have similar acoustic impedances, most of the energy is transmitted. Sound waves are insensitive to this type of condition, resulting in missed identification. Considering that a battery is composed of a multilayer structure, the received signals inevitably contain diffracted waves. Consequently, analysis based solely on the maximum peak sound pressure will yield errors. Therefore, α can be more accurately compared through the substitution of the independent sound pressure in Eq. 6 with the total cumulative sound pressure, which can be obtained through the integration of the amplitude of the received signal over the effective TOF range.
Table 2 summarizes the properties of the materials used to prepare the battery sample. Specifically, the data of cathode and anode are obtained from previous work (Yi et al., 2021), they were completely wetted in the electrolyte at a porosity of 30%. The others are standard materials, their acoustic properties are publicly available information.
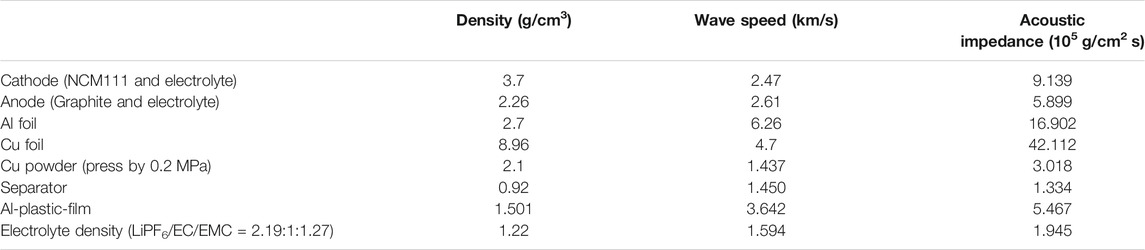
TABLE 2. Acoustic properties of battery sample materials.
Ultrasonic scanning and imaging techniques are widely used in fields such as battery testing (Goh et al., 2017; He et al., 2018; Perlin et al., 2019), construction engineering (Jorne et al., 2014; Choi et al., 2016), and medical science (Feril et al., 2003; Li et al., 2018; Wang et al., 2018).
There are three main ultrasonic imaging modes (Shi et al., 2021), and these are shown in Figure 3. 1) B-scan images of representative cross-sections (the green areas, i.e., the x–z and y–z planes). A B-scan image is generated based on the reflected signals on a straight line. These images are primarily used to characterize cross-sectional defects in samples. 2) C-scan images. A C-scan image is produced based on the maximum amplitude of the transmitted A-scan signals at each sampling point after the probe completes the scanning of a two-dimensional plane (the red area, i.e., the x–y plane). These images are primarily used to characterize the distribution of the defects within the scan area. 3) Tomographic images. Tomographic images in different time domains are produced based on transmitted A-scan signals selected within specific TOF ranges (the A-scan signals in the ranges marked by blue strips) to improve the display contrast between defects at different depths in C-scan images. B-scan images of different locations or tomographic images in different TOF ranges can be centrally stored and combined to produce animated tomographic scan images, and this can facilitate better visualization of the rendering process for internal defects.
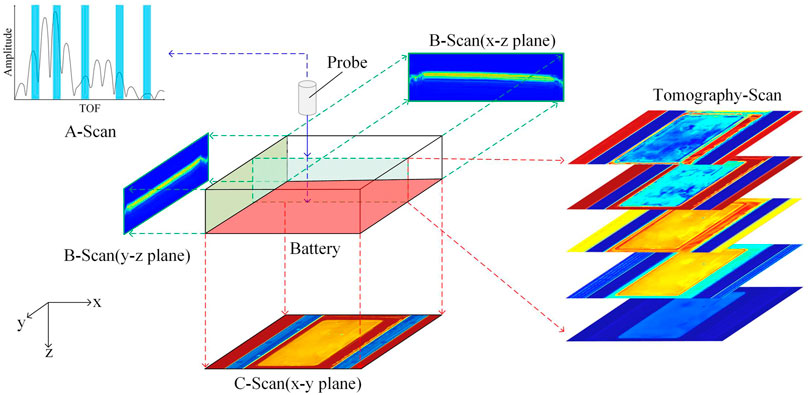
FIGURE 3. Schematic diagrams of different types of acoustic imaging.
Noncontact methods are usually employed in ultrasonic scanning and imaging. A probe is used to emit a sound wave, which then requires a medium to propagate to the battery. In UT, air and liquids are common media used for this purpose. While air coupling is easy to implement, sound waves diminish considerably during propagation in air. In addition, high-frequency sound wave in air is very difficult to transmit. Therefore, it is often required to use low-frequency probes to increase the sound pressure and wavelength. Because both the battery materials and the defects in the batteries are very thin, low-frequency signals transmitted to batteries through air coupling are insensitive to material changes. Consequently, information with respect to defects is missed, and the image resolution is relatively low. In comparison, these disadvantages associated with air coupling are nonexistent when sound waves propagate in liquids. For scanning and imaging of small batteries, the liquid coupling method used by Deng et al. (2020) is superior to the air coupling method used by Li and Zhou (2019) and Chang and Steingart (2021).
Therefore, the non-contact-multiple acoustic channel-battery in situ testing (NCMAC-BIST) methodology proposed in previous work (Yi et al., 2021) was applied in this study. The ultrasonic equipment was developed by Tsinghua University and manufactured by Solid (Beijing) Technology Co., Ltd., it can support maximum eight channels of signal transmission and reception at the same time. The output excitation signal was a 220 V pulse signal with 200 ns pulse width, recording frequency in C-scan were 80 MHz. Figure 4A shows a schematic diagram of the principle of its operation. The battery sample was fixed with metal fixtures (the defects were on the rear side) and wetted in dimethicone with a viscosity of 10 cSt (DOWSIL, PMX-200). A total of four 2.5 MHz focusing probes (1–4, from Guangdong Goworld, mark: 2.5P14) were placed at both sides of the battery to generate and receive three sets of ultrasonic signals, namely transmitted signals (probes 1 and 2), reflected signals from the front side (probe 3), and reflected signals from the rear side (probe 4). The four probes were driven by motors to move simultaneously (see Figure 4B for the scanning paths (dotted black lines)) and produce respective scan images.
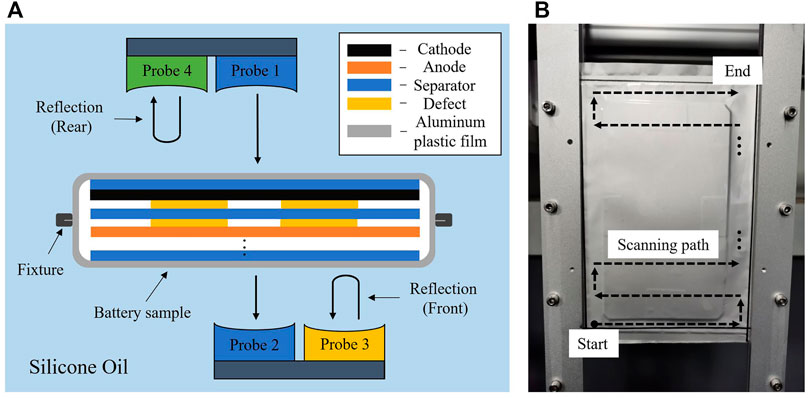
FIGURE 4. Non-contact NDT methodology for defective battery.
Figure 5 shows the C-scan images produced based on the maximum amplitudes of the transmitted and reflected ultrasonic signals. Observation of Figure 5A reveals the following. Because the Al–plastic film was relatively thin and the battery was well vacuumed during the preparation process, the ultrasonic signals almost directly penetrated the area devoid of the jelly roll with nearly no obstruction. As a result, the transmission receiver probe received relatively large voltage amplitudes, which refer to the red pixels in the color bar. Clear battery edges surrounded by ghosting artifacts can be seen in each C-scan image, and these can be attributed to the cathode plate being slightly larger than the anode plate. A lack of an adjacent matching anode material for the excessive cathode area weakened the propagation of the sound wave. As a consequence, these areas were not as well imaged as those where the cathode and anode overlapped.
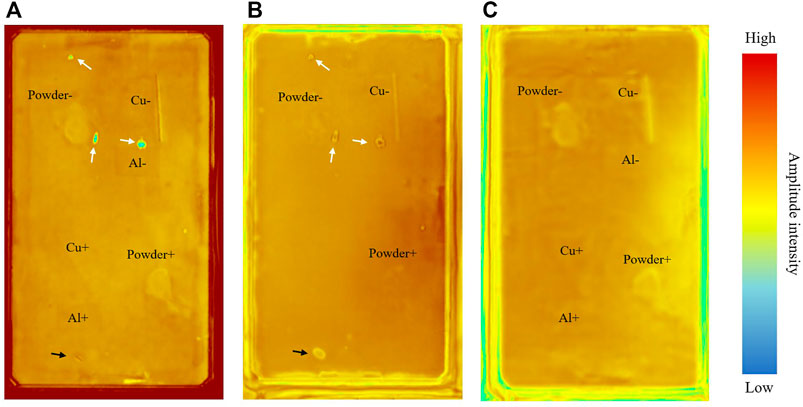
FIGURE 5. Transmission C scan (A), reflection C-scan in front side (B) and rear side (C).
In the transmission image, the signal amplitudes at most locations are relatively high, as indicated by an orange color. There are three notable green areas in the image (marked by white arrow), suggesting that the transmission probe received signals with relatively low amplitudes from these locations and that the sound wave was attenuated during the propagation process. A comparison of the two reflection C-scan images (Figures 5B,C) reveals the presence of three anomalous circular areas, each with relatively high signal amplitudes in the center, at the corresponding locations in the reflection image of the front side, as well as a lack of corresponding anomalous areas in the reflection image of the rear side. These findings suggest that particles in the air may have adhered to the surface of the jelly roll in these three areas during the battery packaging process, which subsequently raised the Al-plastic film and formed air bubbles on the front side. The transmitted signal from the anomalous circular area in the bottom of the C-scan images (marked by black arrow) was found to undergo a notable transitional change with no decrease in its amplitude, suggesting the presence of a normal Al–plastic-film fold or indentation in this area.
In order to provide a convenient comparison, the names and their specific positions of visible corresponding defect on the cathode (+) and anode (−) for each C-scan image are marked in. Of the three C-scan images, the implanted Cu and Al foils and Cu powder are clearly visible in the transmission image and the reflection image of the rear side. The upper and lower parts of each of these two images correspond to the defect layers embedded onto the cathode and anode surfaces, respectively. In contrast, only the edges of the triangular Cu foil in the defect layer at the anode side can be partially and faintly seen in the reflection image of the front side. In the transmission C-scan image, the color of the defects differs slightly from that of the surrounding area. For example, the Cu- and Al-foil defect areas are darker in color than their surrounding areas, suggesting that the transmitted signals received from these areas had relatively high amplitudes. An opposite phenomenon can be observed in the Cu-powder defect areas. Color differences are inconspicuous in the reflection C-scan images, in which the defects can be mainly distinguished based on their light-colored external contours. The shape contours of the triangular Cu foils and the rectangular Al foils are clearly visible in all the C-scan images, with the highest clarity in the transmission image and relatively low clarity in the reflection image of the rear side (mainly because the battery sample was not accurately placed at the focus of the reflection probe for the rear side during the focusing process).
The Cu-powder defects were highly susceptible to deformation, as the jelly roll of the battery underwent high-temperature hot pressing and vacuum treatments. As a result, the final shapes of the Cu-powder defects differed from their initial shapes during the preparation process. Figures 6A,B shows photographs of the cathode and anode material surfaces taken after the battery was disassembled (the Cu and Al foils were removed to facilitate observation). Figures 6C,D shows enlarged views of the Cu-powder defect areas as well as the residual Cu-powder areas at the cathode and anode sides in the transmission C-scan image. The Cu powder on the cathode surface shows a tendency to spread towards the edges, while well-preserved Cu powder can be seen on the anode surface. This phenomenon can be ascribed to the following two factors. 1) The cathode surface was flatter and smoother than the anode surface. As a result, the Cu powder particles adhered relatively poorly to the cathode surface and drifted with the electrolyte to other locations. 2) The Cu powder on the cathode surface was closer to the opening of the Al–plastic-film packaging bag and was therefore susceptible to being pulled out alongside the air and electrolyte during the vacuuming process. A comparison of the true conditions of the battery observed after its disassembly and the transmission C-scan image reveal that the ultrasound image succeeds in displaying approximate contours of the Cu-powder defects but fails to clearly show their relatively thin areas. This is because the single wavelength of the 2.5 MHz ultrasonic wave in the battery was approximately 400 μm, much greater than the accumulated thickness of the Cu powder. Consequently, the sound waves were not highly sensitive to the relatively thin Cu-powder areas. Addressing this problem requires the use of higher-frequency probes.
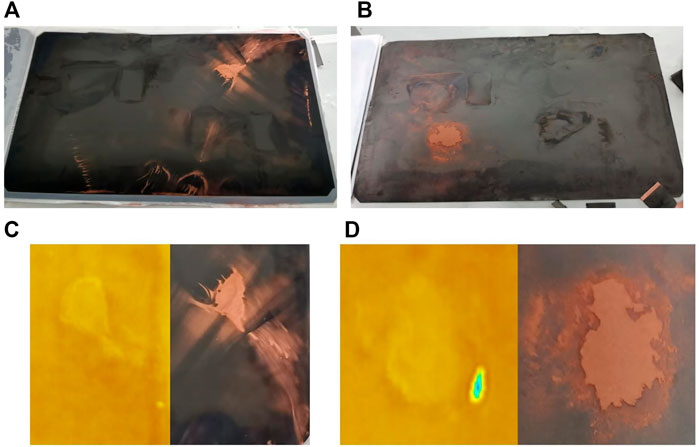
FIGURE 6. The surface of the cathode (A) and anode (B) after disassembly. Partial enlargement comparison of Cu powder in transmission C-scan image and the remnants on electrode surface, (C) for cathode and (D) for anode.
Figure 7 shows the waveform of the transmitted ultrasonic signal from the center of the battery. The TOF of the waveform can be seen distributed mainly in the range of 29–35 µs. Here, tomographic transmission C-scan images were produced at TOF gates of 0.1 µs over the TOF range.

FIGURE 7. Example of transmission waveform at the center point of battery, several intervals were selected with a small TOF gate.
Figure 8 shows the tomographic transmission C-scan images for six different TOF intervals, i.e., those intervals correspond with 1–6 TOF gates marked by blue strips in Figure 7 (intervals 1–3 were within the main-wave; interval 4 was between the main wave and the first derivative wave; and intervals 5 and 6 were at the highest points of the first and second derivative waves, respectively).
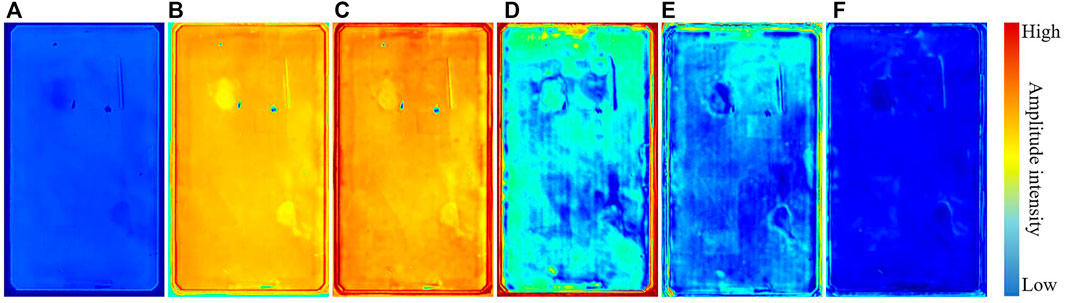
FIGURE 8. Transmission C-scan Tomography images in different TOF intervals.
The image in Figure 8A was produced based on the first peak of the main wave. It can be seen that the internal defects could be identified once the transmission probe began to receive the transmitted sound wave. While the amplitudes in this image are generally small, the edges of the defects differ in color from the blue background, indicating the presence of materials and structures different from those in other areas. However, the color contrast between the defect areas and the areas surrounding them varies to different degrees with the TOF. Overall, of all the tomographic transmission C-scan images, those in Figures 8B,C are the best in terms of displaying the defects. The image in Figure 8B shows the clearest defects, which can be attributed to the fact that intervals 2 and 3 corresponded to the two consecutive relatively high peaks of the main wave and that interval 2 preceded interval 3. The interfacial transmittance and reflectance of a sound wave will change upon encountering a defect. Therefore, the notable change in the peak of the transmitted wave within interval 2 was accompanied by the generation of a reflected wave, which was later superimposed with the forthcoming wave within interval 3. The effects of the reflected wave within interval 2 are therefore unavoidably included in the tomographic transmission C-scan image for interval 3. Consequently, the color differences in some areas are relatively more pronounced in Figure 8C.
Figures 8D–F show tomographic C-scan images produced based on the derivatives of the transmitted wave. Of these images, only the image in Figure 8E relatively clearly shows the defects. Note that even the two difficult-to-see thin metal layers on the anode surface appear with relatively high contrast in Figure 8E, which can be ascribed to two factors: 1) The high signal transmittance and the generation of relatively small derivative waves in the defect-free area; and 2) The resulting notably stronger derivative waves formed due to the defect areas. This principle is similar to that for the phenomena seen in Figures 8B,C. While their locations can still be approximately distinguished in Figures 8D,F, the defects appear in these two tomographic images with less clear shapes and lower color contrast compared to the tomographic images for the main-wave interval. This difference can be attributed to the significant decrease in the signal-to-noise ratio of the waveform and the increase in the color difference between the background noise and some individual areas at these TOF intervals and does not mean that folds or severe consistency differences interfering with the identification of the defects occurred in the battery. Therefore, when ultrasonic C-scan imaging is employed to identify relatively thin defects, it is necessary to select wave peaks with amplitudes as large as possible and at TOF intervals as early as possible within the main-wave interval to produce tomographic images, as well as to mark notable, relatively reliable defects. For any questionable defect, it is necessary to produce another image based on the highest peak within the first derivative wave interval and further determine the authenticity of the defect through observation of contrast changes.
Eight points were selected in the battery sample to better compare the effects of different defects on the propagation of the ultrasonic waves. In Figure 9, these are eight points were marked for signal analysis, corresponding to the Cu (P1) and Al foils (P2) and Cu powder (P3) on the anode surface, the Cu (P4) and Al foils (P5) and Cu powder (P6) on the cathode surface, the defect-free area at the center (P7), and the edges of the Cu foil on the anode surface (P8), respectively.
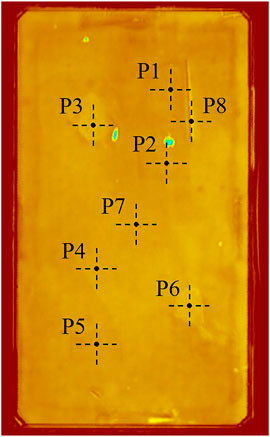
FIGURE 9. Location of each defect selection point for signal analysis.
Figure 10 compares the transmitted signals from the defects on the cathode (Figures 10A–C) and anode surfaces (Figures 10D–F) and the defect-free area (the solid blue lines, solid orange lines, solid yellow lines, and dotted black lines depict the waveforms of the ultrasonic wave passing through the Cu and Al foils, the Cu powder, and the defect-free area, respectively).
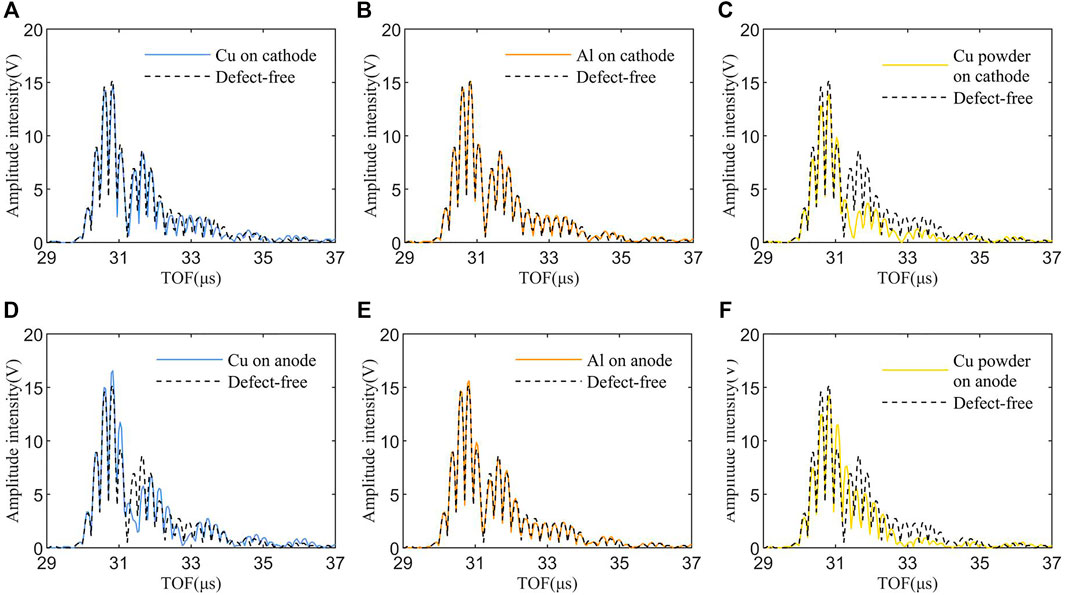
FIGURE 10. Transmission signal of Cu foil, Al foil and copper powder on cathode and anode surface vs. transmission signal of defect-free position.
The battery is such a multi-layer composite structure, when sound waves are transmitted layer by layer, echo waves will be generated at the interface of each layer. With the increasing of layers or the acoustic impedance difference between materials, an obvious derivative wave will appear behind the main wave. The waveforms of the ultrasonic waves propagating in all areas but the Cu powder were very similar, and each consisted of a main wave peak part and two derivative wave peak parts, suggesting that the defects accounted for a small proportion of the battery in the thickness direction and did not significantly alter its original structure.
For the main wave peak part, the amplitude of the sound waves was larger when passing through each of the Cu and Al foils than the defect-free area, with the amplitude in the Cu foil being the largest of those in the three areas, because the acoustic impedance of metal foils are several times greater than that of the cathode and anode materials, which will inevitably increase the sound pressure. In contrast, the amplitude in the Cu powder was smaller than that in the defect-free area, which is the reason that the Cu- and Al-foil areas are darker in color and the Cu-powder area is lighter in color on the anode surface in the C-scan transmission image in Figure 5A.
For the derivative wave peak parts, the amplitude of the transmitted signal from the Cu-foil area on the anode surface was smaller than that of the transmitted signal from the defect-free area within the first echo interval. This phenomenon well illustrates that the acoustic impedance of the Cu foil is much higher than those of the graphite and separator. The pressure of the sound waves increased when propagating from the graphite to the Cu foil. In contrast, there was a decrease in the pressure of a sound wave upon propagation into the separator, which was accompanied by the formation of a reflected wave in the opposite direction, which reduced the energy of the subsequent sound waves. Because the Cu foils were relatively thin, the phase difference between the reflected and incident waves was less than 90°, and a frequency dispersion that led to peak shifts occurred at 31–32 µs, which indicates that there is an interface with a large difference in acoustic impedance inside battery. The basic match between the waveforms of the signals from the Al-foil and defect-free areas suggests that the acoustic impedance of the Al foils differed to a smaller extent from those of the graphite and separator compared to the Cu foils and that the Al foils did not significantly alter the sound waves. Due to copper powder is a porous structure material with low acoustic impedance, it has a strong obstruction to both the main wave and the derivative wave. Therefore, the derivative wave in transmission signal at the copper powder position is significantly lower than that of other metal foils. Relatively few derivative signals were received from the Cu-powder areas and were closer to the main wave, suggesting that the sound waves were mostly absorbed when passing through the Cu powder and only a small part of them escaped.
Figure 11A compares the transmitted signals from the edges of the Cu foil at the anode side and the defect-free area. It can be seen that the signal amplitude decreased considerably at the edges of the Cu foil. Here, the echoes from the defect-free area disappeared almost completely and only some relatively small echoes remained. Figure 11B can be used to provide an excellent explanation for the weakening of a sound wave at an edge. When a defect emerges between the two material layers in a battery, one edge of the defect unavoidably creates a void through compression. This void is filled with air or the electrolyte, which has a relatively low acoustic impedance, resulting in the formation of a miniscule cavity. A sound wave is significantly reflected when passing though this cavity. As a result, the probe can only receive a relatively small amount of the transmitted energy. Hence, when defects with relatively large particle sizes or rough edges appear on electrode surfaces, the void created by their edge can result in notable signal changes that can facilitate their identification, even if the defects and the electrode materials share very similar properties.
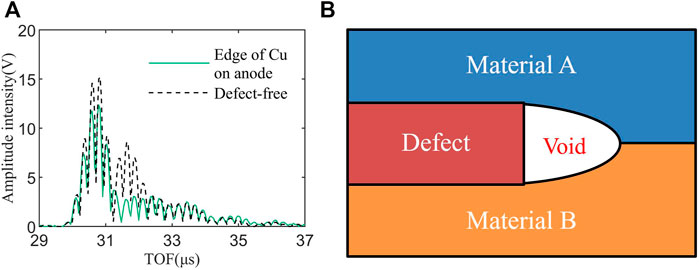
FIGURE 11. (A) Transmission signal at the edge of Cu foil vs. transmission signal of defect-free position; (B) Schematic diagram of the void produced by extrusion of the defect between two materials.
Changes in the transmittance of the sound waves due to the difference between the properties of the defects and the electrode material can be more clearly observed from a sound pressure energy perspective.
The total sound pressures at P1–P6 in Figure 9 were obtained through integration of the respective sound-wave signals and subsequently normalized through division by the total sound pressure energy corresponding to the defect-free area (i.e., P7). The solid orange and blue lines in Figure 12 show the sound-pressure attenuation rates at the defects (P1–P3) on the anode surface and those on the cathode surface (P4–6), respectively. The theoretical sound-pressure attenuation rates at P1–P6 were calculated based on Table 2, Eqs 2–6, and Figure 2 (see the dotted orange and blue lines in Figure 12 for the results).
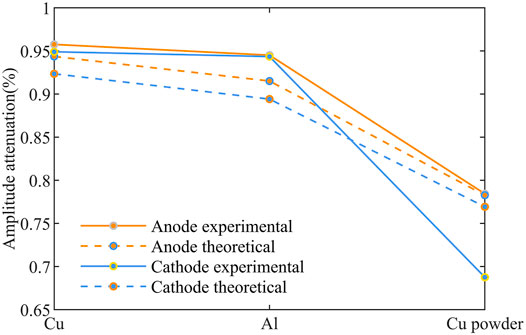
FIGURE 12. Experimental and theoretical comparison of transmittance changes caused by different defects.
A comparison reveals a basic consistency between the experimental and theoretical trends of the total sound pressures. The transmittance of the sound waves was found to be much greater during propagation in the thin metal layers than in the metal powder areas. In addition, the transmittance of the sound waves was found to be higher at the defects on the anode surface than those on the cathode surface. The pressure of the sound waves was found to remain above 92% during propagation in the Cu and Al foils at both the cathode and anode sides. These findings show the following. 1) A miniscule defect layer in the normal battery structure invariably causes a loss in sound-wave energy, which is the direct basis for determining the presence of defects. 2) While a defect increases the signal amplitude within the main-wave interval, it can still partially block the sound-wave energy, which is shown by a decrease in the signal amplitude within the derivative-wave intervals. 3) As mentioned in Section 3.3, there is indeed a peak amplitude increase in main wave area (Figures 10D,E), but according to the Eqs 2–5, only when the acoustic impedance of each layer of material is in an increasing state, the final sound pressure energy will increase. Once the wave transfer from a material with a large acoustic impedance to a small one, the transferred energy will be blocked and a reflected wave will be generated. So as the consequence, sound pressure energy will be lost after sound wave propagate to electrode, separator or other remaining materials from defects. Combine the above findings, determining the presence of defects based solely on the highest peak in the waveform is not completely accurate. Changes in the total transmitted sound-wave energy are required as an adjunct to facilitate further assessment.
Theoretically, the transmittance is higher in the Al-foil areas than in the Cu-foil areas. However, this difference is not evident in the experimental results. In particular, the experimental results show almost identical transmittance values at the Al foils at both the cathode and anode sides, which are approximately the same as the transmittance value at the Cu foil at the cathode side. This phenomenon can be mainly attributed to the relatively low detection sensitivity that occurs when the wavelength of the sound wave is much greater than the thickness of the metal defect layer. In addition, the cathode material has a relatively high acoustic impedance that differs to an even smaller extent from those of the metals and, consequently, does not induce very much sound-wave reflection. Therefore, from a total sound pressure perspective, the 2.5 MHz ultrasonic waves are highly effective at identifying the defects on the anode surface but are limited in their identification of the types of thin metal layers on the cathode surface.
The Cu powder on each of the cathode and anode surfaces led to significant sound-wave attenuation. The theoretical transmittance of the Cu powder on each surface is approximately 77%. The experimental value of the transmittance of the Cu powder on the cathode surface is very close to the theoretical value, while the experimental value for the cathode surface is lower than the theoretical value. This is mainly because the Cu-powder defects have relatively high inherent porosity. Even if the Cu powder is completely wetted in the electrolyte and compacted, its density and elastic modulus are still below those of solid metals (see Table 2 for the detailed parameters). Under this condition, the acoustic impedance of the Cu powder differs less significantly from that of the anode than that of the cathode. As a consequence, compared to the anode surface, the presence of metal powder on the cathode surface more significantly attenuates the sound waves.
Compared to the reflected signals from the front side, the defects were more clearly characterized by the reflected signals from the rear side. Therefore, only the reflected signals from the rear side are used here for discussion.
Figure 13 and Supplementary Figures S1, S2 show the comprehensive reflection images of the rear side. All figures integrate a variety of information including the A-scan signal at selected position, B-scan images of horizontal and vertical cross-sections, and a locally enlarged view of the C-scan reflection image of the rear side. Figure 13A and Supplementary Figures S1, S2 are the images for the Al foil on the anode surface and the Cu and Al foils on the cathode surface, respectively. Unlike the transmission images, the reflection images of these three locations are unable to satisfactorily display the contours of the defects due to an insignificant difference between them and the surrounding defect-free areas (as reflected by the A-scan signal in the upper left corner of each figure). The A-scan signal from each of the three locations can be found to have a relatively complete reflection waveform, followed by a small derivative wave. The frontmost ends of the two waves (as indicated by the dotted yellow lines in Figure 13A represent the reflection behavior of the ultrasonic wave upon reaching the front and rear sides of the battery. The difference (approximately 4 µs) between the TOFs at the two points corresponding to the frontmost ends of the two waves is twice time during the sound wave pass through the whole thickness of the battery. The signals from the inside of the battery can be considered to be distributed between these two points. It should be noted that B-scan image are mapped to the amplitude of B-scan waveform, it is not related to each layer of battery structure unless the wavelength is less than the half thickness of the material layer. The horizontal and vertical B-scan of each of these three locations are continuous with no faults or dislocations. The presence of defects at these locations cannot be completely determined based on image recognition or signal differences. Similar to the conclusion derived from the analysis of the transmitted signals, the Al foil (the thicker of the two implanted thin metal layers) did not significantly reflect the sound wave, regardless of its location (on the cathode or anode surface).
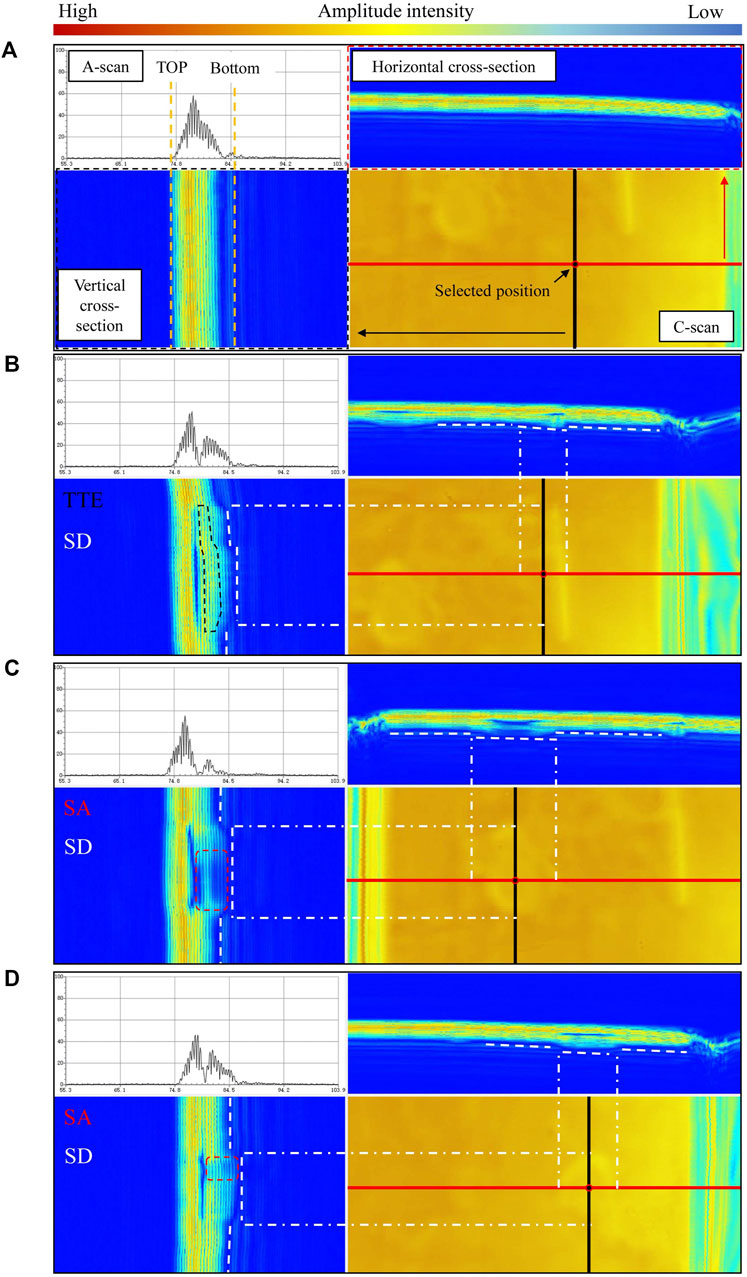
FIGURE 13. Comprehensive reflection images of rear side for defects (images for Cu and Al foils on cathode surface can be found in Supplementary Material).
However, the ultrasonic B-scan images show notable characteristics of the Cu-foil defects at the anode side as well as the Cu-powder defects at the cathode and anode sides. Figure 13B shows the comprehensive image of Cu foil at the anode side. Compared to the Cu foil on the cathode surface, there is a notable blue strip in each of the horizontal and vertical B-scan images of the Cu foil at the anode side, suggesting that the sound waves encountered an obstruction when propagating in this area, and their amplitude decreased. After passing through the defect, the sound waves regained their amplitude (the dotted black area) and continued to pass through the rest of the structure. This is a typical through-transmission enhancement (TTE) phenomenon, suggesting that the defect did not absorb the sound waves and had a relatively small thickness and a relatively high density.
Figures 13C,D show comprehensive images of the Cu-powder defects on the cathode and anode surfaces, respectively. Compared to the other types of defects, changes due to the Cu powder are the most notable in the B-scan images. 1) There is a relatively large blue area corresponding to the Cu-powder area on each of the cathode and anode surfaces. In particular, the blue areas in the center of the anode surface and the upper part of the cathode surface are both relatively thick, which is very similar to the distribution of the actual thickness determined after the disassembling of the battery (as shown in Figure 6), suggesting that the thickness of each blue area is directly proportional to the actual thickness of the corresponding defect and that the Cu powder had a much more significant impact on the sound waves than the Cu foil. 2) In contrast to the Cu-foil-induced TTE, the completion of the passage of the sound waves through the Cu powder is followed by the appearance of a large lower-amplitude area (indicated by the dotted orange box) and nearly complete disappearance of the right-side boundary in those B-scan images. This is a typical shadowing artifact (SA) phenomenon. The principle of formation of shadowing artifacts is similar to the principle by which ultrasound is employed to detect gallstones in the medical detection. On the whole, each Cu-powder defect can be viewed as a porous material with a relatively loose structure. The sound waves are reflected and scatter multiple times in the pores of each Cu-powder defect, resulting in energy loss. This is the reason that more severe shadowing artifacts can be seen in the B-scan images after the passage of the sound waves through the Cu powder. 3) In addition to the notable difference in the color between the defect and the background, a boundary fault (indicated by the dotted white line) appears in each B-scan image. This is a speed displacement (SD) phenomenon, suggesting a relatively considerable difference between the sound speeds in the defect and the surrounding structural material as well as a delay in the remaining reflection response of the sound waves in the thickness direction upon an encounter with an obstruction during propagation. The white dash dot lines in Figure 13 signify the endpoints of the fault in each of the horizontal and vertical B-scan images, which are highly coincident with the external contours of the defect and the junctions of the cross-section lines in the C-scan. Therefore, the actual dimensions of the defect below the cross-section can be basically determined based on the fault at the bottom of each B-scan image. This result, together with the thickness information for the blue area related to the defect, can be used to further evaluate the three-dimensional morphology of the defect.
In this study, an ultrasonic NDT technique was used for the first time to scan and analyze different types of defects inside a battery. In the experiment, identical Cu and Al foils and Cu powder were implanted onto the cathode and anode material surfaces. Subsequently, transmitted and reflected signals from all the defect areas were obtained using a noncontact method. In addition, C-scans and tomographic images were produced to facilitate detailed analysis. The experimental results show that sound waves are highly sensitive to different material properties. Different signals appear immediately in response to the emergence of a material different from that of the rest of the structure. This is an effective test method for studying problems related to batteries such as internal defects and distribution consistency. The conclusions of this study can be summarized as follows.
1) The C-scans produced based on the highest and second-highest peaks of the main wave of the transmitted signal are the clearest of all the ultrasonic images and most satisfactorily visualize the locations and morphologies of the defects. For areas with relatively low color contrast and uncertainties, tomographic images at different depths can be produced based on the first derivative wave to determine whether the contrast increases and to further judge the preliminarily determined defects.
2) The total transmitted signal energy represents the transmittance of the sound wave along the propagation path, which is related to the difference between the acoustic impedances of the defects and the active material. It was found in the experiment that the transmittance of the ultrasonic waves at the Al foils on both the cathode and anode surfaces remained relatively high, resulting in a decrease in the effectiveness of the ultrasonic waves for detecting the Al foils. The defects on the anode surface caused a more significant decrease in the transmittance and, consequently, could be more easily detected by the ultrasonic waves. The defects composed of Cu powder had a loose, porous structure and significantly consumed the sound-wave energy. As a result, of all the defects, the sound waves were the most effective in detecting the Cu powder. The experimental results confirm that the ultrasonic waves were able to detect Cu foil with a thickness ratio of approximately 6.25‰ (on anode surface) and Cu powder with a thickness ratio of approximately 1.25% (on both cathode and anode surfaces).
3) A reflected signal corresponds to a return process inside a battery. For a battery (a multilayer structure), defects distant from the probe are interfered with by the diffracted waves generated by other structures along the path. As a result, no effective C-scan reflection images can be generated for defects distant from the probe.
4) The TTE, SA, and SD phenomena that occur after a sound wave passes through a defect can be used to determine the type of the defect and identify its external boundary. The shape of the defect and its thickness distribution can be ultimately effectively determined based on the reflection B-scan and tomographic scan images.
5) The thicknesses of the defects implanted in the battery in this study were much smaller than the wavelength of the ultrasonic waves emitted by the 2.5-MHz probes used for detection. Consequently, signal analysis cannot yield accurate thickness and depth information for these detects. Probes using higher frequencies are required to improve the detection sensitivity.
6) The detection ability of this technology will be restricted by the thickness and structure of the battery. For example, a thicker prismatic battery requires lower frequency sound waves to ensure the penetration. This brings an additional problem is that the ability to detect small defects will reduce. Therefore, we believe that 2.5 MHz focus probe can be used for pouch battery with a thickness of less than 15 mm, and more engineering work is required for calibration and matching.
In the future, frequency-domain analysis of ultrasonic signals will be included to improve the robustness and accuracy of the identification of defects. In addition, we will explore optimal matching ranges for battery thicknesses and ultrasonic probe frequencies, as well as establishing acoustic models for verification. This technique can optimize the battery manufacturing process from an NDT perspective, and it presents both an opportunity and a challenge to UT when extended to the testing of metal powder generated during the commercial battery-manufacturing process.
The original contributions presented in the study are included in the article/Supplementary Material, further inquiries can be directed to the corresponding authors.
MY: Conceptualization, methodology, data curation, writing—original draft; FJ: Conceptualization and supervision; LL: Conceptualization, supervision, resources, project administration; SH: Software, data curation, validation; JR: Project administration and resources; XH: Writing—review and editing. LH: Project administration and resources.
This work was funded by Science and Technology Project of State Grid Cooperation of China (Grant No. 52010119002F); International Science and Technology Cooperation of China under 2019YFE0100200; Collaborative research program from Electricité de France R&D China; National Natural Science Foundation of China under the Grant Nos. 51807108 and 52037006; Beijing Natural Science Foundation under the Grant No. 3212031. Gansu province University Innovation Fund Project of China (Grant No. 2021B-309).
The authors declare that the research was conducted in the absence of any commercial or financial relationships that could be construed as a potential conflict of interest.
The handling editor declared a past co-authorship with the authors LL and XH.
All claims expressed in this article are solely those of the authors and do not necessarily represent those of their affiliated organizations, or those of the publisher, the editors and the reviewers. Any product that may be evaluated in this article, or claim that may be made by its manufacturer, is not guaranteed or endorsed by the publisher.
The Supplementary Material for this article can be found online at: https://www.frontiersin.org/articles/10.3389/fenrg.2021.806929/full#supplementary-material
Bauermann, L. P., Mesquita, L. V., Bischoff, C., Drews, M., Fitz, O., Heuer, A., et al. (2020). Scanning Acoustic Microscopy as a Non-destructive Imaging Tool to Localize Defects inside Battery Cells. J. Power Sourc. Adv. 6, 100035. doi:10.1016/j.powera.2020.100035
Bommier, C., Chang, W., Lu, Y., Yeung, J., Davies, G., Mohr, R., et al. (2020). In Operando Acoustic Detection of Lithium Metal Plating in Commercial LiCoO2/Graphite Pouch Cells. Cel Rep. Phys. Sci. 1 (4), 100035. doi:10.1016/j.xcrp.2020.100035
Cai, Z., Mendoza, S., Goodman, J., McGann, J., Han, B., Sanchez, H., et al. (2020). The Influence of Cycling, Temperature, and Electrode Gapping on the Safety of Prismatic Lithium-Ion Batteries. J. Electrochem. Soc. 167 (16), 160515. doi:10.1149/1945-7111/abcabc
Chang, W., and Steingart, D. (2021). Operando 2D Acoustic Characterization of Lithium-Ion Battery Spatial Dynamics. ACS Energ. Lett. 6 (8), 2960–2968. doi:10.1021/acsenergylett.1c01324
Choi, H., Ham, Y., and Popovics, J. S. (2016). Integrated Visualization for Reinforced concrete Using Ultrasonic Tomography and Image-Based 3-D Reconstruction. Constr. Build. Mater. 123, 384–393. doi:10.1016/j.conbuildmat.2016.07.010
Cordoba-Arenas, A., Onori, S., Guezennec, Y., and Rizzoni, G. (2015). Capacity and Power Fade Cycle-Life Model for Plug-In Hybrid Electric Vehicle Lithium-Ion Battery Cells Containing Blended Spinel and Layered-Oxide Positive Electrodes. J. Power Sourc. 278, 473–483. doi:10.1016/j.jpowsour.2014.12.047
David, L., Ruther, R. E., Mohanty, D., Meyer, H. M., Sheng, Y., Kalnaus, S., et al. (2018). Identifying Degradation Mechanisms in Lithium-Ion Batteries with Coating Defects at the Cathode. Appl. Energ. 231, 446–455. doi:10.1016/j.apenergy.2018.09.073
Davies, G., Knehr, K. W., Van Tassell, B., Hodson, T., Biswas, S., Hsieh, A. G., et al. (2017). State of Charge and State of Health Estimation Using Electrochemical Acoustic Time of Flight Analysis. J. Electrochem. Soc. 164 (12), A2746–A2755. doi:10.1149/2.1411712jes
Deng, Z., Huang, Z., Shen, Y., Huang, Y., Ding, H., Luscombe, A., et al. (2020). Ultrasonic Scanning to Observe Wetting and "Unwetting" in Li-Ion Pouch Cells. Joule 4 (9), 2017–2029. doi:10.1016/j.joule.2020.07.014
Ecker, M., Shafiei Sabet, P., and Sauer, D. U. (2017). Influence of Operational Condition on Lithium Plating for Commercial Lithium-Ion Batteries - Electrochemical Experiments and post-mortem-analysis. Appl. Energ. 206, 934–946. doi:10.1016/j.apenergy.2017.08.034
Feril, L. B., Kondo, T., Zhao, Q.-L., Ogawa, R., Tachibana, K., Kudo, N., et al. (2003). Enhancement of Ultrasound-Induced Apoptosis and Cell Lysis by echo-contrast Agents. Ultrasound Med. Biol. 29 (2), 331–337. doi:10.1016/s0301-5629(02)00700-7
Goh, C. L., Rahim, R. A., Rahiman, H. F., Zhen Cong, T., and Wahad, Y. A. (2017). Simulation and Experimental Study of the Sensor Emitting Frequency for Ultrasonic Tomography System in a Conducting Pipe. Flow Meas. Instrum. 54, 158–171. doi:10.1016/j.flowmeasinst.2017.01.003
Guorong, S., Yaoqian, L., Yan, L., Jie, G., and Cunfu, H. (2019). “Estimating State of Charge of Lithium-Ion Batteries Using Ultrasonic Reflection and Transmission Coefficients by Legendre Orthogonal Polynomial Method,” in 2019 14th IEEE International Conference on Electronic Measurement & Instruments (ICEMI), Changsha, China, November 1–3, 2019.
Han, X., Lu, L., Zheng, Y., Feng, X., Li, Z., Li, J., et al. (2019). A Review on the Key Issues of the Lithium Ion Battery Degradation Among the Whole Life Cycle. eTransportation 1, 100005. doi:10.1016/j.etran.2019.100005
He, T.-M., Zhao, Q., Ha, J., Xia, K., and Grasselli, G. (2018). Understanding Progressive Rock Failure and Associated Seismicity Using Ultrasonic Tomography and Numerical Simulation. Tunnel. Undergr. Space Techn. 81, 26–34. doi:10.1016/j.tust.2018.06.022
Huang, L., Liu, L., Lu, L., Feng, X., Han, X., Li, W., et al. (2021). A Review of the Internal Short Circuit Mechanism in Lithium‐ion Batteries: Inducement, Detection and Prevention. Int. J. Energ. Res 45, 15797–15831. doi:10.1002/er.6920
Jorne, F., Henriques, F. M. A., and Baltazar, L. G. (2014). Evaluation of Consolidation of Grout Injection with Ultrasonic Tomography. Constr. Build. Mater. 66, 494–506. doi:10.1016/j.conbuildmat.2014.05.095
Ladpli, P., Kopsaftopoulos, F., and Chang, F.-K. (2018). Estimating State of Charge and Health of Lithium-Ion Batteries with Guided Waves Using Built-In Piezoelectric Sensors/actuators. J. Power Sourc. 384, 342–354. doi:10.1016/j.jpowsour.2018.02.056
Ladpli, P., Kopsaftopoulos, F., Nardari, R., and Chang, F.-K. (2017). “Battery Charge and Health State Monitoring via Ultrasonic Guided-Wave-Based Methods Using Built-In Piezoelectric Transducers,” in Proceedings of the SPIE 10171, Smart Materials and Nondestructive Evaluation for Energy Systems 2017, Portland, OR, April 19, 2017, Vol. 1017108. doi:10.1117/12.2260107
Li, H., and Zhou, Z. (2019). Numerical Simulation and Experimental Study of Fluid-Solid Coupling-Based Air-Coupled Ultrasonic Detection of Stomata Defect of Lithium-Ion Battery. Sensors 19 (10), 2391. doi:10.3390/s19102391
Li, Q., Hu, M., Chen, Z., Li, C., Zhang, X., Song, Y., et al. (2018). Meta-Analysis: Contrast-Enhanced Ultrasound versus Conventional Ultrasound for Differentiation of Benign and Malignant Breast Lesions. Ultrasound Med. Biol. 44 (5), 919–929. doi:10.1016/j.ultrasmedbio.2018.01.022
Magnier, L., Lecarme, L., Alloin, F., Maire, E., King, A., Bouchet, R., et al. (2021). Tomography Imaging of Lithium Electrodeposits Using Neutron, Synchrotron X-Ray, and Laboratory X-Ray Sources: A Comparison. Front. Energ. Res. 9, 266. doi:10.3389/fenrg.2021.657712
Mohanty, D., Hockaday, E., Li, J., Hensley, D. K., Daniel, C., and Wood, D. L. (2016). Effect of Electrode Manufacturing Defects on Electrochemical Performance of Lithium-Ion Batteries: Cognizance of the Battery Failure Sources. J. Power Sourc. 312, 70–79. doi:10.1016/j.jpowsour.2016.02.007
Ould Ely, T., Kamzabek, D., and Chakraborty, D. (2019). Batteries Safety: Recent Progress and Current Challenges. Front. Energ. Res. 7, 71. doi:10.3389/fenrg.2019.00071
Perlin, L. P., Pinto, R. C. d. A., and Valle, Â. d. (2019). Ultrasonic Tomography in wood with Anisotropy Consideration. Constr. Build. Mater. 229, 116958. doi:10.1016/j.conbuildmat.2019.116958
Rahiman, M. H. F., Rahim, R. A., and Zakaria, Z. (2008). Design and Modelling of Ultrasonic Tomography for Two-Component High-Acoustic Impedance Mixture. Sensors Actuators A: Phys. 147 (2), 409–414. doi:10.1016/j.sna.2008.05.024
Ren, D., Feng, X., Lu, L., He, X., and Ouyang, M. (2019a). Overcharge Behaviors and Failure Mechanism of Lithium-Ion Batteries under Different Test Conditions. Appl. Energ. 250, 323–332. doi:10.1016/j.apenergy.2019.05.015
Ren, D., Hsu, H., Li, R., Feng, X., Guo, D., Han, X., et al. (2019b). A Comparative Investigation of Aging Effects on thermal Runaway Behavior of Lithium-Ion Batteries. eTransportation 2, 100034. doi:10.1016/j.etran.2019.100034
Shi, J., Liu, S., Liu, F., and Xun, G. (2021). Multi-mode Ultrasonic Visualization of Porosity in Composites Using a Focused Transducer with High Sensitivity and Near-Surface Resolution. Composites C: Open Access 4, 100104. doi:10.1016/j.jcomc.2020.100104
Wang, Y., Nie, F., Liu, T., Yang, D., Li, Q., Li, J., et al. (2018). Revised Value of Contrast-Enhanced Ultrasound for Solid Hypo-Echoic Thyroid Nodules Graded with the Thyroid Imaging Reporting and Data System. Ultrasound Med. Biol. 44 (5), 930–940. doi:10.1016/j.ultrasmedbio.2017.12.018
Wang, Z., Yuan, J., Zhu, X., Wang, H., Huang, L., Wang, Y., et al. (2021). Overcharge-to-thermal-runaway Behavior and Safety Assessment of Commercial Lithium-Ion Cells with Different Cathode Materials: A Comparison Study. J. Energ. Chem. 55, 484–498. doi:10.1016/j.jechem.2020.07.028
Wu, Y., Wang, Y., Yung, W. K. C., and Pecht, M. (2019). Ultrasonic Health Monitoring of Lithium-Ion Batteries. Electronics 8 (7), 751. doi:10.3390/electronics8070751
Xiang, L., Wu-Jie, G., Hao, W., and Mei-Zhen, Q. (2017). Research Progress on the Capacity Fading Mechanisms of High-Nickel Ternary Layered Oxide Cathode Materials. J. Inorg. Mater. 32 (2), 113. doi:10.15541/jim20160255
Yi, M., Jiang, F., Lu, L., Ren, J., Jin, M., Yuan, Y., et al. (2021). Estimation of NCM111/graphite Acoustic Properties under Different Lithium Stoichiometry Based on Nondestructive Acoustic In Situ Testing. Int. J. Energ. Res 22. doi:10.1002/er.7336
Zhao, G., Liu, Y., Liu, G., Jiang, S., and Hao, W. (2021). State-of-charge and State-Of-Health Estimation for Lithium-Ion Battery Using the Direct Wave Signals of Guided Wave. J. Energ. Storage 39, 102657. doi:10.1016/j.est.2021.102657
Keywords: lithium-ion battery, ultrasonic, non-destructive testing, material property, battery defect, battery safety
Citation: Yi M, Jiang F, Lu L, Hou S, Ren J, Han X and Huang L (2021) Ultrasonic Tomography Study of Metal Defect Detection in Lithium-Ion Battery. Front. Energy Res. 9:806929. doi: 10.3389/fenrg.2021.806929
Received: 01 November 2021; Accepted: 03 December 2021;
Published: 17 December 2021.
Edited by:
Peifeng Huang, Hunan University, ChinaReviewed by:
Depeng Kong, China University of Petroleum, Huadong, ChinaCopyright © 2021 Yi, Jiang, Lu, Hou, Ren, Han and Huang. This is an open-access article distributed under the terms of the Creative Commons Attribution License (CC BY). The use, distribution or reproduction in other forums is permitted, provided the original author(s) and the copyright owner(s) are credited and that the original publication in this journal is cited, in accordance with accepted academic practice. No use, distribution or reproduction is permitted which does not comply with these terms.
*Correspondence: Fachao Jiang, amZhY2hhb0BjYXUuZWR1LmNu; Languang Lu, bHVsZ0BtYWlsLnRzaW5naHVhLmVkdS5jbg==
Disclaimer: All claims expressed in this article are solely those of the authors and do not necessarily represent those of their affiliated organizations, or those of the publisher, the editors and the reviewers. Any product that may be evaluated in this article or claim that may be made by its manufacturer is not guaranteed or endorsed by the publisher.
Research integrity at Frontiers
Learn more about the work of our research integrity team to safeguard the quality of each article we publish.