 Zhaodong Xie
 Jianzhi Wang
 Guoqin Zhao
- 1School of Economics, Central University of Finance and Economics, Beijing, China
- 2CCCC Asset Management Company Limited, Beijing, China
- 3Research Institute of Finance and Economics, Central University of Finance and Economics, Beijing, China
The unspecified impact of green innovation on corporate financial performance has made some enterprises delay green innovation investment plans, and even abandon green innovation. Mitigating the economic concerns faced in the process of green innovation decision-making is of great significance to accelerate the process of enterprises’ green transformation. Using an unbalanced panel data of Chinese heavy pollution listed companies from 2008-2017, this paper investigates the impact of green innovation on firm value. We further test the likely channels through which green innovation can affect firm value, including the financial flexibility channel and analyst coverage channel. The study finds that: 1) increasing the proportion of green patent applications leads to the devaluation of firm value, but this devaluation effect only occurs in the short term; 2) both financial flexibility and analyst coverage partially mediate the impact of green innovation on firm value; 3) heterogeneity analysis indicates that enterprises can reduce the negative impact of green innovation on firm value by increasing the executive equity incentive and the management-employee pay gap. In addition, as economic policy uncertainty increases from low to high, the negative impact becomes smaller. Our research helps to broaden the cognitive boundaries of the economic impact of green innovation, and assists policymakers and researchers to better grasp the characteristics of green innovation behavior of enterprises in emerging economies. Finally, we provide useful enlightenments for policymakers and business managers to stimulate green innovation in enterprises.
1 Introduction
Since the industrial revolution, the extensive development mode has promoted economic and social growth, but it has also caused overuse of resources and serious environmental pollution (Wang et al., 2021). In the face of this challenge, the concept of green development has become an important guidance for transforming the developing mode (Abbas and Sagsan, 2019). As the driving force of green development, green innovation is the key to curb the trend of ecological environment deterioration and ensure the sustainable development of corporate economic activities.
The factors driving enterprises to engage in green innovation include, but not limited to, environmental regulations, technological capabilities, managerial environmental concern, competitive pressures, and customer green demand (Cai and Li, 2018; Demirel and Kesidou, 2019; Hojnik and Ruzzier, 2016; Liu et al., 2021). Fundamentally, one of the decisive factors is whether the economic return generated from green innovation can offset the cost while improving environmental benefits. However, the unspecified impact of green innovation on corporate financial performance (CFP) has made some enterprises delay green innovation investment plans, and even abandon green innovation (Duque-Grisales et al., 2020). The empirical research on the impact of green innovation on CFP has not yet reached a consensus (Duque-Grisales et al., 2020; Asni and Agustia, 2021).
Taking manufacturing enterprises as research samples, some studies found that green innovation was positively related to CFP (Huang and Li, 2017; Liao, 2018; Lin et al., 2019; Xie et al., 2019). Using a panel data of 642 industrial enterprises in China, Wang et al. (2021) estimated the impact of green innovation on CFP and found that environmental performance and market competitiveness are two important intermediary variables through which green innovation can improve CFP. Farza et al. (2021), using a German firm dataset, demonstrated that environmental innovation can improve resource allocation efficiency and corporate reputation, leading to stronger competitiveness and better financial performance. However, it takes a certain time for innovation output to be fully applied to an enterprise’s production and operation, so its impact on CFP may also lag (Ernst, 2001; Zhang et al., 2019). Using a panel data of 356 multinational companies, Rezende et al. (2019) found that green patents did not improve CFP in the short term, but there was a significant positive relationship between them in the long term. Using Chinese manufacturing enterprise data, Zhang et al. (2019) also obtained similar findings.
The inherent differences between green innovations lead to differences in their impacts on CFP. Using German data, Ghisetti and Rennings (2014) found that green innovations enhancing energy and resource efficiency significantly improved the profitability of enterprises, but this positive impact only existed in the long term. And green innovations serving to reducing negative externalities would damage corporate profitability in the long run. Enterprises’s profitability can hardly benefit from green innovations if they only improve environmental performance but cannot enhance resource efficiency (Rexhaeuser and Rammer, 2014). On the other hand, the economic returns of green innovation are threatened by some unique peculiarities of emerging economies. Using the data of Chinese manufacturing enterprises, Yao et al. (2019) demonstrated that both eco-product and eco-process innovation negatively related to firm value. They pointed out that the obvious disadvantages, such as weak intellectual property rights protection, inadequate trained and qualified personnel, limited environmental knowledge and smaller customer base of eco-products in developing economies weakened the economic benefits of green innovation. The above mixed research conclusions provide impetus for further investigation on the relationship between green innovation and CFP.
There are still two major limitations in the extant literature. First, previous studies mainly used green R&D investment, green patent counts and quantitative indicators constructed by text information to measure green innovation. These indicators measure green innovation from the perspective of absolute value. However, they cannot provide information about changes in the relative importance of green innovation among enterprise innovation activities and the direction of innovation activities. To make up for this deficiency, this paper uses the ratio of the annual number of green patent applications to the total number of patent applications of enterprises in the same year to measure green innovation. The increase of this ratio directly reflects the increase of green innovation output. Further, it shows that the enterprises’ preference to participate in green innovation activities has been strengthened, which also means more attention is paid to green innovation in innovation decision-making.
Second, previous studies have investigated the impact of eco-innovation on CFP from multiple perspectives such as operating efficiency and cost, market share, profit, and return ratio (He et al., 2018). However, as the impacts of eco-innovation are not immediately apparent, the short-term performance indicators can barely capture their long-term impact (Yao et al., 2019). Besides, these performance indicators do not consider the capital market’s response to corporate green innovation. As an important financing place, capital market has a significant impact on the production and operation of enterprises. It notices firms’ behavior to apply green innovation to business operations (Asni and Agustia, 2021). Nishant et al. (2017) found that shareholders would evaluate the impact of green innovation on corporate economic and environmental performance. They used signal theory to demonstrate that green information technology (IT) announcement is an effective signal transmitted to the capital market by enterprises, and proved that green IT announcement will significantly affect stock prices in empirical research. To address the limitations of short-term performance indicators, this paper used firm value to measure the economic impact of green innovation, and Tobin’s q was used as its proxy indicator. Tobin’s q, which takes into account both company operations and investors’ expectations of future growth, is a comprehensive reflection of corporate accounting data and capital market performance. It not only reflects the long-term business performance of enterprises from past to present, but also reflects its market growth. Moreover, compared with profitability indicators such as ROA and ROE, Tobin’s q is not easily manipulated by business managers.
In addition, more research needs to be conducted on enterprises in heavy pollution industries. It is well known that the negative impact of heavy polluting industries on the ecological environment is far greater than that of other industries. Gennaro et al. (2022) conducted an empirical study on population health in the city of Taranto, which has built the largest steel mill in Europe since the 1960s. They found that compared with the surrounding areas, the urban population mortality rate increased remarkably from 2011 to 2020. Specifically, in the three northern neighborhoods of the city (Paolo VI, Tamburi and Citta Vecchia-Borgo), a total of 1,020 excess deaths were recorded from 2011 to 2019 in both males and females. Facing the urgent need to improve the ecological environment, the green innovation of heavy pollution industry has stronger practical value for ecological sustainable development and future economic development. Most of the conclusions from current research are mainly obtained from comprehensive samples covering multiple industries. However, Liu Z. S et al. (2017) calculated the GML (Global Malmquist-Luenberger) index of green technological innovation of 28 manufacturing industries in China from 2003 to 2014, and found that the average index of pollution industries was the lowest, indicating that it has the poorest green innovation ability. The innovation efficiency of the whole heavy pollution industry in China is generally low (Fang et al., 2020), which may be due to the low technological concentration and limited technological innovation ability of the whole industry. Therefore, we believe that the impact of green innovation on CFP will be affected by industry characteristics, and research on heavy pollution industries needs to be strengthened.
To address these research gaps, taking China’s heavy pollution industry enterprises from 2008 to 2017 as the research samples, this paper estimated the impact of green innovation on firm value. Firstly, we used the ratio of the number of green patent applications to the total number of patent applications to measure green innovation, and firm value was proxied by Tobin’s q. Secondly, we further tested the likely channels through which green innovation can affect firm value, including the financial elasticity channel and analyst coverage channel. Lastly, we analyzed how the pay gap between management and ordinary employees, executive equity incentive, and EPU affect the impact of green innovation on firm value. This study can assist in the design of green innovation policies among heavy pollution enterprises. Furthermore, the findings about the impact of green innovation on firm value are also applicable to firms in emerging economies.
Reviewing the latest research related to this paper, we found that, on the one hand, empirical research using firm data from developed countries mostly concluded that green innovation can improve enterprises’ market performance, such as raising the firm value (Farza et al., 2021), reducing the risk of stock price crash (Zaman et al., 2021) and bringing about excess returns to investors (Szutowski, 2021). On the other hand, findings based on emerging economies differ markedly from the foregoing. Using the data of Chinese listed enterprises, Zhang et al. (2020) empirically demonstrated that green innovation promoted the improvement of medium- and high-level firm value, but such effect was very weak when it comes to enterprises with low value. Duque-Grisales et al. (2020) estimated the impact of green innovation on firm value with the dataset of Latin American listed companies, and found that firm value did not benefit from the increase of green innovation. They pointed out that insufficient pressure from environmental regulation, short-term vision of professional managers and corporate culture that discriminates against green innovation hindered enterprises from adopting green innovation. In addition, these studies do not consider the differences in the impact of green innovation on CFP among different industries.
The inconsistent conclusions and limitations in the above literature suggest that more efforts should be made to promote the green innovation activities of enterprises in emerging economies. The contradiction between the prevailing high-emission development mode in emerging economies and the exigent need for sustainable growth remains acute. Stimulating green innovation in enterprises is an important measure to protect the long-term economic interests of these countries and improve the global ecological environment. Over the past few years, Chinese government has devoted painstaking efforts to shift the economic development model to a green one. In 2006, the National Development and Reform Commission issued “Thousand Firms Energy Saving Program” to encourage energy-saving actions in key energy-consuming industries. Five years later, the “Action Plan for Energy Conservation and Low-Carbon for Ten Thousand Firms” was implemented nationwide to further reduce total energy consumption and energy consumption intensity of medium and high energy consuming enterprises. As one of the most active countries to promote green innovation, it is of great significance to study the impact of green innovation on the firm value of heavily polluting enterprises under this background. On the one hand, the research helps to mitigate the economic concerns faced by enterprises in the process of green innovation decision-making, and brings beneficial inspiration to enterprises that are also experiencing green transformation in other emerging economies. On the other hand, previous studies on the relationship between green innovation and CFP paid insufficient attention to emerging markets (Duque-Grisales et al., 2020). The research on heavy pollution enterprises in China is a suitable supplement to the literature, and assist policymakers and researchers to better grasp the characteristics of green innovation behavior of enterprises in emerging economies.
Compared with the existing literature, the possible contributions of this paper are mainly reflected in three aspects: First, when analyzing the impact of green innovation on firm value, we use the proportion of green patents to measure green innovation. This helps to reveal how firm value react to the change of status of green innovation activities in the overall innovation activities, thus broadening the cognitive boundary of the economic impact of green innovation. Second, this paper is the first study to incorporate green innovation, financial flexibility, analyst coverage and firm value into a unified framework for analysis. It enlightens business managers on how to improve the economic benefits of green innovation from both internal and external perspectives. These mechanisms can also be applied to study the impact of other innovation activities on firm value. Third, to the best of our knowledge, this article is the first to propose and empirically examine how management-employee pay gaps and economic policy uncertainty (EPU) affect the impact of green innovation on firm value. It is a useful supplement to the theory of how green innovation affects enterprise value.
The rest of this paper is organized as follows. The following section is a literature review and theoretical assumptions. Section 3 provides a detailed description of the empirical method, data sources, and construction of the key variables. Section 4 presents the empirical results. Section 5 reports the results of robustness tests. The conclusions and policy recommendations are given in Section 6.
2 Literature Review and Hypotheses
Our study is closely related to three streams of literature. The first is concerned with the strategic innovation motivation of Chinese enterprises and the impact of green innovation on firm value. The other two streams of literature relate to potential influencing mechanisms of green innovation affecting firm value.
2.1 Chinese Enterprises’ Strategic Innovation Motivation
Innovation ability is the source of the core competitiveness of enterprises, and innovation output has become the main driving force to promote enterprises’ rapid development and value growth (Sevilir and Xuan, 2012). Empirical evidence suggests a positive relationship between R&D (research and development) expenditure and firm value (Belderbos et al., 2021; Ehie and Olibe, 2010) and firms with strong innovation have higher long-term stock returns (Cohen et al., 2013). However, some scholars question the accuracy and availability of R&D expenditure data (Grassmann and Griliches, 2021; Popp, 2019). R&D expenditure is not an ideal proxy for innovation as it has return uncertainty and cannot provide information related to innovation output. After investigating the relationship between patents and R&D, scholars believe that patent statistics are effective indicators of technological innovation (Acs and Audretsch, 1989; Hall et al., 1986). A prominent advantage of patent data is that it can reflect rich information, such as applicants’ information, technical details, etc. By investigating the relationship between patents and firm value, many studies found that firm value increases with the number of patents owned by a company (Pakes, 1985; Belenzon and Patacconi, 2013; Chen et al., 2019).
However, these studies assumed that every patent was of equal quality, but the patents held by companies show disparities in quality. Low-quality patents contribute little to firm value (Faleye et al., 2014), and their value is unstable (Belenzon and Patacconi, 2013). Low-quality patent applications are easier and have narrow claims that competitors can use to avoid the scope of protection and develop similar products (Dang and Motohashi, 2015). The central government’s innovation catch-up strategy and patent promotion plan have driven China’s patent incentive policies. These policies have encouraged a large volume of low-quality or low-value patent applications, resulting in a decline in the granting rate (Dang and Motohashi, 2015). At the same time, firms have strong strategic motivation for innovation (Li and Zheng, 2016) for two main reasons. First, all provinces in China have implemented incentive policies to encourage patenting activities. Government subsidies reduce the patent filing and/or examination fee, and applicants are not required to return the subsidies even if the examiners reject the patent applications. Second, the promotion of Chinese government officials is closely related to their political achievements. The central government has upgraded the innovation strategy to a national strategy and implemented industrial policies to support firm innovation, thus compelling the inclusion of regional firm innovation ability and output in the political achievement assessment. The average tenure of Chinese municipal officials is 3–4 years. To improve their performance quickly, local governments prefer to support enterprises that generate higher short-term innovation output.1 To meet the political needs of officials and obtain more fiscal subsidies, firms choose to engage in innovation that can produce results in the short term and avoid high-quality innovations with longer input cycles. Although strategic innovation increases the number of patent applications from firms, it ignores patent quality improvement and crowds out firms’ resources for other innovation activities. Tong et al. (2014) found that after China’s second patent law revision, the number of patent applications from state-owned enterprises’ climbed, but the quality decreased. The output of design patents with less difficulty and requiring less time increased significantly. In comparison, there was no remarkable increase in the output of invention patents with more difficulty and requiring more time.
After analyzing the green patent information of China from 1970 to 2018, Hua et al. (2020) found that 93.48% of green technology patents were never cited, indicating that most of them may be of low value. At the same time, Chinese listed companies pay insufficient attention to green patenting activities, and the output and quality of green innovation are low. Based on the analysis of green patent data of listed companies in China’s Shanghai and Shenzhen stock markets, Qi et al. (2018) found that the sample average of the number of granted green patents each year, divided by the number of all patent applications during the year, was only 0.0148. Some scholars have investigated green innovation in China’s heavily polluting industries. Wang and Zhao (2019) found that the number of green patent applications increased more significantly from 2011-2017 than from 2006-2010. The increase came mainly from utility model patents with low value, and the number of more valuable invention patents declined. Duque-Grisales et al. (2020) demonstrated that firms need to fill the gap between their resources and the ability to implement effective green innovation. The lack of innovation resources induces resource competition among departments and teams within firms, which is detrimental to green innovation. However, the environmental investment of heavily polluting listed companies in China is insufficient (Tang and Li, 2012), and the lack of adequate financial resources could restrict the improvement of green patent quality. Using a set of industry-level data from heavily polluting industries, Fang et al. (2020) examined changes in green innovation efficiency from 2004 to 2016. The results indicate that the overall green innovation efficiency of the industry is generally low in China, showing the characteristics of “effective innovation but not green.” Based on the above analysis, we argue that the average quality of green patents of listed companies in China’s heavy polluting industry is low.
2.2 Green Innovation and Firm Value
In essence, green innovation is an important intangible asset that affects the firm value, helping enterprises transform the environmental sustainability goal into a profitable investment opportunity. Griliches (1990) made a pioneering contribution to linking literature on innovation and market value with economic impacts of green innovation. In this framework, the financial market will assign a value to the bundle of an enterprise’s assets, which is equal to the present discounted value of all future cash flows created by its assets. If intangible assets are expected to affect future cash flow, their value should be reflected in the observed market value of the firm (Colombelli et al., 2020). Consistent with this idea, when green innovation is expected to influence the future cash flows of an enterprise by production, management, marketing, reputation and other aspects, it will affect the financial market in evaluating its value.
How to measure green innovation and capture the economic impact of green innovation are two major issues to be solved in the research. Firstly, green patent data are commonly used as the proxy indicator of green innovation in empirical research (Li et al., 2017; Ma et al., 2021; Scarpellini et al., 2019). Enterprises’ patent data directly reflect the achievements of R&D activities and effectively convey information on their innovation output and R&D capabilities to financial markets (Colombelli et al., 2020). Moreover, the green patent ratio may perform better than green patent counts in terms of measuring green innovation. It can effectively eliminate other unobservable factors that stimulate green innovation (Popp, 2002, 2006), such as an innovation subsidy policy. On the other hand, taking green patent applications as an example, the proportion of green patent applications in relation to total patent applications can reflect not only the change of green innovation output, but also the direction of enterprise innovation activities. Secondly, Tobin’s q has been widely used as a proxy indicator of corporate value in empirical research (Yao et al., 2019). It is a comprehensive reflection of corporate accounting data and capital market performance, which effectively takes into account a company’s operations and future growth. Furthermore, compared with financial indicators such as ROE and ROA, Tobin’s q is not easily influenced by manipulation of the management (Srinivasan and Hanssens, 2009).
At present, the relationship between green innovation and corporate financial performance is still inconclusive (Duque-Grisales et al., 2020; Ghisetti and Rennings, 2014). From the perspective of benefits, engaging in green innovation activities compels enterprises to reduce unnecessary resource waste in the production process, promoting resource utilization efficiency. Fujii et al. (2013) and Porter and Linde (1995) demonstrated that the knowledge and human capital accumulated in pollution reduction activities help firms achieve improved production and operation management. Lee and Min (2015) argued that green innovation enables firms to establish long-term competitive advantages and enhance the sustainability of enterprise development. However, green innovation requires firms to invest a lot of resources and bear significant opportunity costs. Green innovation consumes the resources invested in other value-added activities and makes enterprises fall into a relatively disadvantaged position in the market (Zhang et al., 2020). Specifically, green innovation occupies resources used by daily operations or other investment activities (Grassmann and Griliches, 2021), harming existing production and sales (Chen and Ma, 2021). Resources committed to green innovation activities have long and highly uncertain payback (Ortiz-de-Mandojana and Bansal, 2016). Barnea and Rubin (2010) proposed that managers may engage in social responsibility activities to enhance personal reputation, thus damaging stakeholders’ interests. In addition, innovative knowledge has positive externalities (Romer, 1986), which to some extent reduces the economic benefits of green patents to inventors. Considering the quality of green patents from listed companies in China’s heavy pollution industries and the costs and benefits of green innovation, we believe that low-quality green patents cannot fully realize the benefits mentioned in the above research. The economic value created by these patents is minimal and not enough to compensate for the cost of green innovation. Therefore, we propose our first hypothesis:
Hypothesis 1 (H1): Green innovations are negatively related to the firm value of China’s heavy pollution enterprises.
2.3 Mediating Role of Financial Elasticity
Financial flexibility refers to a firm’s ability to promptly obtain or invoke financial resources (used to prevent uncertain events or seize favorable investment opportunities) to maximize the value of enterprises (DeAngelo and DeAngelo, 2007; Gamba and Triantis, 2008). According to pecking order theory, when facing external financing constraints, greater financial flexibility enables firms to seize favorable investment opportunities to create more value for themselves. Gamba and Triantis (2008) theoretically explained that higher financial flexibility helps avoid financial distress and promptly raises funds for value-creating activities. On the other hand, maintaining greater financial flexibility can enhance a firm’s ability to resist risks and reduce the value loss caused by negative event shocks. Arslan-Ayaydin et al. (2014) found that firms with greater financial flexibility effectively alleviated the negative impact of the financial crisis. The value performance of these enterprises was better than those with poor financial flexibility. Based on the above analysis, we expect that green innovation will occupy considerable financial resources and cause a decline in financial elasticity. This will impair firms’ ability to resist risks and force them to abandon some favorable investment opportunities, which is harmful to firm value creation. Therefore, this paper proposes the second hypothesis:
Hypothesis 2 (H2): Financial flexibility mediates the relationship between green innovation and firm value such that: (a) green innovation negatively affects the financial flexibility, and (b) the decline of financial flexibility will lead to the devaluation of firm value.
2.4 Mediating Role of Analyst Coverage
Analysts act as important information intermediaries in the capital market. They interpret the information of listed companies and transmit it to investors, which brings incremental information for decision-making (Lys and Sohn, 1990; Frankel and Li, 2004). Analysts’ judgment could affect investors’ evaluation of enterprise value. Barber and Loeffler (1993) found that the stock recommended by the “dartboard” column in the Wall Street Journal produced an average abnormal short-term return of 2% per day. Womack (1996) demonstrated that on the day before and after the release of the rating report, the abnormal return rate was 4% for stocks whose ratings were upgraded to buy, and the abnormal return rate was −-3.87% for stocks whose ratings were downgraded to sell. The number of analysts tracking firms correlates positively with firm value, and analysts have strong motivation to track high-quality firms (Chung and Jo, 1996). Analyst coverage can improve investors’ perception of firm value, which helps reduce corporate financing constraints. Some studies show that analysts’ information interpretation activities help companies reduce financing costs and expand financing scale (Bowen et al., 2008; Chang et al., 2006).
On the one hand, analyst coverage can inhibit opportunistic management behaviors (Healy and Palepu, 2001), such as illegal disclosure and earnings management (Dyck et al., 2010; Yu, 2008), which could damage firm’s value. On the other hand, analysts and investors pay attention to the firms’ innovation (Guo et al., 2019). Investors are more likely to trust the information provided by analysts when it comes to innovation activities and other matters prone to agency problems (Amir et al., 2003). Ordinary investors have difficulty understanding specialized activities, such as innovation activities (Kelm et al., 1995). Analysts generally have comparative advantages in dealing with such information, and their interpretation of innovation information could affect the market value of firms. Luo et al. (2014) theoretically and empirically demonstrated that analysts’ information interpretation activities played a significant mediating role in the process of IT investment promoting firm value. Considering the previous analysis of green innovation performance of heavily polluting listed companies, we argue that increasing green innovation will reduce the analyst coverage of relevant firms. This occurs because analysts expect that the increase of low-quality green innovation could damage enterprise value. Further, taking into account the previous analysis of the positive relationship between analyst coverage and firm value, we argue that the decline of analyst coverage will lead to the devaluation of firm value. Therefore, this paper proposes the third hypothesis:
Hypothesis 3 (H3): Analyst coverage mediates the relationship between green innovation and firm value such that: (a) green innovation negatively affects the analyst coverage, and (b) the decline of analyst coverage will lead to the devaluation of firm value.
3 Methods and Data
3.1 Model Specification
Based on the unbalanced panel data of China’s A-share listed firms from heavily polluting industries between 2008 and 2017, this paper uses a two-way fixed effect model to examine the impact of green innovation on firm value. The baseline regression model is as follows:
The explanatory variable of the model is the firm value of listed enterprises, denoted as
3.2 Data Sources
We chose the heavy pollution industry as the research object for the reason that it is the government’s key control object in promoting green development. In this case, it could be of great practical significance to study the green transformation of relevant firms. We set the starting year of the sample data as 2008 and the ending year as 2017 for the following two reasons: first, it is because of the availability of data2; second, on January 1, 2018, China officially abolished the emission fee policy that had been running for 38 years and implemented the single-line tax law: Environmental Protection Tax Law of the People’s Republic of China. The new environmental tax law changes “pollution discharge fee” to “environmental tax” and is more stringent than previous environmental regulations regarding collection measures and collection standards. Because of this and to minimize policy impact, the observation ending year is 2017.
In this paper, we match the heavy pollution industries defined by the Guidelines for Environmental Information Disclosure of Listed Companies with the two-digit industry classification codes provided by Guidelines for the Industry Classification of Listed Companies (2012 Revision), and 12 heavy pollution industries are thus determined.3 According to the demands of the study, we firstly excluded listed companies marked as *ST, S, S* ST, ST, SST. These markers are used to warn investors that companies have serious problems, such as significant financial fraud and losses in successive years. Further, the stock prices of such companies are heavily influenced by human manipulation. Secondly, samples with missing major variables. All green patent data of heavy pollution listed companies came from patent information issued by the China National Intellectual Property Administration (CNIPA). The information sources of China’s provincial EPU indexes are the dataset constructed by (Yu et al., 2021).4 The rest of the data came from the WIND Info database and the CSMAR database. To mitigate the concern of outliers, we winsorized the top and bottom 1% of all the continuous variables from their distributions.
3.3 Variable Constructions
3.3.1 Green Innovation
The explanatory variable of this paper is green innovation. From the existing research, scholars mainly use the following three types of indicators to capture green innovation: 1) green patent counts, or the proportion of green patents in relation to total patents (Aguilera-Caracuel and Ortiz-de-Mandojana, 2013; Du et al., 2019; Rezende et al., 2019; Zhang et al., 2019); 2) green R&D investment (Lee and Min, 2015); and 3) quantitative indicators constructed by text information (Xie et al., 2019; Duque-Grisales et al., 2020). Many researchers stipulate that patent data is an effective indicator to measure technological innovation (Scherer, 1983; Hall et al., 1986; Acs and Audretsch, 1989). Patent statistics can provide a wealth of information on innovation output, and the return of R&D investment has great uncertainty (Popp, 2019). Further, patent application data perform better than granted patent data in reflecting a firm’s innovation output level (Ernst, 2001). Patents possibly impact firm performance in the application process, so patent application data will be more stable, reliable, and timely than patent authorization. However, patent authorization needs to detect and pay annual fees, which is vulnerable to bureaucratic factors (Tan et al., 2014). Finally, compared with the indicator of patent counts, using the proportion of green patents can effectively eliminate some unobservable factors affecting enterprise innovation (Popp, 2002, 2006). For example, it may be an innovation subsidy policy, which may also impact firm value. Meanwhile, the latter indicator can also reflect the importance and trend of green innovation in firms’ innovation activities. Therefore, we use the proportion of annual green patent applications in relation to total patent applications in the same year to measure green innovation. Using Zhang et al. (2019) research method, we match the patent classification number (IPC), published by CNIPA, with the green technology patent classification number, defined by the World Intellectual Property Organization, to identify the green patents of listed companies.
3.3.2 Firm Value
The dependent variable is firm value. At present, scholars usually use Tobin’s Q as a proxy for firm value (Lee and Min, 2015; Kim et al., 2021; Tang et al., 2021), which can reflect the market value of enterprises based on stock prices and is difficult for enterprise management to manipulate (Srinivasan and Hanssens, 2009). Consistent with previous studies, we use Tobin’s Q as the proxy variable for firm value. Referring to Kim et al. (2021), Tobin’s Q is constructed as follows:
3.3.3 Mediators
The mediating variables in this paper are financial flexibility and analyst coverage. Financial flexibility is the firm’s ability to obtain and invoke internal and external funds through appropriate financial strategy arrangements (Byoun, 2011). Holding cash, maintaining debt financing ability, and equity financing ability are the main ways to obtain financial flexibility (DeAngelo and DeAngelo, 2007). Based on the above definition, we measure firms’ financial flexibility with the net operating cash flow ratio to total liabilities. Because it reflects the enterprise’ ability to use internal financing to supplement cash reserves and repay debts. The larger the ratio is, the solvency of enterprises will be stronger, helping enterprises to acquire more financial resources by undertaking larger debt financing scale. Referring to (Chung and Jo, 1996; Chang et al., 2006; Yu, 2008), the number of analyst teams tracking the target firm in a year is applied as the measurement of analyst coverage.
3.3.4 Control Variables
To alleviate the bias caused by the unobservable heterogeneity of firms, we controlled for firm-level characteristics when examining green innovation’s impact on firm value. First, we constructed four variables to capture firms’ financial characteristics, including leverage ratio, size, return on assets, and sales growth ratio (Kim et al., 2021; Tang et al., 2021; Liu et al., 2021). The leverage ratio was proxied by the ratio of total liabilities to total assets. We used net return divided by total assets to measure firms’ return on assets and the log value of total assets as a proxy for firm size. The sales growth ratio was calculated as the difference between current operating income and previous year’s revenue, divided by the previous year’s revenue. Second, we controlled for firms’ governance structure characteristics (Chen and Ma, 2021), including ownership concentration, executive shareholding ratio, and the proportion of independent board members in the board. We used the sum of the top five investors’ shareholdings divided by the total number of shares to measure ownership concentration; the shares held by all executives divided by the total shares was the measurement of executive shareholding ratio; we divided the number of independent directors by the total number of corporate board of directors to define the proportion of independent directors. Finally, we incorporated R&D intensity, firm age, and nature of property rights into the set of control variables (Xu et al., 2017; Yu et al., 2021). R&D intensity was the ratio of R&D expenditure divided by operating income, and firm age was the log value of the number of operating years since the firm’s establishment. The nature of property rights was a dummy variable, which had four values corresponding to four types of enterprises: state-owned enterprises for 1, private enterprises for 2, public enterprises and collective enterprises for 3, remaining enterprises for 4. All the definitions of key variables are presented in Table 1.
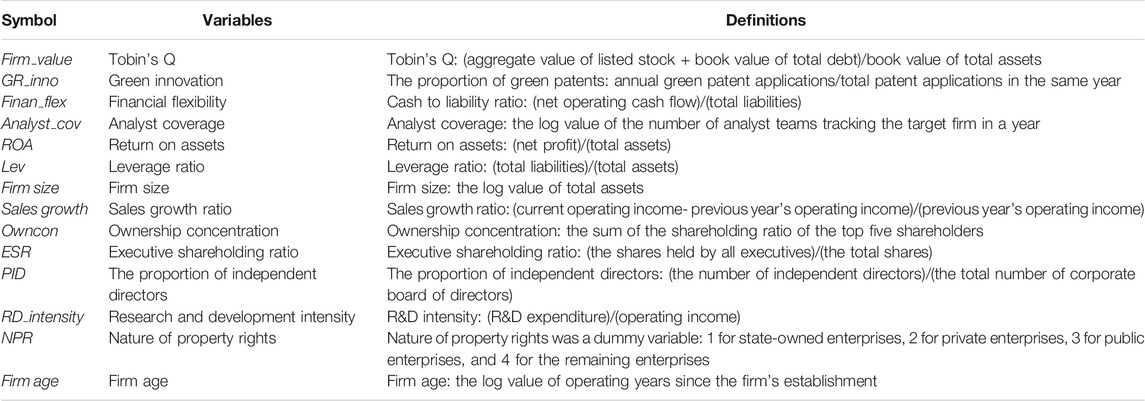
TABLE 1. Variable definitions.
Table 2 reports the descriptive statistical results of the key variables in this paper. The mean and median of
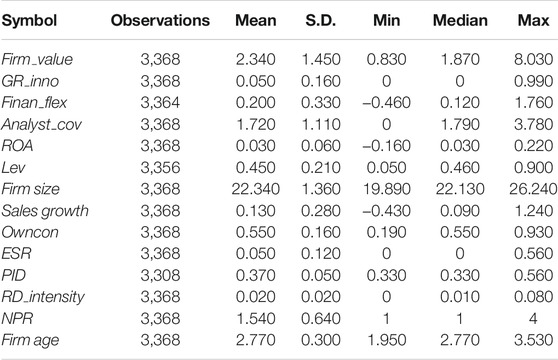
TABLE 2. Descriptive statistics of primary variables.
4 Empirical Results and Analysis
4.1 Baseline Results
Table 3 indicates the effect of green innovation on the firm value of heavy pollution listed enterprises. All models control various fixed effects in the regression and cluster standard errors at the two-digit industry level. Model 1 shows the regression result after controlling financial characteristics and governance structure characteristics. This result shows that an increase in the proportion of green patent applications would lead to a decline in firm value. Model 2 is the baseline regression model of this paper, which further controls R&D intensity, firm age, and the nature of property rights based on Model 1. The regression result from Model 2 is consistent with that of Model 1, suggesting that green innovations have a statistically negative effect on firm value (
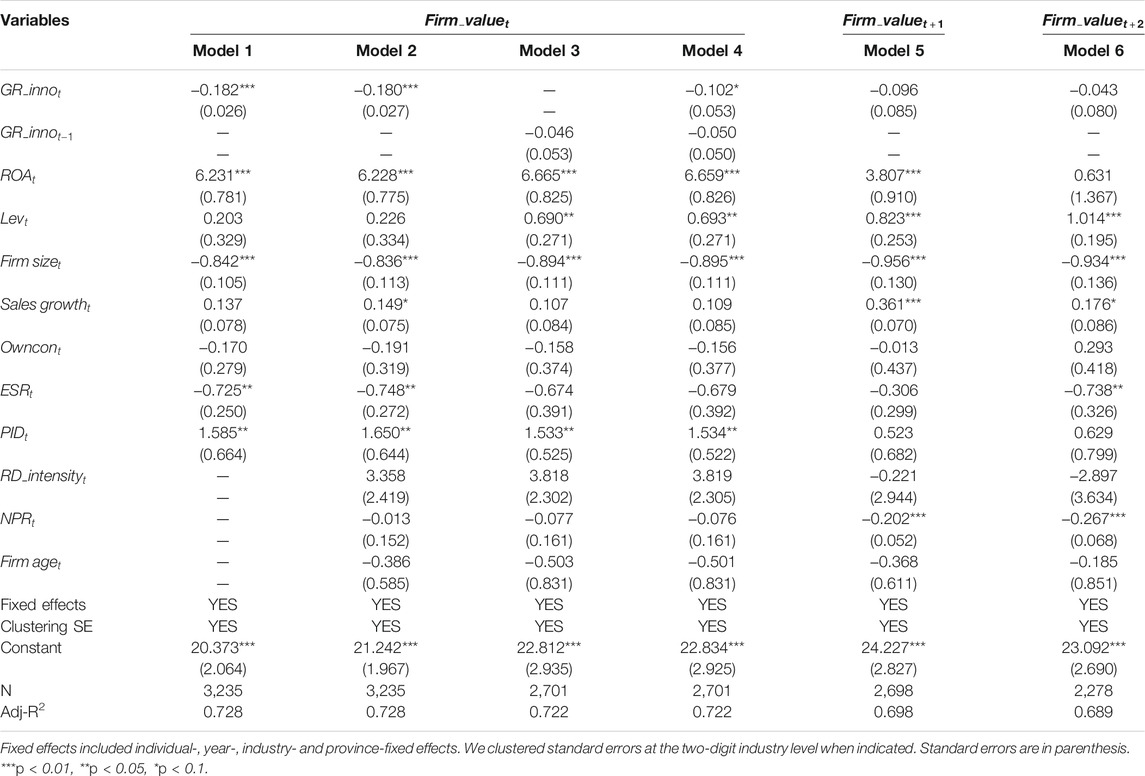
TABLE 3. Effect of green innovation on the firm value of heavy pollution listed enterprises.
To analyze the long-term impact of green innovation on firm value, we first use the baseline regression model to simultaneously investigate the effect of the proportion of green patent applications in year t-1 on
4.2 Mediating Effects
Stepwise regression test proposed by Baron and Kenny (1986) is commonly used to test mediating effect. A simplified model for analyzing the mediating effect is shown by equations 1) - (c). Among them, X, Y and Z are independent variable, dependent variable, and intermediary variable respectively. The first step is to test the total effect of X on Y. The second step is to test the significance of the product of coefficients (H0:
Combined with the hypotheses proposed in this paper, the possible explanations for the negative relationship between green innovation and firm value are as follows: first, green innovation will occupy considerable financial resources of enterprises, resulting in declining financial elasticity. This decline will force firms to abandon some profitable production and investment activities, thus falling into a competitive disadvantage compared to other companies not engaging in green innovation. Second, analysts anticipate that the economic value created by heavy pollution enterprises’ green patents is too low to compensate for the corresponding costs. In this case, the increase of green innovation will make analysts downgrade their evaluations of firm value, thus reducing a firm’s analyst coverage. The decrease in analyst coverage will cause a decline in firm value.
Models 1 and two in Table 4 were mainly used to test whether green innovation could affect firm value through the channel of financial flexibility. In Model 1, we found that green innovation had a significant negative effect on financial flexibility (
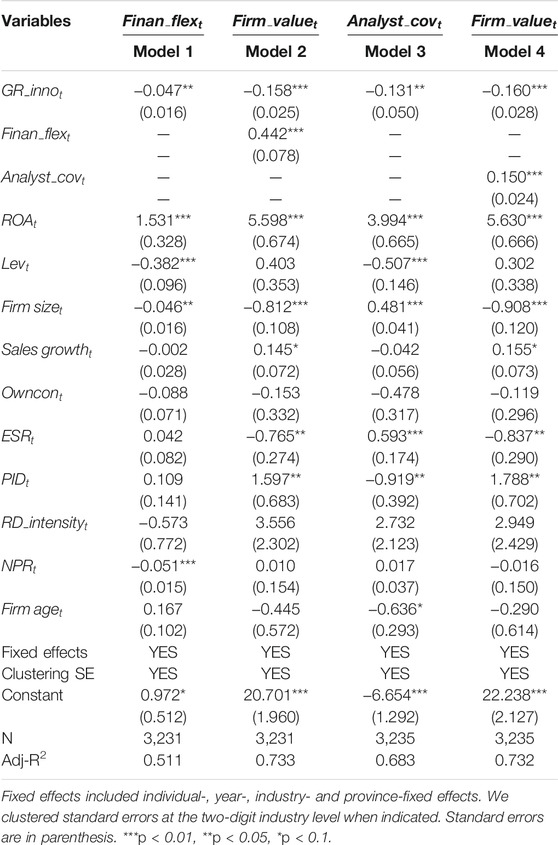
TABLE 4. Mediating effect test.
Models 3 and 4 in Table 4 were mainly used to test whether the green innovation could pass through the channel of analyst coverage to affect firm value. The models show that the impact of green innovation on firms’ analyst coverage was significantly negative at 5%. Meanwhile, the influence of firms’ analyst coverage on the firm value was significantly positive at 1%. This result suggests that the analyst coverage channel is an essential mediation to link green innovation and heavy pollution enterprises’ firm value, thus proving H3.7 In addition, the mediation effect of analyst coverage is 10.9% (−0.131*0.150/(−0.180)), which is slightly smaller than that of financial flexibility.
4.3 Heterogeneous Effects
The above analysis shows that green innovation will cause damage to firm value in the short term, but it is an important way for heavy pollution firms to achieve green transformation. This analysis leads to the following questions: can firms alleviate the short-term negative impact of green innovation on firm value by improving some internal factors? Is there any external environmental factor influencing the relationship between green innovation and firm value?
We propose that providing executives with equity incentives and setting a significant pay gap between management and ordinary employees will improve corporate green innovation activities, helping green innovation create more value for firms. On the one hand, Morck et al. (1988) theoretically explained that equity incentive makes the interests of executives close to that of shareholders, resulting in the convergence effect of interests. Executive equity incentive stimulates executives to optimize the firm’s investment decisions (Steinbach et al., 2017). Zahra et al. (2000) demonstrated that equity incentives play an important role in raising executives’ enthusiasm to participate in firm innovation activities, generating commitment to long-term firm development. On the other hand, according to tournament theory (Lazear and Rosen, 1981; Rosen, 1986), companies can motivate employees by setting up a hierarchy of compensation. Xu et al. (2017) argue that payment at a given level in the organizational hierarchy induces effort from employees at the same and lower levels; he empirically found that to a certain extent, the pay gap driven by management pay premium leads to more innovation output from enterprises. Therefore, we argue that the pay gap will encourage the company-wide dedication to green innovation activities, which helps to improve potential economic value of green patents. In addition, EPU may affect the impact of green innovation on firm value; EPU brings both risks and opportunities. For enterprises to seize potential development opportunities, they are motivated to increase R&D investment and profit from technological innovation (He et al., 2020). According to the growth option theory, the uncertainty caused by environmental policy changes promotes enterprises’ environmental investment decisions to some extent and induces green innovation behaviors (Bloom, 2009). We propose that heavy polluting enterprises in regions with great EPU have stronger motivation to engage in green innovation activities, which may help to enhance the economic value of green innovation.
Next, we introduce the interaction terms between the above heterogeneous factors and green innovation into the baseline model for testing. Referring to (Xu et al., 2017), we measure the pay gap by the ratio of the average executive salary to the average salary of ordinary employees.8Executives’ shareholding ratio is used as the proxy variable for executive equity incentive. Compared with the previous single national index, the China provincial EPU index constructed by Yu et al. (2021) is more effective in capturing the heterogeneity of each province. In this case, the dataset performs better in capturing the EPU in various regions. We matched the administrative division code of the region where the enterprise is located with the administrative division code in the dataset to obtain the provincial EPU. Table 5 presents the results of the heterogeneity analysis. Model 1 shows that the regression coefficients of
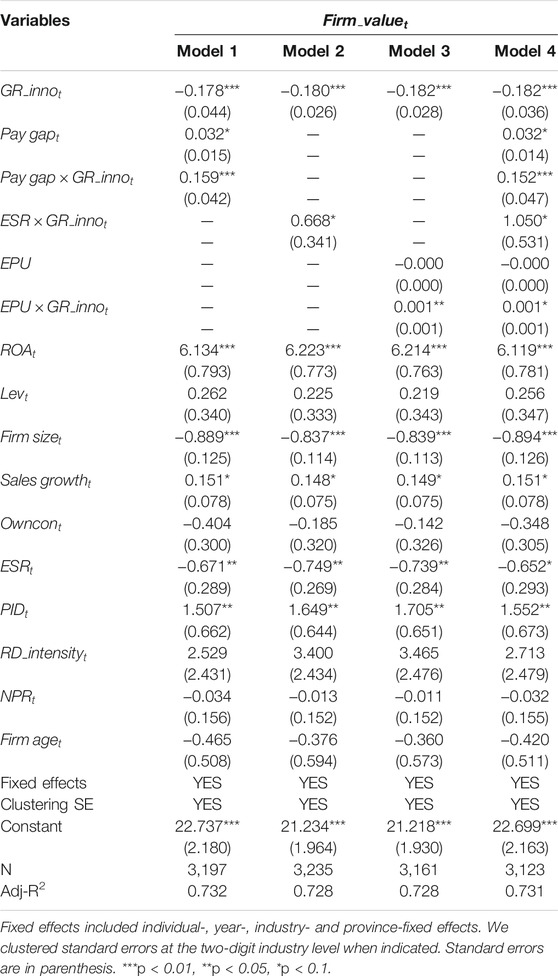
TABLE 5. Heterogeneous effect test.
In Model 2, the coefficients of
The coefficients of
5 Robustness Check
5.1 Endogeneity Problem
We conducted a battery of checks to test the robustness of the above regression results. First, considering the mutual causality between green innovation and firm value, we used the instrument variables and the 2-stage least square method to control for endogeneity in the regression test. On the one hand, we used the proportion of green patent applications at the current period, minus the current year’s mean of the proportion of green patent applications of all enterprises in the same city, as the instrumental variable of
5.2 Sample Excluding Intensive Monitoring Enterprises
We excluded observations from the sample that the government lists as intensive monitoring enterprises.11 Greater regulatory pressure intensifies the operational risks for enterprises, and a heavier pollution reduction burden is detrimental to enterprises’ normal production and operation, thus deteriorating investors’ expectations of these enterprises’ firm value. Therefore, using samples containing these enterprises in regression analysis could cause estimation errors. The regression results of subsamples are shown in Supplementary Tables SA3–SA5. We found that except for the heterogeneous effect of EPU, the findings are consistent with all the empirical findings mentioned before. The possible explanation for the insignificant heterogeneous effect of EPU is that, with the environmental regulations in China being increasingly stringent in recent years, regional EPU has increased the environmental regulation risks facing heavy pollution enterprises. Additionally, intensive monitoring enterprises face greater risks of administrative penalties, such as fines, temporary shutdown, and revocation of the business licenses. Green innovation helps to increase the survival probability of these enterprises, thereby improving analysts’ and investors’ expectations regarding their green patents. In contrast, other heavily polluting enterprises face less regulatory pressure, and EPU has less impact on such enterprises.
5.3 Alternative Variable Measurements
We alter the measurement of some variables. We calculated Tobin’s Q by the ratio of stock market value to total assets. The regression results in Supplementary Tables SA6–SA8 show that the findings are consistent with the empirical results mentioned before. In addition, we measure financial flexibility by the ratio of net operating cash flow to capital expenditure. It directly reflets that whether enterprise’s internal financing can raise funds for other activities under the premise of meeting investment demand. At the same time, analyst coverage is proxied by the number of analyst reports covering enterprises. Supplementary Tables SA9 shows that the mediating effects of financial flexibility and analyst coverage are robust.
6 Conclusions and Policy Recommendations
6.1 Conclusions
This paper investigated the relationship between green innovation and the firm value of heavy pollution listed enterprises in China. Based on the data of China’s A-share heavy pollution listed enterprises from 2008 to 2017, we examined the impact of the proportion of green patent applications on firm value. Further, we examined the influencing mechanisms of green innovation affecting firm value. And we also analyzed how the pay gap between management and ordinary employees, executive equity incentive, and EPU affect the impact of green innovation on firm value. The results indicate that green innovation leads to the devaluation of firm value, but this devaluation effect only occurs in the short term. Additionally, both financial flexibility and analyst coverage partially mediate the impact of green innovation on firm value. Specifically, the increase of green innovation will reduce a firm’s financial flexibility and analyst coverage, thus causing a decline in firm value. This also indicates that analysts could effectively evaluate the green innovation information of heavy pollution listed companies and that these green patents would create very little value for enterprises. Lastly, both increasing executive equity incentives and management-employee pay gap are helpful to mitigate the negative impact of green innovation on firm value. And especially for heavy pollution enterprises in China, the negative impact of green innovation on firm value is smaller when the regional EPU is large.
6.2 Policy Recommendations
These findings have the following implications for corporate managers and policymakers. First, our research reveals a dark side of strategic innovation behavior, that is, pursuing the strategic green innovation policy of increasing patent counts but ignoring their quality improvement could cause damage to firm value. The speculative behavior of strategically engaging in green innovation activities is inadvisable, and the increase of low-quality green patents may lead to the decline in firm value. This suggests that when formulating green innovation policies, corporate managers are encouraged to focus limited financial resources on improving the quality of green patents.
According to the discussion in the literature review, the low-efficiency patent subsidy policy is one of the important factors contributing to the negative correlation between green innovation and enterprise value. Liu et al. (2020) estimated the impact of government subsidies on green innovation based on the data of listed companies in China’s pharmaceutical industry from 2010 to 2015, and found that government subsidies effectively stimulated non-green innovation but did not promote green innovation. The authors provided two explanations: first, the dual externality of green innovation (knowledge externality and environmental externality) weakens its investment attraction, which makes enterprises driven by the motivation of maximizing short-term interests give priority to non-green innovation activities in terms of subsidy allocation. Second, information asymmetry about innovation activities induces enterprises to abuse government subsidies, leading to ineffective subsidy on green innovation (Wang et al., 2017). Therefore, we propose that policymakers should redesign existing green innovation subsidy schemes, guide enterprises to disclose subsidy utilization plans, and provide preferential policies (such as tax exemption and special fund) to enterprises engaging in expected green innovation behaviors.
Second, enterprises can alleviate the negative impact of green innovation on firm value by optimizing internal governance factors, including providing the executives with equity incentives and increase the share of management pay in a firm’s salary payment distribution.
Third, governments should be more cautious about environmental regulation policies, such as green credit policy, which may impede the green development of heavily polluting industries. Our financial flexibility channel analysis suggests that the increase of external financing constraints will further deteriorate the financial flexibility of enterprises, which will, in all likelihood, deepen the negative impact of green innovation on firm value. Since the China Banking Regulatory Commission issued the “Green Credit Guidelines” in 2012, the green credit policy has significantly increased external financing constraints facing six major highly polluting industries, leading to a decline in total investment in these industries (Liu J. Y et al., 2017).12 The financing constraints imposed by the green credit policy on heavily polluting enterprises might force spending cuts on other production and investment activities to finance green innovation. These cuts could lead some heavy pollution enterprises capable of achieving green transformation into the vicious cycle of “green innovation-investment reduction-performance deterioration.”
Data Availability Statement
The original contributions presented in the study are included in the article/Supplementary Material, further inquiries can be directed to the corresponding author.
Author Contributions
ZX: Conceptualization, Methodology, formal analysis, investigation, Data curation, Supervision, Writing—original draft preparation JW: Methodology, Data curation, Writing—review and editing GZ: Investigation, Supervision, Writing—review and editing.
Funding
This research was supported financially by the National Social Science Foundation of China (21BJL011and19CGL048) and the Program for Innovation Research in Central University of Finance and Economics.
Conflict of Interest
Author JW is employed by CCCC Asset Management Company Limited.
The remaining authors declare that the research was conducted in the absence of any commercial or financial relationships that could be construed as a potential conflict of interest.
Publisher’s Note
All claims expressed in this article are solely those of the authors and do not necessarily represent those of their affiliated organizations, or those of the publisher, the editors and the reviewers. Any product that may be evaluated in this article, or claim that may be made by its manufacturer, is not guaranteed or endorsed by the publisher.
Supplementary Material
The Supplementary Material for this article can be found online at: https://www.frontiersin.org/articles/10.3389/fenrg.2021.806926/full#supplementary-material.
Footnotes
1Considering Shleifer and Vishny’s (1994) analysis of the two-way bribery and rent-seeking activities between officials and entrepreneurs, it can be concluded that in order to improve political achievement, officials have the incentive to require firms within the jurisdiction to improve their innovation output in the short term, and in return, officials provide financial subsidies and tax incentives to firms.
2Before 2008, there were few heavily polluting enterprises applying for green patents. However, the average number of green patent applications by the entire heavy pollution industry has increased rapidly since 2008, with more than 900 between 2008 and 2010.
3The 12 heavy pollution industries are as follows: Mining and washing of coal; Extraction of petroleum and natural gas; Mining and processing of ferrous metal ores (Ferrous Metal Ore Mining); Mining and processing of non-ferrous metal ores (Non-Ferrous Metal Ore Mining); Mining and processing of nonmetal ores (Nonmetal minerals mining); Manufacture of beverages (Beverage Manufacturing); Manufacture of paper and paper products (Paper Making and Paper Products Industry); Processing of petroleum, coking, processing of nuclear fuel; Manufacture of chemical raw materials and chemical products; Manufacture of chemical fibers (Chemical Fiber Manufacturing); Smelting and processing of ferrous metals (Ferrous Metal Smelting and Rolling Processing); and Smelting and processing of non-ferrous metals (Non-Ferrous Metal Rolling Processing Industry).
4(dataset) Yu, J., Shi, X., Guo, D., Yang, L., 2021. Economic policy uncertainty (EPU) and firm carbon emissions: Evidence using a China provincial EPU index. https://doi.org/10.1016/j.eneco.2020.105071.
5Considering that enterprise value may be dynamically changing, we used two-step system GMM estimation method to estimate the impact of green innovation on enterprise value. As shown in Supplementary Table SA1, our findings revealed a significant negative effect of green innovation on firm value. Therefore, the conclusion is robust to the alternative regression model.
6We replaced the proxy indicator of financial elasticity with the ratio of net operating cash flow to capital expenditure. The regression results show that the conclusion is consistent with the previous finding. The details are presented in section 5.3.
7We replaced the proxy indicator of analyst coverage with the number of analyst reports tracking an enterprise. The conclusion is robust to the use of alternative indicator in regression. The details are presented in section 5.3 (Alternative variable measurements).
8
9We used Model 2 in Table 5 to conduct the prediction analysis.
10“Guidance on Resolving the Contradictions of Serious Overcapacity” issued by the State Council in 2013 clearly stipulates that overcapacity in steel, cement, electrolytic aluminum and flat glass industries should be actively resolved. In 2014, the Ministry of Industry and Information Technology released a list of industries with severe overcapacity, including ironmaking, steelmaking, coke, ferroalloy, calcium carbide, electrolytic aluminum, copper smelting (containing recycled copper), lead smelting (containing recycled lead), cement (clinker and mill), flat glass, papermaking, leather making, printing and dyeing, chemical fiber, lead battery (plate and assembly) and other industries.
11According to “Measures for self-monitoring and information disclosure of national intensive monitoring enterprises,” after being included in the list of key monitoring enterprises, enterprises need to install an automatic monitoring system. The monitoring station checks the pollution of enterprises every month.
12The six high-pollution industries are thermal power, steel, petrochemical, cement, nonferrous metals, and chemical.
References
Abbas, J., and Sağsan, M. (2019). Impact of Knowledge Management Practices on green Innovation and Corporate Sustainable Development: A Structural Analysis. J. Clean. Prod. 229, 611–620. doi:10.1016/j.jclepro.2019.05.024
Acs, J. Z., and Audretsch, D. B. (1989). Patents as a Measure of Innovative Activity. Kyklos 42, 171–180. doi:10.1111/j.1467-6435.1989.tb00186.x
Aguilera-Caracuel, J., and Ortiz-de-Mandojana, N. (2013). Green Innovation and Financial Performance. Organ. Environ. 26, 365–385. doi:10.1177/1086026613507931
Aiello, F., and Cardamone, P. (2008). R&D Spillovers and Firms' Performance in Italy. Empirical Econ. 34, 143–166. doi:10.1007/s00181-007-0174-x
Amir, E., Lev, B., and Sougiannis, T. (2003). Do financial Analysts Get Intangibles? Eur. Account. Rev. 12, 635–659. doi:10.1080/0963818032000141879
Arslan-Ayaydin, Ö., Florackis, C., and Ozkan, A. (2014). Financial Flexibility, Corporate Investment and Performance: Evidence from Financial Crises. Rev. Quant Finan Acc. 42, 211–250. doi:10.1007/s11156-012-0340-x
Asni, N., and Agustia, D. (2021). The Mediating Role of Financial Performance in the Relationship between green Innovation and Firm Value: Evidence from ASEAN Countries. Ejim ahead-of-print. doi:10.1108/EJIM-11-2020-0459
Barber, B. M., and Loeffler, D. (1993). The "Dartboard" Column: Second-Hand Information and Price Pressure. J. Financial Quant. Anal. 28, 273–284. doi:10.2307/2331290
Barnea, A., and Rubin, A. (2010). Corporate Social Responsibility as a Conflict Between Shareholders. J. Bus. Ethics 97, 71–86. doi:10.1007/s10551-010-0496-z
Baron, R. M., and Kenny, D. A. (1986). The Moderator-Mediator Variable Distinction in Social Psychological Research: Conceptual, Strategic, and Statistical Considerations. J. Personal. Soc. Psychol. 51, 1173–1182. doi:10.1037/0022-3514.51.6.1173
Belderbos, R., Park, J., and Carree, M. (2021). Do R&D Investments in Weak IPR Countries Destroy Market Value? the Role of Internal Linkages. Strat Mgmt J. 42, 1401–1431. doi:10.1002/smj.3268
Belenzon, S., and Patacconi, A. (2013). Innovation and Firm Value: An Investigation of the Changing Role of Patents, 1985-2007. Res. Pol. 42, 1496–1510. doi:10.1016/j.respol.2013.05.001
Bowen, R. M., Chen, X., X., and Cheng, Q. (2008). Analyst Coverage and the Cost of Raising Equity Capital: Evidence from Underpricing of Seasoned Equity Offerings. Contemp. Account. Res. 25, 657–700. doi:10.1506/car.25.3.1
Byoun, S. (2011). Financial Flexibility and Capital Structure Decision. Avaliable online: https://papers.ssrn.com/sol3/papers.cfm?abstract_id=1108850 (accssed on March 20, 2011).
Cai, W., and Li, G. (2018). The Drivers of Eco-Innovation and its Impact on Performance: Evidence from China. J. Clean. Prod. 176, 110–118. doi:10.1016/j.jclepro.2017.12.109
Chang, X., Dasgupta, S., and Hilary, G. (2006). Analyst Coverage and Financing Decisions. J. Financ. 61, 3009–3048. doi:10.1111/j.1540-6261.2006.01010.x
Chen, Y.-S., and Chang, K.-C. (2010). Exploring the Nonlinear Effects of Patent Citations, Patent Share and Relative Patent Position on Market Value in the US Pharmaceutical Industry. Technol. Anal. Strateg. Manage. 22, 153–169. doi:10.1080/09537320903498496
Chen, Y., and Ma, Y. (2021). Does green Investment Improve Energy Firm Performance? Energ. Pol. 153, 112252. doi:10.1016/j.enpol.2021.112252
Chen, Y.-S., Lin, Y.-H., Wu, T.-H., Hung, S.-T., Ting, P.-J. L., and Hsieh, C.-H. (2019). Re-examine the Determinants of Market Value from the Perspectives of Patent Analysis and Patent Litigation. Scientometrics 120, 1–17. doi:10.1007/s11192-019-03119-7
Chung, K. H., and Jo, H. (1996). The Impact of Security Analysts' Monitoring and Marketing Functions on the Market Value of Firms. J. Financial Quant. Anal. 31, 493–512. doi:10.2307/2331357
Cohen, L., Diether, K., and Malloy, C. (2013). Misvaluing Innovation. Rev. Financ. Stud. 26, 635–666. doi:10.1093/rfs/hhs183
Colombelli, A., Ghisetti, C., and Quatraro, F. (2020). Green Technologies and Firms' Market Value: a Micro-econometric Analysis of European Firms. Ind. Corp. Change 29, 855–875. doi:10.1093/icc/dtaa003
Dang, J., and Motohashi, K. (2015). Patent Statistics: A Good Indicator for Innovation in China? Patent Subsidy Program Impacts on Patent Quality. China Econ. Rev. 35, 137–155. doi:10.1016/j.chieco.2015.03.012
DeAngelo, H., and DeAngelo, L. (2007). Capital Structure, Payout Policy, and Financial Flexibility. SSRN Electron. J. Avaliable online: https://papers.ssrn.com/sol3/papers.cfm?abstract_id=916093 (accessed on May 20, 2009).
Demirel, P., and Kesidou, E. (2019). Sustainability‐Oriented Capabilities for Eco‐innovation: Meeting the Regulatory, Technology, and Market Demands. Bus Strat Env. 28, 847–857. doi:10.1002/bse.2286
Du, K., Li, P., and Yan, Z. (2019). Do Green Technology Innovations Contribute to Carbon Dioxide Emission Reduction? Empirical Evidence from Patent Data. Technol. Forecast. Soc. Change 146, 297–303. doi:10.1016/j.techfore.2019.06.010
Duque-Grisales, E., Aguilera-Caracuel, J., Guerrero-Villegas, J., and García-Sánchez, E. (2020). Does green Innovation Affect the Financial Performance of Multilatinas? the Moderating Role of ISO 14001 and R&D Investment. Bus. Strateg. Environ. 29, 3286–3302. doi:10.1002/bse.2572
Dyck, A., Morse, A., and Zingales, L. (2010). Who Blows the Whistle on Corporate Fraud? J. Financ. 65, 2213–2253. doi:10.1111/j.1540-6261.2010.01614.x
Ehie, I. C., and Olibe, K. (2010). The Effect of R&D Investment on Firm Value: An Examination of US Manufacturing and Service Industries. Int. J. Prod. Econ. 128, 127–135. doi:10.1016/j.ijpe.2010.06.005
Ernst, H. (2001). Patent Applications and Subsequent Changes of Performance: Evidence from Time-Series Cross-Section Analyses on the Firm Level. Res. Pol. 30, 143–157. doi:10.1016/s0048-7333(99)00098-0
Faleye, O., Kovacs, T., and Venkateswaran, A. (2014). Do Better-Connected CEOs Innovate More? J. Financ. Quant. Anal. 49, 1201–1225. doi:10.1017/s0022109014000714
Fang, Z., Bai, H., and Bilan, Y. (2020). Evaluation Research of Green Innovation Efficiency in China's Heavy Polluting Industries. Sustainability 12, 146. doi:10.3390/su12010146
Farza, K., Ftiti, Z., Hlioui, Z., Louhichi, W., and Omri, A. (2021). Does it Pay to Go green? the Environmental Innovation Effect on Corporate Financial Performance. J. Environ. Manage. 300, 113695. doi:10.1016/j.jenvman.2021.113695
Frankel, R., and Li, X. (2004). Characteristics of a Firm's Information Environment and the Information Asymmetry between Insiders and Outsiders. J. Account. Econ. 37, 229–259. doi:10.1016/j.jacceco.2003.09.004
Fujii, H., Iwata, K., Kaneko, S., and Managi, S. (2013). Corporate Environmental and Economic Performance of Japanese Manufacturing Firms: Empirical Study for Sustainable Development. Bus. Strat. Env. 22, 187–201. doi:10.1002/bse.1747
Gamba, A., and Triantis, A. (2008). The Value of Financial Flexibility. J. Financ. 63, 2263–2296. doi:10.1111/j.1540-6261.2008.01397.x
Gennaro, V., Cervellera, S., Cusatelli, C., Miani, A., Pesce, F., De Gennaro, G., et al. (2022). Use of Official Municipal Demographics for the Estimation of Mortality in Cities Suffering from Heavy Environmental Pollution: Results of the First Study on All the Neighborhoods of Taranto from 2011 to 2020. Environ. Res. 204, 112007. doi:10.1016/j.envres.2021.112007
Ghisetti, C., and Rennings, K. (2014). Environmental Innovations and Profitability: How Does it Pay to Be green? an Empirical Analysis on the German Innovation Survey. J. Clean. Prod. 75, 106–117. doi:10.1016/j.jclepro.2014.03.097
Grassmann, M. (2021). The Relationship between Corporate Social Responsibility Expenditures and Fi Rm Value: The Moderating Role of Integrated Reporting. J. Clean. Prod. 285, 124840. doi:10.1016/j.jclepro.2020.124840
Griliches, Z. (1990). Patent Statistics as Economic Indicators: A Survey. J. Econ. Lit. 28, 1661–1707. doi:10.1016/j.jclepro.2020.124840
Guo, B., Pérez-Castrillo, D., and Toldrà-Simats, A. (2019). Firms' Innovation Strategy under the Shadow of Analyst Coverage. J. Financial Econ. 131, 456–483. doi:10.1016/j.jfineco.2018.08.005
Hall, B. H., Griliches, Z., and Hausman, J. A. (1986). Patents and R and D: Is There a Lag? Int. Econ. Rev. 27, 265–284. doi:10.2307/2526504
He, F., Miao, X., Wong, C. W. Y., and Lee, S. (2018). Contemporary Corporate Eco-Innovation Research: A Systematic Review. J. Clean. Prod. 174, 502–526. doi:10.1016/j.jclepro.2017.10.314
He, F., Ma, Y., and Zhang, X. (2020). How Does Economic Policy Uncertainty Affect Corporate Innovation?-Evidence from China Listed Companies. Int. Rev. Econ. Finance 67, 225–239. doi:10.1016/j.iref.2020.01.006
Healy, P. M., and Palepu, K. G. (2001). Information Asymmetry, Corporate Disclosure, and the Capital Markets: A Review of the Empirical Disclosure Literature. J. Account. Econ. 31, 405–440. doi:10.1016/s0165-4101(01)00018-0
Hojnik, J., and Ruzzier, M. (2016). The Driving Forces of Process Eco-Innovation and its Impact on Performance: Insights from Slovenia. J. Clean. Prod. 133, 812–825. doi:10.1016/j.jclepro.2016.06.002
Hua, L. L., Zhang, T. J., Wang, J. G., and Liu, Y. Q. (2020). Analysis of Innovation Evolution and Layout Characteristics in Patents for Global green Innovation. J. Ind. Technol. Econ. 38, 149–158. doi:10.19445/j.cnki.15-1103/g3.2020.06.021 (in Chinese).
Huang, J.-W., and Li, Y.-H. (2017). Green Innovation and Performance: The View of Organizational Capability and Social Reciprocity. J. Bus. Ethics 145, 309–324. doi:10.1007/s10551-015-2903-y
Karimi Takalo, S., Sayyadi Tooranloo, H., and Shahabaldini parizi, Z. (2021). Green Innovation: A Systematic Literature Review. J. Clean. Prod. 279, 122474. doi:10.1016/j.jclepro.2020.122474
Kelm, K. M., Narayanan, V. K., and Pinches, G. E. (1995). Shareholder Value Creation during R&D Innovation and Commercialization Stages. Amj 38, 770–786. doi:10.5465/256745
Kim, S., Terlaak, A., and Potoski, M. (2021). Corporate Sustainability and Financial Performance: Collective Reputation as Moderator of the Relationship between Environmental Performance and Firm Market Value. Bus Strat. Env. 30, 1689–1701. doi:10.1002/bse.2702
Lazear, E. P., and Rosen, S. (1981). Rank-Order Tournaments as Optimum Labor Contracts. J. Polit. Economy 89, 841–864. doi:10.1086/261010
Lee, K.-H., and Min, B. (2015). Green R&D for Eco-Innovation and its Impact on Carbon Emissions and Firm Performance. J. Clean. Prod. 108, 534–542. doi:10.1016/j.jclepro.2015.05.114
Li, W. J., and Zheng, M. N. (2016). Is it Substantive Innovation or Strategic Innovation?—Impact of Macroeconomic Policies on Micro-enterprises' Innovation. Econ. Res. J. 51, 60–73. Available at: https://kns.cnki.net/kcms/detail/detail.aspx?FileName=JJYJ201604005&DbName=CJFQ2016 (Accessed April 20, 2016) (in Chinese).
Li, D., Zheng, M., Cao, C., Chen, X., Ren, S., and Huang, M. (2017). The Impact of Legitimacy Pressure and Corporate Profitability on green Innovation: Evidence from China Top 100. J. Clean. Prod. 141, 41–49. doi:10.1016/j.jclepro.2016.08.123
Li, W., Cui, G., and Zheng, M. (2021). Does green Credit Policy Affect Corporate Debt Financing? Evidence from China. Environ. Sci. Pollut. Res. doi:10.1007/s11356-021-16051-2
Liao, Z. (2018). Corporate Culture, Environmental Innovation and Financial Performance. Bus Strat. Env. 27, 1368–1375. doi:10.1002/bse.2186
Lin, W.-L., Cheah, J.-H., Azali, M., Ho, J. A., and Yip, N. (2019). Does Firm Size Matter? Evidence on the Impact of the green Innovation Strategy on Corporate Financial Performance in the Automotive Sector. J. Clean. Prod. 229, 974–988. doi:10.1016/j.jclepro.2019.04.214
Liu, Z., Li, X., Peng, X., and Lee, S. (2020). Green or Nongreen Innovation? Different Strategic Preferences Among Subsidized Enterprises with Different Ownership Types. J. Clean. Prod. 245, 118786. doi:10.1016/j.jclepro.2019.118786
Liu, J.-Y., Xia, Y., Fan, Y., Lin, S.-M., and Wu, J. (2017). Assessment of a green Credit Policy Aimed at Energy-Intensive Industries in China Based on a Financial CGE Model. J. Clean. Prod. 163, 293–302. doi:10.1016/j.jclepro.2015.10.111
Liu, Y., Wang, A., and Wu, Y. (2021). Environmental Regulation and green Innovation: Evidence from China's New Environmental protection Law. J. Clean. Prod. 297, 126698. doi:10.1016/j.jclepro.2021.126698
Liu, Z. S., Song, D. Y., Gong, Y. Y., and Luo, C. J. (2017). Analysis of Industrial Differences and its Influencing Factors of Green Technological Innovation Capability of Chinese Manufacturing Industry. J. Intell. 16, 194–200. doi:10.3969/j.issn.1002-1965.2017.01.033 (in Chinese).
Luo, X., Gu, B., and Zhang, C. (2014). “IT Investments and Firm Stock Market Value: The Mediating Role of Stock Analysts,” in 2014 47th Hawaii International Conference on System Sciences. Editor R. H. Sprague, 4093–4102. doi:10.1109/HICSS.2014.505
Lys, T., and Sohn, S. (1990). The Association between Revisions of Financial Analysts' Earnings Forecasts and Security-price Changes. J. Account. Econ. 13, 341–363. doi:10.1016/0165-4101(90)90009-s
Ma, Y., Zhang, Q., and Yin, Q. (2021). Top Management Team Faultlines, green Technology Innovation and Firm Financial Performance. J. Environ. Manage. 285, 112095. doi:10.1016/j.jenvman.2021.112095
Maurseth, P. B., and Verspagen, B. (2002). Knowledge Spillovers in Europe: A Patent Citations Analysis. Scand. J. Econ. 104, 531–545. doi:10.1111/1467-9442.00300
Morck, R., Shleifer, A., and Vishny, R. W. (1988). Management Ownership and Market Valuation. J. Financial Econ. 20, 293–315. doi:10.1016/0304-405x(88)90048-7
Nishant, R., Teo, T. S. H., Teo, T., and Goh, M. (2017). Do Shareholders Value Green Information Technology Announcements? Jais 18, 542–576. doi:10.17705/1jais.00466
Ortiz-de-Mandojana, N., and Bansal, P. (2016). The Long-Term Benefits of Organizational Resilience through Sustainable Business Practices. Strat. Mgmt. J. 37, 1615–1631. doi:10.1002/smj.2410
Pakes, A. (1985). On Patents, R & D, and the Stock Market Rate of Return. J. Polit. Economy 93, 390–409. doi:10.1086/261305
Peri, G. (2005). Determinants of Knowledge Flows and Their Effect on Innovation. Rev. Econ. Stat. 87, 308–322. doi:10.1162/0034653053970258
Popp, D. (2002). Induced Innovation and Energy Prices. Am. Econ. Rev. 92, 160–180. doi:10.1257/000282802760015658
Popp, D. (2006). International Innovation and Diffusion of Air Pollution Control Technologies: the Effects of NOx and SO2 Regulation in the US, Japan, and Germany. J. Environ. Econ. Manage. 51, 46–71. doi:10.1016/j.jeem.2005.04.006
Popp, D. (2019). International Review of Environmental and Resource Economics. Irere 13, 265–337. doi:10.1561/101.00000111
Porter, M. E., and Linde, C. v. d. (1995). Toward a New Conception of the Environment-Competitiveness Relationship. J. Econ. Perspect. 9, 97–118. doi:10.1257/jep.9.4.97
Qi, S. Z., Lin, C., and Cui, J. B. (2018). Do Environmental Rights Trading Schemes Induce Green Innovation? Evidence from Listed Firms in China. Econ. Res. J. 53, 129–143. Available at: https://kns.cnki.net/kcms/detail/detail.aspx?FileName=JJYJ201812010&DbName=CJFQ2018 (Accessed December 20, 2018) (in Chinese).
Rexhäuser, S., and Rammer, C. (2014). Environmental Innovations and Firm Profitability: Unmasking the Porter Hypothesis. Environ. Resource Econ. 57, 145–167. doi:10.1007/s10640-013-9671-x
Rezende, L. d. A., Bansi, A. C., Alves, M. F. R., and Galina, S. V. R. (2019). Take Your Time: Examining when green Innovation Affects Financial Performance in Multinationals. J. Clean. Prod. 233, 993–1003. doi:10.1016/j.jclepro.2019.06.135
Romer, P. M. (1986). Increasing Returns and Long-Run Growth. J. Polit. Economy 94, 1002–1037. doi:10.1086/261420
Scarpellini, S., Portillo-Tarragona, P., and Marin-Vinuesa, L. M. (2019). Green Patents: a Way to Guide the Eco-Innovation success Process? Arla 32, 225–243. doi:10.1108/arla-07-2017-0233
Scherer, F. M. (1983). The Propensity to Patent. Int. J. Ind. Organ. 1, 107–128. doi:10.1016/0167-7187(83)90026-7
Sevilir, M., and Xuan, T. (2012). Acquiring Innovation. Avaliable Online. Available at: https://www.researchgate.net/publication/256008149_Acquiring_Innovation (accessed on May 24, 2012).
Shleifer, A., and Vishny, R. W. (1994). Politicians and Firms. Q. J. Econ. 109, 995–1025. doi:10.2307/2118354
Srinivasan, S., and Hanssens, D. M. (2009). Marketing and Firm Value: Metrics, Methods, Findings, and Future Directions. J. Marketing Res. 46, 293–312. doi:10.1509/jmkr.46.3.293
Steinbach, A. L., Holcomb, T. R., Holmes, R. M., Devers, C. E., and Cannella, A. A. (2017). Top Management Team Incentive Heterogeneity, Strategic Investment Behavior, and Performance: a Contingency Theory of Incentive Alignment. Strat. Mgmt. J. 38, 1701–1720. doi:10.1002/smj.2628
Szutowski, D. (2021). The Impact of Eco-Innovation on the Stock Returns of Technology-Based KIBS: Role of Eco-Innovation Type and its Degree of novelty. Sampj 12, 130–155. doi:10.1108/sampj-10-2019-0375
Tan, Y., Tian, X., Zhang, C., and Zhao, H. (2014). Privatization and Innovation: Evidence from a Quasi-Natural Experience in China. Avaliable online: https://www.researchgate.net/publication/314895588_Privatization_and_Innovation_Evidence_from_a_Quasi-Natural_Experience_in_China (accessed on January 1, 2014).
Tang, G. P., and Li, L. H. (2012). “Environmental Regulation, Industry Attributes and Corporate Environmental protection Investment,” in Proceedings of 2012 International Annual Conference of Environmental Accounting Committee in ASC & the 1st Chinese CSEAR, GuangZhou, China, 27 December 2012 (Beijing, China: Accounting Society of China).
Tang, T., Zhang, S., and Peng, J. (2021). The Value of Marketing Innovation: Market-Driven versus Market-Driving. J. Business Res. 126, 88–98. doi:10.1016/j.jbusres.2020.12.067
Tong, T. W., He, W., He, Z.-L., and Lu, J. (2014). Patent Regime Shift and Firm Innovation: Evidence from the Second Amendment to China's Patent Law. Amproc 2014, 14174. doi:10.5465/ambpp.2014.14174abstract
Wang, B. B., and Zhao, C. (2019). China's Green Technological Innovation ——Patent Statistics and Influencing Factors. J. Ind. Technol. Econ. 38, 53–66. doi:10.3969/j.issn.1004-910X.2019.07.007 (in Chinese).
Wang, C., Nie, P.-y., Peng, D.-h., and Li, Z.-h. (2017). Green Insurance Subsidy for Promoting Clean Production Innovation. J. Clean. Prod. 148, 111–117. doi:10.1016/j.jclepro.2017.01.145
Wang, M., Li, Y., Li, J., and Wang, Z. (2021). Green Process Innovation, green Product Innovation and its Economic Performance Improvement Paths: A Survey and Structural Model. J. Environ. Manage. 297, 113282. doi:10.1016/j.jenvman.2021.113282
Womack, K. L. (1996). Do Brokerage Analysts' Recommendations Have Investment Value? J. Finance 51, 137–167. doi:10.1111/j.1540-6261.1996.tb05205.x
Xie, X., Huo, J., and Zou, H. (2019). Green Process Innovation, green Product Innovation, and Corporate Financial Performance: A Content Analysis Method. J. Business Res. 101, 697–706. doi:10.1016/j.jbusres.2019.01.010
Xu, M., Kong, G., and Kong, D. (2017). Does Wage justice Hamper Creativity? Pay gap and Firm Innovation in China. China Econ. Rev. 44, 186–202. doi:10.1016/j.chieco.2017.04.003
Yao, Q., Liu, J., Sheng, S., and Fang, H. (2019). Does Eco-Innovation Lift Firm Value? the Contingent Role of Institutions in Emerging Markets. Jbim 34, 1763–1778. doi:10.1108/jbim-06-2018-0201
Yu, J., Shi, X., Guo, D., and Yang, L. (2021). Economic Policy Uncertainty (EPU) and Firm Carbon Emissions: Evidence Using a China Provincial EPU index. Energ. Econ. 94, 105071. doi:10.1016/j.eneco.2020.105071
Yu, F. (2008). Analyst Coverage and Earnings Management. J. Financial Econ. 88, 245–271. doi:10.1016/j.jfineco.2007.05.008
Zahra, S. A., Neubaum, D. O., and Huse, M. (2000). Entrepreneurship in Medium-Size Companies: Exploring the Effects of Ownership and Governance Systems. J. Manage. 26, 947–976. doi:10.1177/014920630002600509
Zaman, R., Atawnah, N., Haseeb, M., Nadeem, M., and Irfan, S. (2021). Does Corporate Eco-Innovation Affect Stock price Crash Risk? Br. Account. Rev. 53, 101031. doi:10.1016/j.bar.2021.101031
Zhang, D., Rong, Z., and Ji, Q. (2019). Green Innovation and Firm Performance: Evidence from Listed Companies in China. Resour. Conserv. Recycl. 144, 48–55. doi:10.1016/j.resconrec.2019.01.023
Zhang, Y., Wei, J., Zhu, Y., and George-Ufot, G. (2020). Untangling the Relationship between Corporate Environmental Performance and Corporate Financial Performance: The Double-Edged Moderating Effects of Environmental Uncertainty. J. Clean. Prod. 263, 121584. doi:10.1016/j.jclepro.2020.121584
APPENDIX 1
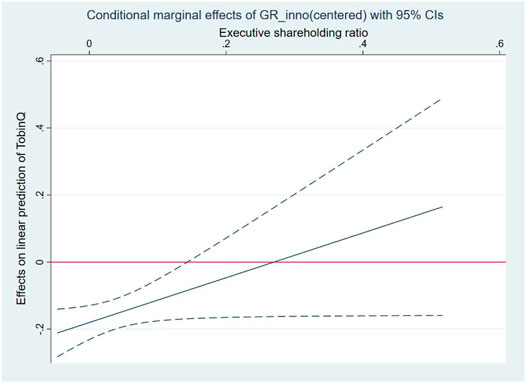
FIGURE 1. The continuous change of marginal effect of green innovation on firm value.
Keywords: green innovation, firm value, financial flexibility, analyst coverage, economic policy uncertainty
Citation: Xie Z, Wang J and Zhao G (2022) Impact of Green Innovation on Firm Value: Evidence From Listed Companies in China’s Heavy Pollution Industries. Front. Energy Res. 9:806926. doi: 10.3389/fenrg.2021.806926
Received: 01 November 2021; Accepted: 28 December 2021;
Published: 20 January 2022.
Edited by:
Xunpeng (Roc) Shi, University of Technology Sydney, AustraliaReviewed by:
Abdul Rashid, International Islamic University, PakistanMuhammad Mohsin, Jiangsu University, China
Shaobo Long, Chongqing University, China
Copyright © 2022 Xie, Wang and Zhao. This is an open-access article distributed under the terms of the Creative Commons Attribution License (CC BY). The use, distribution or reproduction in other forums is permitted, provided the original author(s) and the copyright owner(s) are credited and that the original publication in this journal is cited, in accordance with accepted academic practice. No use, distribution or reproduction is permitted which does not comply with these terms.
*Correspondence: Guoqin Zhao, Ym51emdxQDEyNi5jb20=