 Xiaolei Wang
 Shuang Liang1
95% of researchers rate our articles as excellent or good
Learn more about the work of our research integrity team to safeguard the quality of each article we publish.
Find out more
ORIGINAL RESEARCH article
Front. Energy Res. , 06 January 2022
Sec. Sustainable Energy Systems
Volume 9 - 2021 | https://doi.org/10.3389/fenrg.2021.805224
This article is part of the Research Topic Interactions Between China’s National Emissions Trading Scheme and Electricity Market: Practices and Policies View all 27 articles
Energy intensive industries (EIIs) in China are predominantly reliant on fossil fuels. Consequently, such high fossil fuel dependency has amplified carbon emission levels and blocked the low-carbon transition. It is inappropriate to discuss the solution of the dependency before investigating fossil-fuel price distortion and its impact on the industrial energy consumption. Therefore, this paper built a dynamic trans-log cost function model based on provincial panel data of China’s Ells between 2004 and 2016, to investigate inter-fuel substitution effects caused by own price elasticities and cross price elasticities, and analyzed the impact of fossil-fuel price distortions on low-carbon transition. The level of price distortions in coal, gasoline and diesel was evaluated, based on which the CO2 mitigation potentials in China’s EIIs were estimated. Results show that: 1) in each EII sector, the own price elasticities of all fuels were negative while the cross price elasticities among coal, oil and electricity were positive, suggesting substitution effect exists; 2) the average level of price distortions in coal, gasoline and diesel is 7.48, 11.1 and 32.19%, respectively, which means the prices of coal tend to be more market- oriented than the other two fuels; 3) removing coal price distortions can potentially reduce CO2 emissions in China’s EIIs by 905.78 million tons, while the effects of removing oil price distortions were uncertain, unless the substitution of coal for oil was restrained. Therefore, there is still much room for improvement in China’s fossil-fuel market reform. Possible policies are required to improve the production in EIIs and the low-carbon transition by adopting cleaner energy resources to substitute fossil-fuels.
➢ Focus on the low-carbon transition in China’s energy intensive industries
➢ The degree of fossil-fuel price distortions is estimated
➢ Substitution relationship among energy inputs is analyzed
➢ CO2 mitigation potentials are estimated by removing fossil-fuel price distortions.
Energy Intensive Industries (EIIs) in China have maintained high-speed growth for over 3 decades since China’s reform and opening-up. In 2016, the total industrial value of the EIIs reaches 9,849 billion yuan, 42 times of the level in 1985, which represents one third of the total industrial value of all sectors. In the meanwhile, energy consumption from the EIIs has increased almost 9 times from 222 Mtce in 1985–2158 Mtce in 2016, accounting for 70.0% of energy consumption in all sectors (Figure 1). From the perspective of energy input structure, coal-related fossil-fuels are 71.7% of total energy sources, followed by electricity and oil-related fossil-fuels (Figure 2). The high proportion of fossil-fuels has led to serious environmental issues due to CO2 emissions. According to Wang et al. (2019a), CO2 emitted by China’s EIIs takes up 79.7% of total emissions.
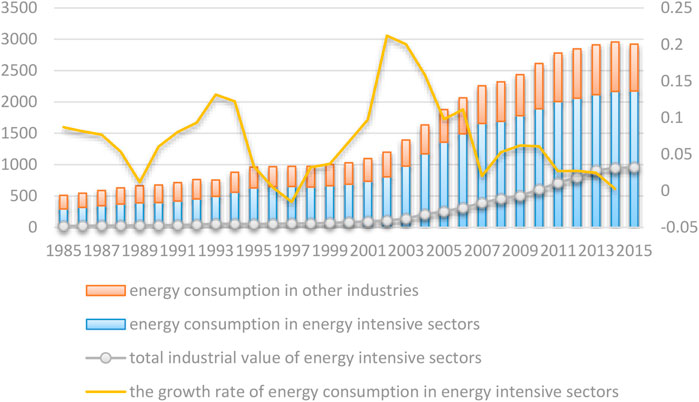
FIGURE 1. Energy consumption and industrial output in China’s EIIs.
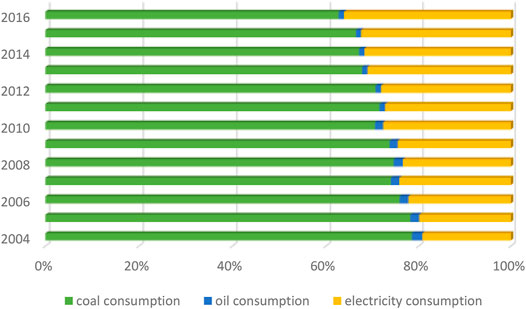
FIGURE 2. Fuel consumption structure in China’s EIIs.
In order to maintain steady economic growth and build a cleaner environment, the policies that aimed at declining the reliance on fossil energy have attracted governments’ attention in recent years. Many studies have focused on the impact of carbon emissions caused by inputting fossil fuels on economic growth. In China, the EIIs, which heavily relies on raw material production and processing, has become one of the key challenges for economic transformation and upgrading. In this context, low-carbon transition of the EIIs is inevitable and of great significance for the sustainable development of China’s economy. On the other hand, environmental issues such as climate warming and frequent haze have forced the industry to make a low-carbon transition. Controlling the fossil-fuel consumption and cutting the pollution emissions of the EIIs have become the key point of China’s industrial low-carbon transition. Chinese government has also put forward a series of goals, such as, controlling the total amount of energy consumption during the 13th 5 years plan, achieving a 15% reduction in energy consumption per unit output value by the end of the 13th 5 years plan, reaching the peak of carbon emissions at around 2030 while striving to reach that peak as early as possible.
However, fossil-fuel price distortions caused by the lag of energy market reform is distorting the relative prices of energy options, leading to excessive use of fossil-fuels and hence hindering the low-carbon transition in China’s EIIs. In China, as energy products are important input factors in the process of China’s economic development, the price of traditional fossil-fuels has been kept at a low level for a very long period (Wang and Tian, 2015; Sun et al., 2016), which has made a large number of outdated capacities that should be phased out still profitable, and thus slowed the low-carbon transition to cleaner energies. The fossil-fuel price distortions will have a negative impact on the low-carbon transition in two ways: firstly, the low cost of fossil-fuels enables the EIIs to gain profits simply by consuming more energy inputs, which inhibits the motivation for long-term profit growth through Research and Development (R&D)and technology investment; Secondly, the low costs of fossil-fuels encourages the EIIs to use more traditional fossil-fuels, which impedes the substitution of clean energies for traditional fuels. Therefore, the distorted fossil-fuel prices have brought about excessive dependence and overuse of traditional energies in China’s EIIs, inhibited the input of other production factors and substitution of clean energies, thus become a barrier to the low-carbon transition.
Therefore, the objectives of the paper are to measure the degree of fossil-fuel price distortions and impact on the low-carbon transition in China’s EIIs. In China, the EIIs are consist of six industries, namely the processing of petroleum, coking and nuclear fuel industry; production and supply of electric and heat power industry; raw chemical materials and chemical products manufacturing industry; non-metallic mineral products manufacturing industry; smelting and pressing of ferrous metals industry; and smelting and pressing of non-ferrous metals industry. The first two industries, both energy industries, are not covered in the paper as they use energy as factor inputs and in the meanwhile produce energy as outputs, and thus the degree of fossil-fuel price distortions which relies on the relationship between the marginal product and price of factor inputs cannot be captured as the price distortions could come from both directions. As a result, this paper focuses on the rest four industries and main contributions include three aspects; 1) The degree of fossil-fuel price distortions is measured; 2) A dynamic economic model is built to study the relationship between energy inputs and the output and analyze fuel substitution effects in China’s EIIs; 3) The impact of fossil-fuel price distortions on carbon emissions and the low-carbon transition is further evaluated.
The structure of this paper is organized as follows: Section 1 introduces energy uses in China’s EIIs and purpose of this study; Section 2 summarizes relevant literature on the topic of energy price distortions and the impact on low-carbon transition; Section 3 presents the methodology adopted and variables and data sources used; Sections 4, 5, elaborate the empirical analysis of China’s EIIs and then conclusions and policy suggestions are made in Section 6.
Energy prices have long been regulated by the government, and thus the marketization degree of energy products remains very low. There are extensive studies that focus on the lagging energy marketization reform and the resulting energy price distortions. Shi and Sun (2017) established a two-sector economic model to demonstrate a negative correlation between price distortions and economic growth caused by China’s energy market regulation. Ouyang et al. (2018) paid attention to regional characteristics of energy market-oriented reforms, and studied the impact of energy price distortions on energy efficiency through analyzing the energy market-oriented reform policies of key cities. Li et al. (2019a) built a model based on the neoclassical growth theory to capture the negative impact of energy price distortions on environmental pollution. Wang et al. (2019b) studied the relationship between oil price distortions and carbon emissions in China’s transport sector. It can be seen from the abovementioned literature that the research on energy price distortions is gradually evolving from national level to industrial and regional level.
From the perspective of quantitative study, most measurements of price distortions in energy market are presented as energy price distortion index. The basic idea of the measurement is first to estimate the marginal output of energy input according to the production function, i.e., evaluate the expected return per unit of energy inputs, and then measure the degree of distortions in energy price by the ratio of the expected return to the actual return per unit of energy inputs. Therefore, the energy price distortion index studied by a large number of literature is, in essence, describing the distortions in the ratio of marginal revenue product (MRP) to energy prices (Shi and Sun, 2017). Besides the energy price distortion index, some others build economic models such as the total cost function and factor share equations to measure the optimal price of factor input, and then compare this optimal price with actual price of energy products to estimate the energy price distortions. For example, Khademvatani and Gordon (2013) used a limited profit function model to measure the shadow price of energy products; Haller and Hyland (2014) and Ouyang and Sun (2015) adopted the translog cost function model to measure the degree of energy price distortions. These measurements reveal the gap between actual price and the optimal price (benchmark price) of energy products.
As fluctuations in energy price have direct impact on the quantity of factor inputs and outputs, the direct prediction of fossil energy consumption was relatively complex and difficult, Manigandan et al. (2021) analyzed the association between many exogenous variables and forecasted the natural gas production and consumption in United States. Many other studies focus on the issue of price elasticity and factor substitution. Berndt and Wood (1975) initially employed energy factor into the trans-log model proposed by Christensen et al. (1973) to estimate the factor substitution effect between energy and capital. Then a large number of literature have studied the factor substitution effect between energy and other input factors, such as Kim and Heo (2013), Haller and Hyland (2014), Adetutu (2014), Sharimakin (2019). As energy inputs are consist of various fuel types, increasing attention has been drawn on discussing both factor substitution (between energy and other input factors) and fuel substitution (between different fuel sources) concurrently, such as Li and Lin (2016), Wang and Lin (2017), Huh et al. (2018), Presley and Lin (2018), Marques et al. (2018), Li et al. (2019b). However, the results obtained by these studies on the relationship between energy and other factors are controversy, with some suggest that energy and capital as well as energy and labor are substitutes, while others argue that both are complements. But when it comes to fuel substitution, most results agree that a substitute relationship exists.
As China’s economy is entering into a “new normal” with a slower growth but increasing focus on the environment, it is critical for the EIIs to shift from an extensive development pattern towards high efficiency and sustainable production. In the aspect of low-carbon transition in the EIIs, existing literature have discussed the influencing factors to a clean development and the potential for energy conservation and emission reduction from different perspectives. For example, from the viewpoint of energy efficiency, Tian and Lin (2018) studied factors influencing energy intensity in China’s EIIs through the index decomposition method (IDA) and production decomposition method (PDA), and their results showed that technology improvement effect is the most important influencing factor to energy intensity; Guo et al. (2018) used data envelopment analysis (DEA) method to measure the total factor energy efficiency of China’s EIIs, and results suggested that strengthening environmental regulation and improving the environmental efficiency of energy consumption are effective ways to achieve sustainable development. With respect to carbon emission performance, Yuan and Zhao (2016) used the input-output decomposition method to analyze the influencing factors of carbon emission in China’s EIIs, and decomposed the changes in carbon emissions into three underlying factors: emission intensity, technology and output demand; Lin and Tan (2017), Du et al. (2018) adopted the logarithmic mean divisia index (LMDI) method and scenario analysis to study influencing factors of carbon emissions and evaluate carbon emission reduction potential in China’s EIIs. In terms of energy conservation and emission reduction management, Li et al. (2014) summarized the economic regulation policies that China’s EIIs are facing; Zha et al. (2017) investigated the energy-saving technologies and the impact of technology guidance policies on energy conservation and emission reduction; Ouyang and Ju (2017) analyzed the management aspect of energy conservation and emission reduction in China’s EIIs.
The above-mentioned literature has studies the clean growth of China’s EIIs from different aspects and stressed the inevitability of a low-carbon transition. However, one of the most important problems faced by the EIIs, which is the distortions in energy prices, has not been discussed sufficiently. Therefore, this paper focuses on how the energy price distortions affect input factors and productivity thus hamper the low-carbon transition in China’s EIIs.
China’s EIIs are characterized by high energy inputs and carbon emissions, partly because of that the prices of fossil-fuels in China have long been regulated at a very low level. In this paper, a production function model is built to reflect the impacts of energy price fluctuations on input-output relationship in the production process. In China’s EIIs, essential input factors are capital, labor and energy sources; while energy inputs are consist of various fuel types, mainly coal-related fuels (co), oil-gas fuels (og) and electricity (el). Therefore, the production function can be expressed as Eq. 1. Where, co refers to coal related fuels including raw coal, cleaned coal and coke; og represents oil fuels including gasoline, diesel and kerosene and natural gas. Similar as Yang et al. (2014) and Li and Sun (2018), natural gas is merged with oil fuels due to its small percentage in total energy inputs. In China’s EIIs, coal-related fuels are the dominant type of energy sources, which account for around 70% of total energy inputs.
In order to analyze the impacts of input factor prices on input-output relationship, we further derive the cost function from the production function, with the assumption that output is exogenous. In order to avoid constant elasticity of substitution, with refer to Berndt and Wood (Chen et al., 2019), Ma et al. (Zheng et al., 2020), and Wang et al. (Niu et al., 2021), a trans-log cost function is adopted to analyze the energy price elasticity.
The cost function Eq. 2 satisfies the assumptions of non-neutral technical progress and non-constant returns to scale. In the meanwhile, it also satisfies the adding up, homogeneous and symmetric restrictive conditions as described in .
Obtained from the Shephard lemma, the factor share function of capital, labor and energy can be written as Eq. 4, Which can reflect the relationship between factor prices and factor inputs. It is noteworthy that the sum of all factor shares is equal to 1, therefore, we have to drop one equation to avoid the singularity when doing the estimation.
Then we turn to consider separating energy inputs into three different types (coal, oil-gas and electricity). With the assumption of constant returns to scale, the total energy price function (in Eq. 5) that derived from the trans-log energy cost function, can reflect the relationship between total energy price (
Based on Eq. 5, the cost share equation for coal, oil-gas and electricity can then be written as.
According to Eq. 6, the cost share for each type of fuel input can be estimated, thus by adding them together the cost share for total energy inputs can be obtained. However, it is worth noting that there could be hysteretic effect in economic variables such as investment and output. Therefore, we further bring the hysteretic variables in the model to reflect actual production process. By adding lagged variables of cost share (
The above-mentioned equations enable quantitative analysis on the relationship between the relative prices of and the relative quantities of the factor inputs. Then Eq. 9 is used to estimate price elasticities of different inputs.
Where
Where
In this paper, we adopt China’s provincial panel data of 30 provinces (or cities) over 2004–2016 since the data for Xizang is not available. As mentioned in Section 1, data in the four EIIs are taken into account, i.e., 1) raw chemical materials and chemical products manufacturing industry (chemical industry); 2) non-metallic mineral products manufacturing industry (non-metallic industry); 3) smelting and pressing of ferrous metals industry (ferrous metals industry); and 4) smelting and pressing of non-ferrous metals industry (non-ferrous metals industry). Data on industrial output, input and the price of each input factor in the four EIIs are essential for the model built in the paper.
For inputs and outputs, data are obtained from CEIC (2018) database and statistical yearbook of each province. These data are collected sector by sector, and then summed up to represent the EIIs in China.
Data on industrial output of the EIIs can be obtained directly from the statistical yearbooks of these provinces, which are then converted into the 2004 price level by deflating industrial product price index. The variable of “gross industrial value” is used to represent output, as “industrial value added” is not available in China’s EIIs.
With regards to industrial factor inputs, data on EIIs are also available from the statistical yearbook of each province. The indicator of numbers of employees in each EII is used to represent labor input in the industry. As there is no statistical data on capital stock in China, the capital stock of each industrial sector is calculated by the perpetual inventory method (PIM) as
Data on fuel input prices in the provincial EIIs come from the CEIC (2018) database. As coal prices are not available at provincial level, the transaction prices for clean coal in the capital city is regarded as the coal prices for each province. For oil prices, as gasoline and diesel are the main oil inputs, the weighted average prices of gasoline and diesel in the capital city is used to reflect changes in oil prices. For electricity prices, the indicator of “electricity price for industry and commerce” is used. Based on the abovementioned data sources for each type of fuel, the weighted average sum of coal prices, oil prices and electricity prices is calculated, and used to represent the total energy price. For the price of labor input, we adopted the indicator of “average real wages” in each province. The real capital price is represented by the real interest rate, which is calculated as
Based on the model built in Section 3, the relationship between fuel price and fuel inputs in the EIIs is analyzed. Coefficients are estimated by the seemingly unrelated regression (SUR). The labor share equation (SL) and coal share equation (Sco) are dropped when conducting the SUR of factor share function and fuel share function, to avoid the singularity as mentioned in Section 3. The model results shown in Table 1 suggest all coefficients are significant. The conventional R2 for the energy share, capital share, oil share and electricity share equations are 94, 90, 97, and 92%, respective, which suggests very small differences between the observed data and the fitted values. In addition, the sign of each regression coefficient (either positive or negative), which shows the direction of the correlation for each variable, can be interpreted very well.
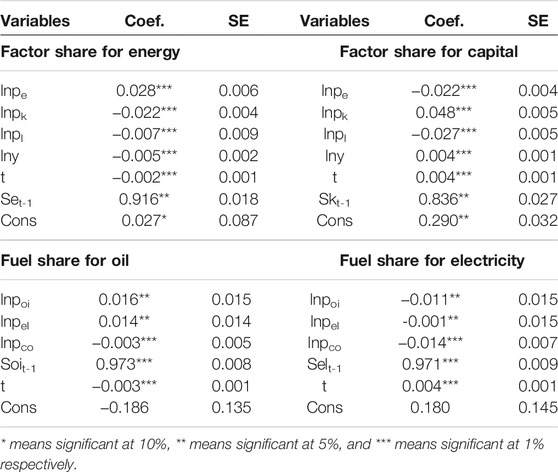
TABLE 1. The estimating results in factor and fuel share equations in the EIIs.
As shown in Table 1, the factor share was positively correlated with its own price and negatively correlated with other factor prices, while the relationship of fossil-fuel input was not obvious, and the hysteretic variable showed a great positive impact on both factor and fossil fuel share. Then, the own price elasticities and cross price elasticities of fuel input can be calculated through Eqs 9, 10, and results show that the cost share for coal products, oil-gas products and electricity is 0.34, 0.26, and 0.39 respectively. The cost share of coal obtained in this study is a bit smaller, compared to 0.47 estimated by Li and Lin (2016) for the manufacturing sectors and 0.55 evaluated by Li and Sun (2018) for all sectors. But the differences in cost share of coal are mainly due to the different industrial sectors analyzed and different study periods chosen. In addition, considering the large share of coal products in total inputs (70% as abovementioned), the cost share of coal is much smaller, due to the fact that coal products are generally much cheaper than oil products and electricity when converting them into the same unit (Mtce).
As shown in Table 2, the substitutability and complementarity between fuel inputs are affected by the price elasticities. Results show that:1) Firstly, the own price elasticities of all fuel inputs are negative, suggesting that whenever the price of a fuel type rises, and demand for that type of fuel decreases. This finding of negative own price elasticities is accordance with the economic theory. For China’s EIIs, the absolute value of own price elasticity of coal (ηco-co = −0.480) is smaller than that of oil-gas (−0.673) and electricity (−0.609), which means that coal shows higher price rigidity than the other two fuel inputs, reflecting the production reality of China’s EIIs. Over the research period, although the overall proportion of coal input is decreasing, the average coal input is still over 50% of total energy inputs. 2) Secondly, the cross price elasticities among coal, oil and electricity are positive, which means that these energy inputs show substitute relationships. The substitute relationships among different fuel inputs have strong policy implications: the pricing mechanism of the fossil-fuels can affect the fuel demands. As China’s EIIs is facing strong pressure for a low-carbon transition, fossil-fuels should be substituted by cleaner energy (such as solar power, hydropower, and nuclear power) to reach the goal of mitigating carbon emissions.
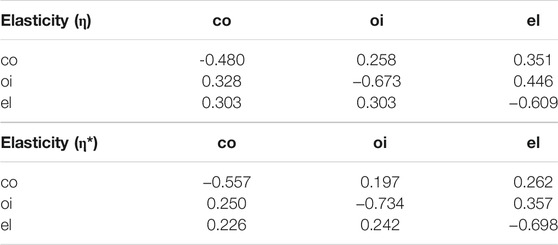
TABLE 2. The estimating fuel price elasticities in China’s EIIs.
To analyze the relationship between fuel price and fuel demand in specific energy intensive sectors, the fuel substitution elasticities of the four EII sectors are further estimated by SUR method, with results shown in Table 3.
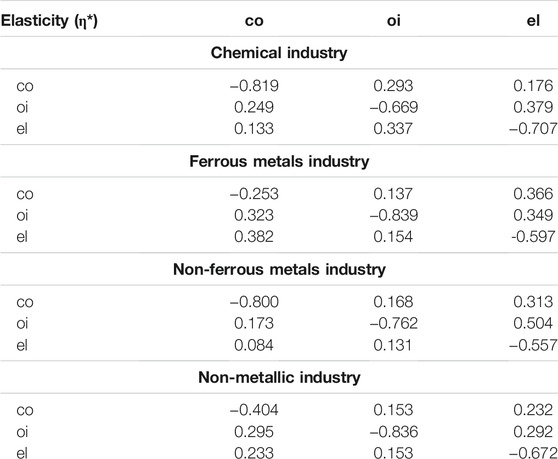
TABLE 3. The estimating fuel price elasticities in four energy intensive sectors.
As can be seen in Table 3, similar to the results for the whole EIIs, the own price elasticities of fuels are all negative, while the cross price elasticities are all positive in each of the EII sectors. However, it is noteworthy that the absolute value of own price elasticities of coal in the ferrous metals industry (η*co-co = −0.253) and the non-metallic industry (η*co-co = −0.404) are relatively small. The reason was directly correlated with the production process of the two sectors. It implies the demands for coal in these two sectors are relatively inelastic, as a result, coal price changes will not affect the demands for coal much in these two sectors. Therefore, rather than focusing on pricing mechanism, other methods such as technical progress and energy conservation management, may be more effective for the controlling of CO2 emissions in these two sectors. In the meanwhile, the cross price elasticities are quite different in these EII sectors. For example, the substitution elasticities between coal and electricity in the chemical sectors are only 0.176 (coal to electricity) and 0.133 (electricity to coal), which might because of that the equipment and technology constraints have limited the potential fuel substitution. For the ferrous metals industry, results show that it will be easier and more sensible to use electricity to substitute oil rather than substitute coal-related fuels. Some literatures have reached similar conclusions, and electricity substitution is a better option (Chen et al., 2019; Zheng et al., 2020; Niu et al., 2021). Therefore, when evaluating the impact of fossil-fuel price distortions, the differences in substitution elasticities in specific EII sectors should also be considered.
As coal-related fuels and oil-related fuels are the main energy inputs in China’s EIIs, we further analyze the price distortions of fossil-fuels, including coal, gasoline and diesel. According to Ju et al. (2017), the level of price distortion is represented by the price distance between the benchmark price and the end-user price in reality, which can be shown as .
Where PDi is the price distortion of the ith type of fossil-fuels (i = coal, gasoline and diesel), EPi is the end-user price in China under government regulation, and RPi is the reference price which reflects the actual supply-demand conditions in the market. In China’s EIIs, data on end-user fossil-fuel prices are obtained directly from the CEIC database. With regards to the benchmark price for coal, similar to Lin and Jiang (2011), it is obtained by adding the coal prices for Free On Board (FOB) at Qinhuangdao port with average shipping cost. And the benchmark price for oil is evaluated by considering international prices for oil products and transportation cost (Li and Sun, 2018). As energy market in the US is considered to be highly market oriented, we adopt the US price of gasoline and diesel as the international price. These data on fossil-fuel prices are collected and summarized in Table 4, which shows in most years (except coal prices in 2013 and gasoline prices in 2016), the end-user prices of fossil fuels in China were lower than the corresponding benchmark prices, suggesting that the domestic prices of fossil-fuels in China have long been distorted and underestimated.
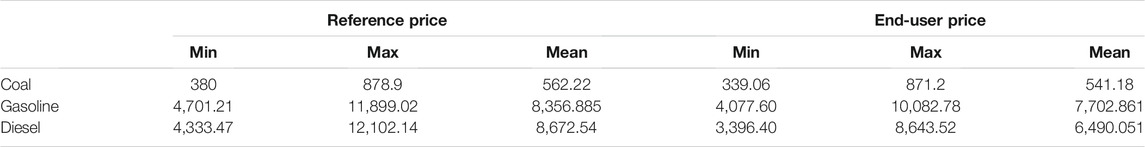
TABLE 4. The benchmark price and end-user price over 2004–2015 (Yuan/Ton).
Based on the price data in Table 4, the level of price distortions in fossil-fuels can be evaluated, and results are shown in Figure 3. For oil price distortions, as the state-controlled pricing mechanism for refined oil in China was experiencing market-oriented reform during the study period, price distortions for both gasoline and diesel saw high volatility. The highest level of price distortions for gasoline and diesel happened in 2012 and 2008, which was 18 and 60.31% respectively. After that, the level of price distortion was diminishing, reflecting that domestic oil prices in China began to be in line with international prices. The fluctuation of coal price distortions was relatively gentle and the average level of price distortions was merely 7.48%. In China’s energy market, the prices of coal tend to be more market oriented, compared to that of oil products. Since 2005, Chinese government started to intervene coal prices. In 2013, the government decided to cancel the double-track coal pricing mechanism and since then coal price was eventually determined by the market. As a result, the price distortions of coal reached its lowest point in 2013 and was almost disappeared.
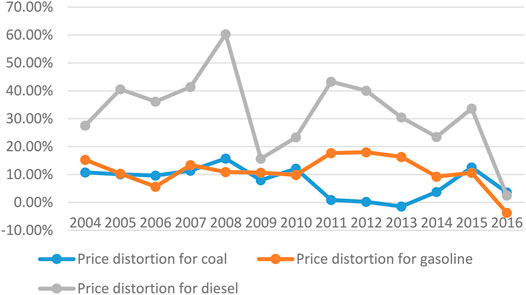
FIGURE 3. The price distortion proportion of fossil-fuels.
China’s EIIs are under great stress to reduce energy consumption and carbon emissions, however, the low-carbon transition is hindered by price distortions in fossil-fuels. The underestimated fossil-fuel prices could encourage the EIIs to use more fossil-fuel inputs and inhabit the market mechanism to be effective. Therefore, removing price distortions in fossil-fuels would be an important approach to promote the low-carbon transition. Based on the abovementioned model results on the level of price distortions and price elasticities for fossil-fuels, we further look into carbon mitigation potential by removing fossil-fuel price distortions.
Assume that the price distortions in fossil-fuels are removed, i.e., the end-user prices are just equal to the benchmark prices, that will promote efforts in controlling carbon emissions through three major approaches. First, the rising fuel prices will have a negative impact on fuel inputs in the production process therefore reduce carbon emissions. Second, increases in fuel prices will encourage substitution effects between energy sources and other input factors, as well as among different fuel forms, depending on their cross-price elasticities. Third, as electricity can be used to substitute fossil-fuels in the EIIs, the accelerated electrification allows renewables to play an important role to further reduce carbon emissions. The total carbon mitigation potential could be calculated by
Where CMPi is the carbon mitigation potential by removing the price distortions in the ith fossil-fuel, Ci is the carbon dioxide emission coefficient, and PDi is the level of price distortions. Based on the price elasticities estimated in Section 4, the carbon mitigation potential of removing coal price distortions and oil price distortions can be calculated, with results shown in Tables 5, 6.
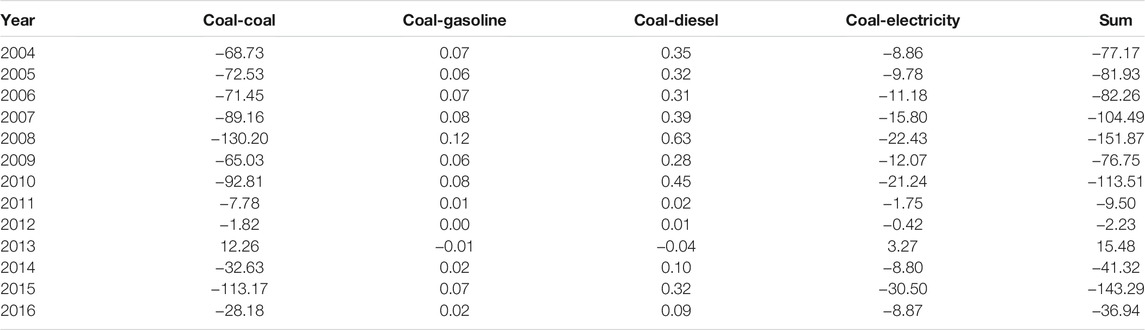
TABLE 5. Carbon mitigation potential by removing coal price distortions (million tons of CO2).

TABLE 6. Carbon mitigation potential by removing oil price distortions (million tons of CO2).
As shown in Table 5, the total carbon mitigation effect of removing coal price distortions is significant, except in 2013, suggesting that the removal of coal price distortions can reduce carbon emissions and promote the sustainable transition. The largest carbon reduction potential recorded in 2007–2008, 2010 and 2015- all above million tons of CO2 reduction-mainly due to the high level of price distortions in these years. At the time of 2011–2012, as the level of coal price distortions in coal was very small (see Figure 3), the carbon mitigation potential was also much lower: 9.5 and 2.23 million tons of CO2 reduction, respectively. Over the years between 2004 and 2016, through removing coal price distortions could have reduced CO2 emissions by 905.78 million tons in China’s EIIs.
For the removal of oil price distortions, it would be a bit different. The shares of gasoline and diesel in total energy inputs in China’s EIIs are quite small, but removing oil price distortions could lead to these small shares of oil products being substituted by large input of coal. And as the carbon emission coefficient of coal is much higher than that of oil, the removal of oil price distortions may not reduce carbon emissions. Take the year of 2004 (in Table 6) for example, the level of price distortions in gasoline and diesel was 15.29 and 27.59%, respectively (see Figure 3). Removing the price distortions of gasoline would cause a decrease in gasoline input due to the own price elasticity and an increase in electricity input due to the cross price elasticity and potentially lead to CO2 emission reduction of 0.38 and 9.26 million tons, respectively. However, it could also contribute to a large increase in coal input and thus put on potential CO2 emissions of 52.49 million tons. Therefore, the combined effect of removing gasoline price distortions could end up increasing CO2 emissions instead. This conclusion is in line with a previous study by Li and Sun (2018), and the combined effect of removing price distortions in fossil fuels in different sectors are sometimes controversy. As a result, it is important for policy makers to consider the prices of coal when removing oil price distortions, and prohibit the substitution using coal products as that will lead to more carbon emissions. With reasonable policies in place, in an effort to promote a low-carbon transition in the EIIs, this paper assumes coal will not be used to substitute oil products, and evaluates the carbon mitigation potential (i.e. considering the oil/electricity substitution only) as the last column in Table 6, which suggest the removal of oil price distortions could have reduced CO2 emissions by 785.68 million tons in China’s EIIs. The resulting mitigation potential was approximately consistent with the emission reduction potential calculated in Takayabu (2020) adopting scenario analysis, which could demonstrate the estimating mitigation potential.
China is entering into the next stage of its structural reforms, featured with a slower growth rate but increasing focus on environment and sustainability. As major carbon emitters, the EIIs are facing great pressure to accelerate the imperative low-carbon transition. Among various of difficulties and barriers, the long been distorted fossil-fuel prices are with no doubt a major one. Therefore, this paper builds a dynamic fuel substitution model to study the impact of the price distortions in fossil-fuels on the low-carbon transition. Based on provincial panel data between 2004 and 2016, this paper evaluates the level of price distortions in China’s EIIs; analyzes the own price elasticities and cross price elasticities among fossil-fuel inputs to understand the impact of changes in fossil-fuel prices; and investigates the carbon mitigation potential through removing price distortions in fossil-fuels. Some interesting conclusions can be drawn from the above analysis.
1) Despite there are quantitative differences in price elasticities in each EII sector, the own price elasticities of fossil-fuel inputs are all negative, suggesting that energy pricing reform in China is an effective way to restrain demands for fossil-fuels. In the meanwhile, the cross price elasticities of fossil-fuel inputs are all positive, implying that a substitute relationship exists among coal, oil and electricity, thus an increase in prices of one fuel type will increase demands for other fuels.
2) Over the research period, positive price distortions in coal and oil products are observed in China’s EIIs, which means that removing the price distortions would lead to an increase in fuel prices. The average level of price distortions in coal, gasoline and diesel is 7.48, 11.1 and 32.19%, respectively. The overall fluctuation in the level of coal price distortions is relatively flat, while that of oil price distortions is quite significant.
3) If coal price distortions were removed, there could be 905.78 million tons of reduction on CO2 emissions in China’s EIIs over 2004–2016. The removal of coal price distortions can affect CO2 mitigation potential through cutting coal input and substituting coal with cleaner fuels including oil and electricity, due to the existence of the own price and cross price elasticities,. Therefore, removing coal price distortions can promote a low-carbon transition in China’s EIIs.
4) If oil price distortions were removed, the combined effect may not lead to a reduction on CO2 emissions, as the increase in oil prices could encourage enterprises of the EIIs to use a more dirty fuel (coal) to substitute oil products and thus give rise to even more CO2 emissions. However, if only a cleaner energy (electricity) can be used to substitute oil products, it can facilitate the low-carbon transition in China’s EIIs.
Based on these conclusions mentioned above, policy suggestions are given as follows.
Firstly, in China the price distortions in fossil-fuels still exist, as a result, promoting market-oriented price reform is still important for the low-carbon transition in China’s EIIs. The market-oriented price reform will enable the market mechanism to be effective, i.e., fuel demands will be determined by fuel prices and their price elasticities, encourage EIIs to adopt other production factors and cleaner energy sources to substitute fossil-fuels, so as to promote the low-carbon transition.
Secondly, when the market mechanism is effective, the government should also guide the EIIs enterprises to adopt cleaner energy sources to substitute fossil-fuels and limit the use of coal. It is especially helpful in the situation when domestic oil prices fluctuate with the rising international oil prices, the resulting oil prices in China may encourage EIIs enterprises to use more coal to substitute oil products. Therefore, the low-carbon transition in China’s EIIs requires both market price mechanism and the right kinds of policy guidance in place.
Finally, this paper only discussed the impact of fossil-fuel price distortions in EIIs on low-carbon transformation at the national and industrial level. In fact, if sufficient and reliable data can be collected to analyze the topic from the perspective of provincial heterogeneity, the conclusions will be more practical and policy significant.
The original contributions presented in the study are included in the article/supplementary material, further inquiries can be directed to the corresponding authors.
XW was responsible for investigation, data processing and writing; SL was responsible for formal analysis and writing; HW was responsible for methodology and software. BL was responsible for data analysis and writing.
The study was supported by MOE (Ministry of Education in China) Project of Humanities and Social Sciences (No. 19YJC790147) and Natural Science Foundation of Jiangsu Province (no. BK20180664).
The authors declare that the research was conducted in the absence of any commercial or financial relationships that could be construed as a potential conflict of interest.
All claims expressed in this article are solely those of the authors and do not necessarily represent those of their affiliated organizations, or those of the publisher, the editors, and the reviewers. Any product that may be evaluated in this article, or claim that may be made by its manufacturer, is not guaranteed or endorsed by the publisher.
DEA, data envelopment analysis; EIIs, energy Intensive Industries; FOB, free on board; IDA, index decomposition method; LMDI, logarithmic mean divisia index; MRP, marginal revenue product; R&D, research and development; PDA, production decomposition method; PIM, perpetual inventory method; SUR, seemingly unrelated regression.
Adetutu, M. O. (2014). Energy Efficiency and Capital-Energy Substitutability: Evidence from Four OPEC Countries. Appl. Energ. 119, 363–370. doi:10.1016/j.apenergy.2014.01.015
Berndt, E. R., and Wood, D. O. (1975). Technology, Prices, and the Derived Demand for Energy. Rev. Econ. Stat. 57 (3), 259–268. doi:10.2307/1923910
China Entrepreneur Investment Club (CEIC) 2018. CEIC Database. Available at. http://ceicdata.securities.com/cdmWeb/.
Chen, H., He, L., Chen, J., Yuan, B., Huang, T., and Cui, Q. (2019). Impacts of Clean Energy Substitution for Polluting Fossil-Fuels in Terminal Energy Consumption on the Economy and Environment in China. Sustainability 11 (22), 6419. doi:10.3390/su11226419
Christensen, L. R., Jorgenson, D. W., and Lau, L. J. (1973). Transcendental Logarithmic Production Frontiers. Rev. Econ. Stat. 55 (1), 28–45. doi:10.2307/1927992
Du, G., Sun, C., Ouyang, X., and Zhang, C. (2018). A Decomposition Analysis of Energy-Related CO2 Emissions in Chinese Six High-Energy Intensive Industries. J. Clean. Prod. 184, 1102–1112. doi:10.1016/j.jclepro.2018.02.304
Guo, P., Qi, X., Zhou, X., and Li, W. (2018). Total-factor Energy Efficiency of Coal Consumption: An Empirical Analysis of China's Energy Intensive Industries. J. Clean. Prod. 172, 2618–2624. doi:10.1016/j.jclepro.2017.11.149
Haller, S. A., and Hyland, M. (2014). Capital-energy Substitution: Evidence from a Panel of Irish Manufacturing Firms. Energ. Econ. 45, 501–510. doi:10.1016/j.eneco.2014.08.003
Huh, S.-Y., Lee, H., Shin, J., Lee, D., and Jang, J. (2018). Inter-fuel Substitution Path Analysis of the Korea Cement Industry. Renew. Sustain. Energ. Rev. 82 (3), 4091–4099. doi:10.1016/j.rser.2017.10.065
Ju, K., Su, B., Zhou, D., and Wu, J. (2017). Does Energy-price Regulation Benefit China's Economy and Environment? Evidence from Energy-price Distortions. Energy Policy 105, 108–119. doi:10.1016/j.enpol.2017.02.031
Khademvatani, A., and Gordon, D. V. (2013). A Marginal Measure of Energy Efficiency: the Shadow Value. Energ. Econ. 38, 153–159. doi:10.1016/j.eneco.2013.03.008
Kim, J., and Heo, E. (2013). Asymmetric Substitutability between Energy and Capital: Evidence from the Manufacturing Sectors in 10 OECD Countries. Energ. Econ. 40, 81–89. doi:10.1016/j.eneco.2013.06.014
Li, J., and Lin, B. (2016). Inter-factor/inter-fuel Substitution, Carbon Intensity, and Energy-Related CO2 Reduction: Empirical Evidence from China. Energ. Econ. 56, 483–494. doi:10.1016/j.eneco.2016.04.001
Li, J., and Sun, C. (2018). Towards a Low Carbon Economy by Removing Fossil Fuel Subsidies? China Econ. Rev. 50, 17–33. doi:10.1016/j.chieco.2018.03.006
Li, J., Xie, C., and Long, H. (2019). The Roles of Inter-fuel Substitution and Inter-market Contagion in Driving Energy Prices: Evidences from China's Coal Market. Energ. Econ. 84, 104525. doi:10.1016/j.eneco.2019.104525
Li, K., Fang, L., and He, L. (2019). How Population and Energy Price Affect China's Environmental Pollution? Energy Policy 129, 386–396. doi:10.1016/j.enpol.2019.02.020
Li, L., Wang, J., Tan, Z., Ge, X., Zhang, J., and Yun, X. (2014). Policies for Eliminating Low-Efficiency Production Capacities and Improving Energy Efficiency of Energy-Intensive Industries in China. Renew. Sustain. Energ. Rev. 39, 312–326. doi:10.1016/j.rser.2014.07.099
Lin, B., and Jiang, Z. (2011). Estimates of Energy Subsidies in China and Impact of Energy Subsidy Reform. Energ. Econ. 33 (2), 273–283. doi:10.1016/j.eneco.2010.07.005
Lin, B., and Tan, R. (2017). Sustainable Development of China's Energy Intensive Industries: From the Aspect of Carbon Dioxide Emissions Reduction. Renew. Sustain. Energ. Rev. 77, 386–394. doi:10.1016/j.rser.2017.04.042
Manigandan, P., Alam, M. S., Alharthi, M., Khan, U., Alagirisamy, K., Pachiyappan, D., et al. (2021). Forecasting Natural Gas Production and Consumption in United States-Evidence from SARIMA and SARIMAX Models. Energies 14 (19), 6021. doi:10.3390/en14196021
Marques, A. C., Fuinhas, J. A., and Pereira, D. A. (2018). Have Fossil Fuels Been Substituted by Renewables? An Empirical Assessment for 10 European Countries. Energy Policy 116, 257–265. doi:10.1016/j.enpol.2018.02.021
Murshed, M., Rashid, S., Ulucak, R., Dagar, V., Rehman, A., Alvarado, R., et al. (2021). Mitigating Energy Production-Based Carbon Dioxide Emissions in Argentina: the Roles of Renewable Energy and Economic Globalization. Environ. Sci. Pollut. Res., 15. doi:10.1007/s11356-021-16867-y
Niu, D., Gao, T., Ji, Z., Liu, Y., and Wu, G. (2021). Analysis of the Efficiency of Provincial Electricity Substitution in China Based on a Three-Stage DEA Model. Energies 14 (20), 6650. doi:10.3390/en14206650
Ouyang, J., and Ju, P. (2017). The Choice of Energy Saving Modes for an Energy-Intensive Manufacturer under Non-coordination and Coordination Scenarios. Energy 126, 733–745. doi:10.1016/j.energy.2017.03.059
Ouyang, X., and Sun, C. (2015). Energy Savings Potential in China's Industrial Sector: From the Perspectives of Factor price Distortion and Allocative Inefficiency. Energ. Econ. 48, 117–126. doi:10.1016/j.eneco.2014.11.020
Ouyang, X., Wei, X., Sun, C., and Du, G. (2018). Impact of Factor price Distortions on Energy Efficiency: Evidence from Provincial-Level Panel Data in China. Energy Policy 118, 573–583. doi:10.1016/j.enpol.2018.04.022
Presley, K. W., and Lin, B. Q. (2018). Energy Consumption, Fuel Substitution, Technical Change, and Economic Growth: Implications for CO2 Mitigation in Egypt. Energy Policy 117, 340–347.
Sharimakin, A. (2019). Measuring the Energy Input Substitution and Output Effects of Energy price Changes and the Implications for the Environment. Energy Policy 133, 110–119. doi:10.1016/j.enpol.2019.110919
Shi, X., and Sun, S. (2017). Energy price, Regulatory price Distortion and Economic Growth: A Case Study of China. Energ. Econ. 63, 261–271. doi:10.1016/j.eneco.2017.02.006
Sun, Q., Xu, L., and Yin, H. (2016). Energy Pricing Reform and Energy Efficiency in China: Evidence from the Automobile Market. Resource Energ. Econ. 44, 39–51. doi:10.1016/j.reseneeco.2016.02.001
Takayabu, H. (2020). CO2 Mitigation Potentials in Manufacturing Sectors of 26 Countries. Energ. Econ. 86, 104634. doi:10.1016/j.eneco.2019.104634
Tian, R. P., and Lin, B. Q. (2018). What Factors lead to the Decline of Energy Intensity in China's EIIs? Energ. Econ. 71, 213–221.
Wang, J., Hu, M., Tukker, A., and Rodrigues, J. F. D. (2019). The Impact of Regional Convergence in Energy-Intensive Industries on China's CO2 Emissions and Emission Goals. Energ. Econ. 80, 512–523. doi:10.1016/j.eneco.2019.01.024
Wang, M., and Tian, L. (2015). Regulating Effect of the Energy Market-Theoretical and Empirical Analysis Based on a Novel Energy Prices-Energy Supply-Economic Growth Dynamic System. Appl. Energ. 155, 526–546. doi:10.1016/j.apenergy.2015.06.001
Wang, X., Bai, M., and Xie, C. (2019). Investigating CO2 Mitigation Potentials and the Impact of Oil price Distortion in China's Transport Sector. Energy Policy 130, 320–327. doi:10.1016/j.enpol.2019.04.003
Wang, X., and Lin, B. (2017). Factor and Fuel Substitution in China's Iron & Steel Industry: Evidence and Policy Implications. J. Clean. Prod. 141, 751–759. doi:10.1016/j.jclepro.2016.09.133
Yang, M., Fan, Y., Yang, F., and Hu, H. (2014). Regional Disparities in Carbon Dioxide Reduction from China's Uniform Carbon Tax: A Perspective on Interfactor/interfuel Substitution. Energy 74, 131–139. doi:10.1016/j.energy.2014.04.056
Yuan, R., and Zhao, T. (2016). Changes in CO2 Emissions from China's Energy-Intensive Industries: a Subsystem Input-Output Decomposition Analysis. J. Clean. Prod. 117, 98–109. doi:10.1016/j.jclepro.2015.11.081
Zha, D., Kavuri, A. S., and Si, S. (2017). Energy Biased Technology Change: Focused on Chinese Energy-Intensive Industries. Appl. Energ. 190, 1081–1089. doi:10.1016/j.apenergy.2016.11.001
Keywords: price distortions, low-carbon transition, China’s energy intensive industries, carbon mitigation potential, fossil fuel substitution
Citation: Wang X, Liang S, Wang H, Huang S and Liao B (2022) Do Fossil-Fuel Price Distortions Impact the Low-Carbon Transition in China’s Energy Intensive Industries?. Front. Energy Res. 9:805224. doi: 10.3389/fenrg.2021.805224
Received: 30 October 2021; Accepted: 13 December 2021;
Published: 06 January 2022.
Edited by:
Yongping Sun, Hubei University Of Economics, ChinaReviewed by:
Abdul Rehman, Henan Agricultural University, ChinaCopyright © 2022 Wang, Liang, Wang, Huang and Liao. This is an open-access article distributed under the terms of the Creative Commons Attribution License (CC BY). The use, distribution or reproduction in other forums is permitted, provided the original author(s) and the copyright owner(s) are credited and that the original publication in this journal is cited, in accordance with accepted academic practice. No use, distribution or reproduction is permitted which does not comply with these terms.
*Correspondence: Xiaolei Wang, d2FuZ3hpYW9sZWkxQDE2My5jb20=; Binbin Liao, bGJiNTAyMjFAMTYzLmNvbQ==
Disclaimer: All claims expressed in this article are solely those of the authors and do not necessarily represent those of their affiliated organizations, or those of the publisher, the editors and the reviewers. Any product that may be evaluated in this article or claim that may be made by its manufacturer is not guaranteed or endorsed by the publisher.
Research integrity at Frontiers
Learn more about the work of our research integrity team to safeguard the quality of each article we publish.