- 1College of Petroleum Engineering, China University of Petroleum-Beijing, Beijing, China
- 2Department of Petroleum Engineering, Yangtze University, Wuhan, China
The complex fracture network formed by volume fracturing of shale gas reservoir is very important to the effect of reservoir reconstruction. The existence of bedding interface will change the propagation path of the hydraulic fracture in the vertical direction and affect the reservoir reconstruction range in the height direction. The three-point bending test is used to test and study the mechanical parameters and fracture propagation path of natural outcrop shale core. On this basis, a two-dimensional numerical model of hydraulic fracture interlayer propagation is established based on the cohesive element. Considering the fluid-solid coupling in the process of hydraulic fracturing, the vertical propagation path of hydraulic fracture under different reservoir properties and construction parameters is simulated. According to the results, the strength of the bedding interface is the weakest, the crack propagation resistance along the bedding interface is the smallest, and the crack propagation path is straight. When the crack does not propagate along the bedding interface, the fracture propagation resistance is large, and the fracture appears as an arc propagation path or deflection. The difference between vertical stress and minimum horizontal stress difference, interlayer stress difference and interface stiffness will have a significant impact on the propagation path of vertical fractures. Large injection rate and high viscosity fluid injection are helpful for vertical fractures to pass through the bedding interface, and low viscosity fracturing fluid is helpful to open the bedding interface. This research work is helpful to better understand the characteristics of bedding shale and the interlayer propagation law of vertical fractures, and to form the stimulation strategy of shale gas reservoir.
Introduction
Horizontal well multi-stage cluster fracturing technology is a necessary means for shale gas reservoir development (Longde et al., 2019). The vertical propagation of hydraulic fractures is one of the important factors to be considered in fracturing design. It determines the transformation range of volume fracture network in the vertical direction and is related to the effect of reservoir transformation (Jian et al., 2007; Zhu et al., 2015; Khanna and Kotousov, 2016; Guangqing et al., 2018). There are a lot of weak bedding cementation interfaces in shale reservoir. These weak bedding cementation interfaces are discontinuous surfaces (Gale et al., 2007; Gale et al., 2014), which affect the propagation path of vertical fractures.
It has been considered that when the crack tip extends to the bedding interface, there are three propagation behaviors in the height direction: (1) the vertical crack stops propagation; (2)the vertical fracture passes through the bedding interface; and (3)the vertical fracture deflects along the bedding interface (Haifeng and Mian, 2010). Due to the existence of weak cemented bedding interface, the propagation path of vertical fractures will be affected, which may cause the propagation path of vertical fractures to deviate from the original path, which is a necessary condition for the formation of complex fracture network (Lee et al., 2015). Aiming at the propagation path of hydraulic fractures at the bedding interface, relevant scholars established a fracture propagation criterion based on energy release rate and stress intensity factor (Hussain et al., 1973; Nuismer, 1975; He and Hutchinson, 1989; Jinzhou et al., 2014; Wan et al., 2014; Zeng and Wei, 2017). But the derivation is extremely complex. Some scholars have studied the propagation characteristics of fracture network in unconventional reservoirs by using machine learning and fractal theory (Wang et al., 2020; Wang et al., 2021).
At present, there have been many experimental studies on hydraulic fracture propagation with bedding interface. The preliminary study shows that the natural fracture interface in the formation cannot completely change the extension direction of hydraulic fractures (Koenig and Stubbs, 1986). The indoor triaxial hydraulic fracturing simulation experiment of shale believes that the hydraulic fracture will propagate through the natural fracture interface only under the condition of high stress difference and large included angle (Blanton, 1982; Blanton, 1986). In addition, the three-point bending experiments of half disk and cylindrical straight notch patterns are also used to study the fracture propagation law under different shale bedding orientations (Lee et al., 2015; Chandler et al., 2016; Wang et al., 2017; Forbes Inskip et al., 2018; Luo et al., 2018; Fakai et al., 2019). Some scholars use three-point bending and Brazilian splitting experiments to analyze the effect of shale bedding on hydraulic fracture propagation from the stress field distribution at the crack tip of anisotropic materials (Heng et al., 2015; Shuai et al., 2019). With the development of technology, digital image technology (He et al., 2013), acoustic emission, and CT scanning technology (Dan et al., 2015; Zhi et al., 2015) are also used to study the influence of shale bedding structure on hydraulic fracture propagation.
Although these experimental studies have studied the propagation path and failure mechanism when the hydraulic fracture intersects with the bedding interface, they have not systematically revealed the propagation path law when the vertical fracture intersects with the bedding interface. The numerical simulation can make up for the shortcomings of the experiment. The numerical simulation method is also widely used to study the law of crack propagation path. At present, cohesive elements have good practicability in simulating hydraulic fracture propagation. XFEM cannot be directly used to simulate the intersection of hydraulic fractures and bedding interface. It needs to automatically realize the pressure continuity and mass balance at the intersection of hydraulic fractures by sharing a fluid node, so as to establish the hydraulic fracture propagation model in the formation with natural fractures (Shi et al., 2017). This method requires Python for secondary development, and the process is cumbersome. Cohesive elements can model intersecting cracks, which follows the bilinear traction separation criterion. Based on a cohesive element, a multi-layer hydraulic fracture propagation model considering fluid solid coupling and bedding interface in hydraulic fracturing fluid injection process can be established to simulate and calculate the hydraulic fracture propagation direction under the conditions of different vertical stress, bedding plane angle, and bedding interface tensile strength (Hanyi, 2019; Chao et al., 2020). The globally embedded cohesive element can be used to carry out the fracture propagation characteristics of any path (Jun et al., 2021), taking into account the bedding of the stratum and the characteristics of natural fracture development (Shi et al., 2020; Yizhao et al., 2021).
To sum up, for the theoretical study of interlayer propagation of vertical fractures, the theoretical derivation is too complex, and the influence of the existence of bedding cementation interface on the height of vertical fractures is not well considered in experiments and numerical simulation. In this paper, the core of natural outcrop shale is tested by three-point bending experiment, and the mechanical parameters and propagation path of bedding shale are obtained. The finite element calculation model of the propagation path of vertical fracture at the bedding interface is established by using a cohesive element, considering the fluid-solid-damage coupling in the process of hydraulic fracturing, The law of vertical crack propagation path under different geological and construction conditions is calculated.
Experimental Methods and Results
Outcrop Shale Core Processing Method
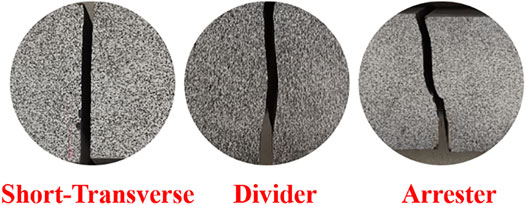
Shale is a typical transversely isotropic material. The direction of the bedding interface shall be considered in the test. Figure 1 shows three relative positional relationships between the hydraulic fracture propagation path and the bedding interface in bedding developed shale reservoir. Arrester and Divider are, respectively, used to characterize the two typical phenomena that may occur when the crack propagates to the bedding, that is, the Arrester orientation where the crack stops at the bedding and the bedding continues to crack and the Divider orientation where the crack is divided into multiple cracks by the bedding with priority cracking. The orientation of the notch plane parallel to the bedding plane in the figure is called Short-Transverse, which represents the notch orientation when the crack extends directly along the bedding.
The natural outcrop shale core used in this study is taken from Weiyuan shale gas well area, Sichuan, China, and the surface weathered part has been removed in advance during sampling. The core of natural outcrop shale is processed into a cuboid specimen, and the specimen is long × wide × height = 200 × 40 × 40 mm, a prefabricated crack opening is set in the middle of the bottom of the shale specimen, the height of the prefabricated crack opening is 8 mm, and the ratio of the prefabricated crack height to the core height is 0.2. Three shale cores of each type are processed, and a total of 15 shale cores are processed. The specific details of core sampling are shown in Figure 1. All processed shale outcrop specimens shall be numbered. Arrester type, Divider type, and Short-Transverse type are represented by letters A, D, and S, respectively, and numbered by adding numbers 1, 2, and 3 after the letter.
Three-Point Bending Loading Test of Bedding Shale
Mechanical Property Parameters of Bedding Shale
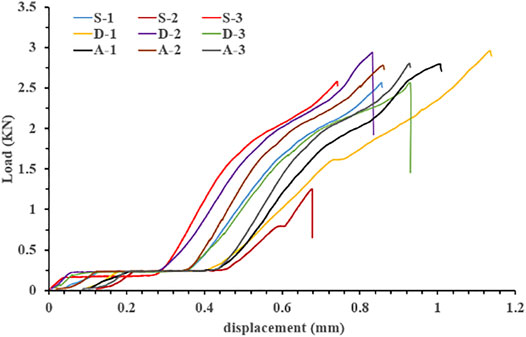
The three-point bending test is used for loading. The span of the three-point bending is 160 mm during the loading process. Because the shale may have great brittleness, the constant loading speed of 0.002 mm/min is used for loading during the loading process. Figure 2 shows the load-displacement curve of the testing machine during the loading.
As can be seen from the curves, the shapes of all curves are very similar. In the initial stage of loading, the load increases slightly, and then the load tends to be stable; with the continuous application of load, the load begins to increase gradually until the load reaches the peak load. When the load reaches the peak load, the test piece suddenly breaks. It is directly broken into two halves, and collapses and falls off the fixture. At the same time, the load curve falls off. The complete curve is not obtained during the whole loading process. This phenomenon also reflects that shale has strong brittle properties.
The calculation formula of tensile strength of a rectangular three-point bending specimen with prefabricated crack opening is as follows:
where Fmax represents the maximum load, N; S is the span of the test piece, m; t is the thickness of the test piece, m; h is the height of the test piece, m; a is the length of precast crack, m.
The fracture toughness calculation formula of a rectangular three-point bending specimen with prefabricated crack opening is as follows:
where: S, B, and W are the span, thickness, and height of the test piece, respectively; a0 is the length of the precast crack. For three-point bending, there is the following function (Anderson, 1991).
Figure 3 shows the relevant parameter values of an outcrop shale specimen obtained according to the three-point bending loading test results.
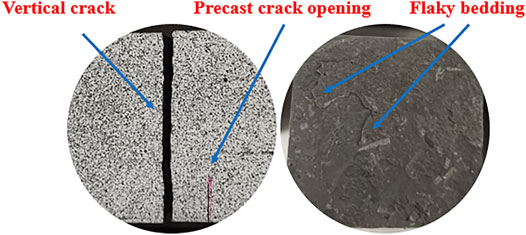
The parameter of sample S-3 is abnormal, and its parameter value is lower than that of the other two samples. This is because in the loading process, because the prefabricated crack of the specimen is not located on the bedding interface with the lowest strength during processing, the vertical crack starts at the position with lower strength. Figure 3 shows the crack morphology of an S-3 sample after complete failure. The crack shape of the specimen is straight and the section is flat. Many spalling bedding are found on the specimen section, which also shows that there are many bedding interfaces with low strength.
For different bedding interface orientations, it can be seen from Figure 4 that the strength of S-shaped specimens along the bedding interface is low. For D-type and A-type bedding plane orientation specimens, the peak load, tensile strength, and fracture toughness are greater than those of S-type specimens, but they are not obvious. In general, the mechanical strength of shale specimens with three typical bedding orientations presents Divider > Arrester > Short-Transverse.
Vertical Fracture Propagation Path of Bedding Shale
Figure 5 shows the crack propagation paths of all specimens. It can be seen that the propagation paths of vertical cracks of different types of specimens are different.
For Short-Transverse specimens, the notch direction is along the bedding plane. When subjected to external load, the crack starts to crack and expand along the bedding surface along the notch tip, and the fracture path does not turn and offset. It is a straight line along the bedding interface, and the section is relatively flat and smooth. This is because the cementation strength of the bedding interface is weaker than that of the shale body, and the ability to resist fracture is weaker.
For the Divider sample, the structure is that the notch passes through the bedding plane orthogonally. At the beginning of the vertical crack, the propagation path of the crack deviates to a certain extent, but the deviation of the propagation path gradually turns to the vertical direction after a short distance. Due to the action of three-point bending tensile stress, the influence of the bedding interface gradually weakens in the process of further propagation, and the fracture is more affected by tensile stress, making its propagation path turn to the vertical direction.
For the Arrester specimen, its structure is perpendicular to the bedding plane in the notch direction. After the vertical crack starts, the vertical crack deflects at the bedding interface due to the shale bedding interface. In the experiment, the vertical crack passes through the bedding interface, and the propagation path has been offset.
We know that the crack initiation and propagation is due to the stress intensity factor at the crack tip reaching the fracture toughness of the material. The fracture toughness of the material is an inherent attribute, and its size determines the ability of the material to resist crack propagation. Due to the anisotropy of bedding shale, its fracture toughness is different in different bedding directions, which shows different ability to resist crack propagation. According to the mechanical property parameters of shale under different bedding orientations obtained from the previous three-point bending test, for fracture toughness, in general, the mechanical strength of shale specimens with three typical bedding orientations presents Divider > Arrester > Short-converse. This shows that when the crack propagates along the bedding interface, its fracture toughness is the smallest, the resistance of the bedding shale to crack propagation is small, and the crack is easier to propagate along the bedding interface and form a flat crack shape. For the divider type specimen and arrester type specimen, the fracture toughness value is higher than that of the short reverse type specimen, and the vertical crack will be affected by the bedding interface during the propagation process, which will offset or deflect the propagation path of the vertical crack. For the divider specimen, the vertical crack presents a smooth arc and a stepped section in the propagation process, and the propagation process is affected by the combined action of the bedding interface and tensile stress. For arrester specimens, the cracks appear obvious deflection and arc-shaped path along the bedding interface. Its expansion is mainly affected by the bedding interface, and the crack shape is relatively complex.
Although we obtained the mechanical property parameters of the bedding shale by an experimental method, obtained the law of vertical fracture interlayer propagation path, and had a preliminary understanding of the vertical fracture propagation of the bedding shale, compared with the actual formation conditions, the factors such as in-situ stress and pore pressure cannot be considered by an experimental method. Therefore, on the basis of the experiment, the cohesive element is used to simulate the propagation of vertical fractures in the formation, so as to make up for the deficiency of the experiment.
Numerical Simulation Method
Damage Failure Theory of Cohesive Element
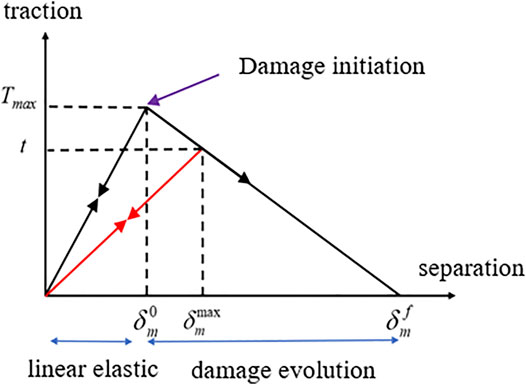
Figure 6 shows the traction-separation law (Tomar et al., 2004) used by the damage and failure process of the cohesive element. The constitutive relation of the cohesive element includes the early linear elastic behavior and damage evolution. The constitutive relation connects the nominal stress and nominal strain in the failure process of the cohesive element.
The nominal strain is the ratio of the traction displacement at the integration point of the cohesive element to the original thickness, and its calculation formula is
For the early linear elastic stage, the relationship between nominal stress and nominal strain of the cohesive element is as follows:
where t, ε, and E are the nominal stress, nominal strain, and material elastic modulus of the cohesive element, respectively; tn is the normal nominal stress on the cohesive element plane; ts and tt are tangential nominal stresses on the plane of the cohesive element; εn is the normal nominal strain on the cohesive element plane, mm; εs and εt are the nominal tangential strains on the cohesive element plane.
For damage initiation, the quadratic nominal stress criterion (Sun et al., 2019) as shown in Formula (2) can be used. When the nominal stress in the normal or tangential direction on the surface of the cohesive element reaches the maximum strength, the cohesive element begins to damage. The formula is as follows:
where
The linear damage evolution law is adopted in this study. The scalar damage variable D is used to describe the overall damage of the cohesive element. The damage variable changes monotonically from 0 to 1 during crack propagation. It can be calculated by the following equation:
where
The cohesive element is used to simulate the propagation process of hydraulic cracks. The energy release rate of the propagation criterion of hydraulic cracks adopts the B-K energy release rate proposed by Benzeggagh and Kenane (1996), and the calculation formula of B-K energy release rate is as follows:
where
The Constitutive Response of Fluid Within the Cohesive Element Gap
The fluid flow in the hydraulic fracture includes tangential flow and normal flow. Tangential flow is the reason for the forward expansion of the hydraulic fracture, and normal flow causes the filtration of fluid in the fracture.
For incompressible fracturing fluid with Newtonian fluid characteristics, the pressure drop equation in the fracture can be expressed as (Batchelor and Hunt, 1968; Qinghua et al., 2017):
where pf is the fluid pressure in the crack, MPa; µw is the liquid viscosity, mPa·s.
For the normal flow of fluid in the fracture, it describes the filtration of fluid in the fracture to the formation. The normal seepage of fracturing fluid on the upper and lower surfaces of the cohesive element can be expressed as follows:
where qt and qb are the flow of fluid along the upper and lower surfaces, m3/s; ct and cb are the filtration coefficients of fluid on the upper and lower surfaces of fractures, dimensionless; pi is the fluid pressure on the middle surface of the cohesive element fracture element, MPa; pt and pb are the pore pressure of the fluid on the upper and lower surfaces of the fracture, MPa.
Pressure Transfer of Pore Water Pressure Element at Crack Intersection
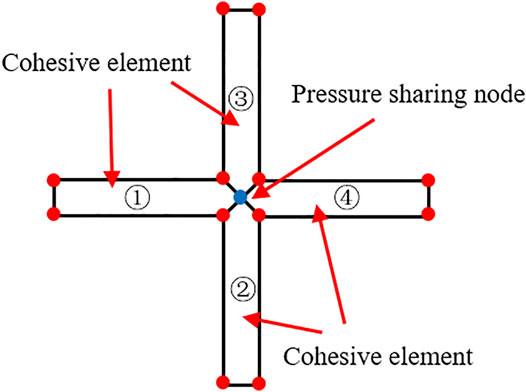
For the intersection of hydraulic fractures and weak formation interface in the process of volumetric fracturing of shale gas reservoir, the deflection of propagation path is caused. When simulating the intersection of vertical fracture and weak bedding interface, it is necessary to solve the problem of fluid pressure transfer at the intersection of the cohesive element. Because the middle layer node of the cohesive element is used to simulate the tangential flow of fluid in the seam, when the cohesive elements intersect, all elements must share a common middle surface node at the intersection position to support the continuity of fluid flow.
Figure 7 shows a two-dimensional example of intersecting cohesive element. The cohesive elements numbered ①, ②, ③, and ④share the same intermediate pore pressure node at the intersection. When the fluid pressure is transmitted to the pressure node of ② cohesive element, the fluid pressure is first transmitted to the combined shared pressure node, and then the pressure nodes of ①, ③, and ④ cohesive elements are set to the same fluid pressure. Due to the different parameter properties of the cohesive elements, there are differences in flow distribution in the three directions, and finally different expansion paths are formed.
In ABAQUS, the “Merge” tool in the grid tool can be used to merge the intermediate nodes of the cohesive elements on the weak bedding surface and the fracture propagation path into a shared fluid pressure node to realize the pressure transfer when the hydraulic fracture extends to the bedding interface.
Fluid Solid Coupling Theory
By solving the stress balance equation and fluid continuity equation, the fluid solid coupling solution in the fracturing process is realized. The rock stress balance equation is as follows (Diguang et al., 2016):
The fluid continuity equation is
where
Numerical Simulation Calculation
Model Validation
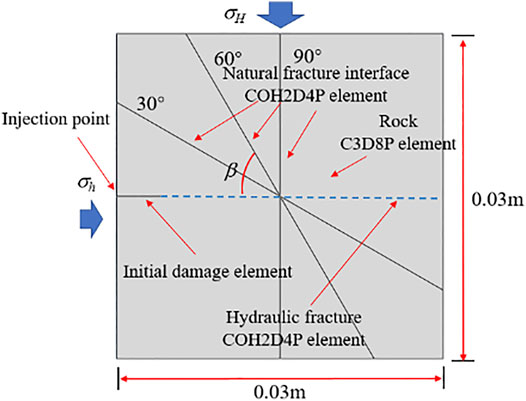
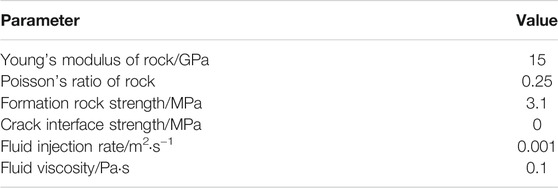
Blanton (1986) studied the propagation path law of hydraulic fractures when encountering natural fractures interface under different conditions by using indoor hydraulic fracturing experiments under triaxial stress. In order to verify the feasibility and correctness of using zero thickness cohesive element method to calculate the propagation path when the hydraulic fracture intersects with the interface, referring to the experiment of Blanton, the finite element models with the intersection angles of 30°, 60°, and 90° between the hydraulic fracture and the natural fracture interface as shown in Figure 8 are established. Model parameter settings are shown in Table 1.
Figure 9 shows the numerical simulation results. It can be seen that when the included angle between hydraulic fracture and natural fracture interface is 30°, 60°, and 90°, the propagation paths of hydraulic fractures are stop propagation, passing through, and passing through natural fracture interface, respectively. Table 2 shows the summary of numerical simulation results and Blanton experimental results. It can be seen that the hydraulic fracture propagation path calculated by numerical simulation results is the same as the experimental results. The feasibility and correctness of using zero thickness cohesive element to simulate the propagation path when hydraulic fracture intersects with interface are verified.
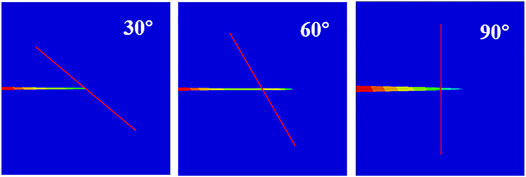
FIGURE 9. Finite element calculation results of interface intersection between hydraulic fracture and natural fracture.
Finite Element Model and Paramenter Setting
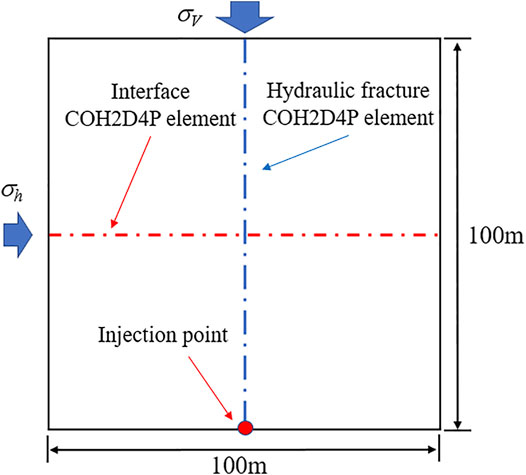
The geometric model as shown in Figure 10 is established. Vertical and horizontal cohesive elements are inserted in advance, and the vertical cohesive element is used to simulate hydraulic fracture propagation in shale rock mass. The horizontal cohesive element is used to simulate the bedding interface. The vertical fracture width direction (X direction) is the minimum horizontal in-situ stress direction, and the fracture height direction (Y direction) is the vertical stress direction, which is orthogonal to each other. The model size is 100 × 100 m.
The loading mode of the model adopts concentrated point injection, and the injection of hydraulic fracturing fluid is simulated at a constant fluid injection rate at the injection point. CPE4P element and COH2D4P element with pore pressure are used to simulate the fracture propagation. The displacement constraint boundary condition is set as 0 in the X and Y directions of the model, and the two cohesion elements near the liquid injection point on the hydraulic fracture propagation path are set as the initial damage elements.
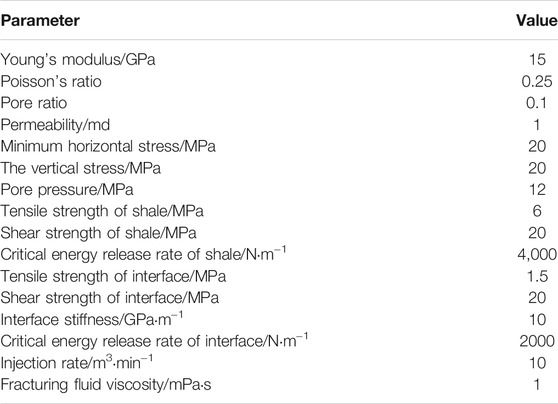
The basic data of shale body, shale interface, and construction parameters in the model are shown in Table 3. When considering different conditions, only one of the parameters is changed.
Simulation Results
Different Ground Stress Difference
In the process of vertical fracture propagation in strata with bedding interface, the difference between vertical stress and minimum horizontal stress directly affects the propagation behavior of vertical hydraulic fractures. Set the minimum horizontal stress as 20 MPa, and then change the vertical stress as 20, 21, and 24 MPa, respectively, corresponding to the extension path when the difference between the vertical stress and the minimum horizontal in-situ stress is 0, 1, and 4 MPa, respectively.
It can be seen from Figure 11 that the difference between vertical stress and minimum horizontal stress will affect the interlayer propagation path and fracture shape of vertical fractures. There is no difference between the vertical stress and the minimum horizontal stress, or when the difference between the vertical stress and the minimum horizontal stress is small, the interface is easy to open, and the vertical fracture will deflect at the interface. For example, when the stress difference in the calculation results is 0 and 1 MPa, the interface opens but does not pass through the interface, forming a “T" fracture, and the growth of the fracture height is limited to 50 m. At 1 MPa, the interface is opened and passes through the interface to form a “+” crack. With the increase of the difference between the vertical stress and the minimum horizontal stress, the difficulty of opening the interface increases. The vertical fracture directly passes through the bedding interface when the difference between the vertical stress and the minimum horizontal stress is 4 MPa in the calculation results.
The variation curve of liquid injection point pressure with liquid injection time under three different vertical stress and minimum horizontal stress differences can be seen from Figure 11. It can be seen that at the initial stage of liquid injection, the pressure at the liquid injection point rises rapidly, and the fracture pressure corresponding to the pressure peak point is 19.2 MPa in all cases. This shows that the change of vertical stress does not affect the fracture pressure. After the pressure reaches the peak, the pressure drops rapidly and tends to be stable. When the vertical stress and the minimum horizontal in-situ stress are 0 MPa, the injection point pressure drops again at 700 s because the vertical fracture has expanded to the bedding interface and opened the bedding interface, resulting in the drop of the injection point pressure. With the increase of the vertical stress, when the difference between the vertical stress and the minimum horizontal stress is 1 MPa, this phenomenon does not occur again. When the difference between vertical stress and minimum horizontal stress is 4 MPa, the pressure drop occurs at 1380 s, which is due to the vertical crack tip is close to the model boundary.
Ground Stress Difference Between Different Layers
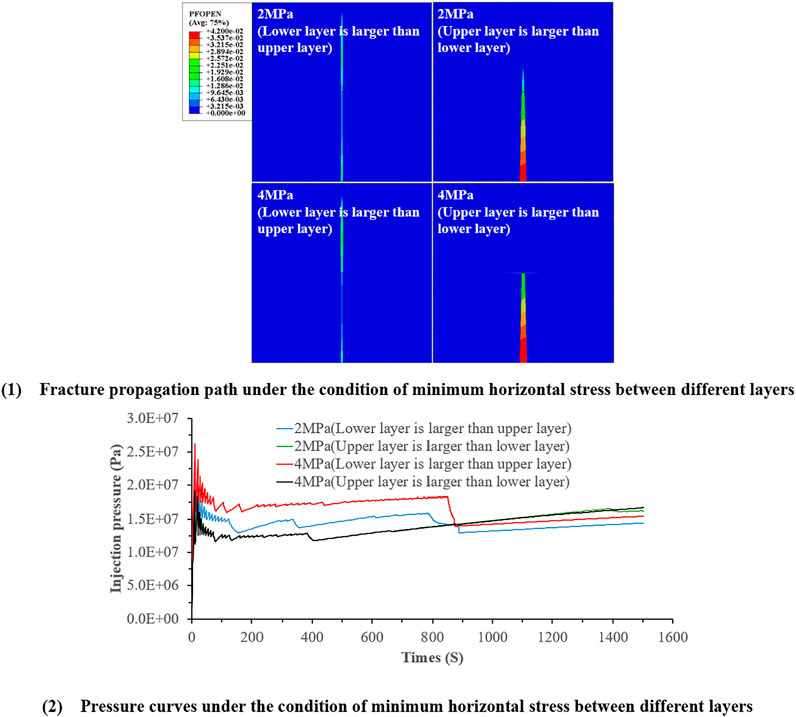
When hydraulic fractures extend to the interface, the minimum horizontal stress difference between layers has a great influence on the propagation path of vertical fractures. In the numerical simulation, the difference between the vertical stress and the minimum horizontal stress is 4 MPa. The simulation calculation is carried out when the horizontal stress difference between layers is 2 and 4 MPa. For layered shale reservoir, there may be two situations: the upper horizontal stress is greater than the lower horizontal stress or the lower horizontal in-situ stress is greater than the upper horizontal stress. Figure 12 shows the propagation path under the condition of different interlayer stress differences.
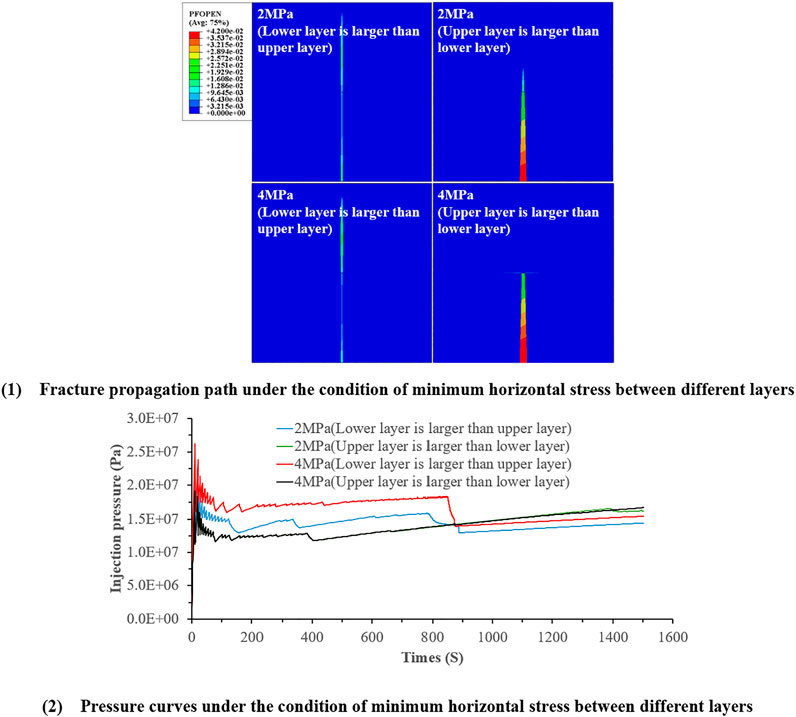
FIGURE 12. Numerical simulation results under the condition of minimum horizontal stress between different layers.
It can be seen from the above results that when the horizontal stress difference between layers is 0 MPa, the vertical fracture passes through the interface and the interface is not opened. When the horizontal stress difference between layers is 2 MPa, the vertical cracks pass through the interlayer interface. When the horizontal stress of the lower layer is greater than that of the upper layer, the vertical cracks expand through the interface, the interface is not opened, and the overall width of the vertical cracks is small, showing a relatively slender state. When the horizontal in-situ stress of the lower layer is less than that of the upper layer, the vertical fracture extends through the interface, the interface is not opened, and the overall width of the vertical fracture is large, showing the state of the end width. At the same time, it can also be seen that the fracture height when the horizontal stress of the lower layer is greater than that of the upper layer is significantly greater than that when the horizontal stress difference of the lower layer is less than that of the upper layer, which indicates that when the horizontal stress difference of the lower layer is less than that of the upper layer, the height propagation of the vertical fracture will be affected, which is not conducive to the height growth of the vertical fracture. When the horizontal stress difference between layers is less than 4 MPa, if the horizontal stress of the lower layer is greater than that of the upper layer, the vertical crack passes through the interface and the interface is not damaged. At the same time, the crack width of the vertical crack in the upper layer is greater than that in the lower layer. When the horizontal stress of the lower layer is less than that of the upper layer, the vertical fracture does not pass through the interface, but deflects along the interface to form a “T” shaped fracture.
It can be seen that the interlayer horizontal stress difference affects the interlayer expansion path of vertical fractures. Generally speaking, the greater the interlayer horizontal stress difference, the more difficult it is to increase the height of vertical fractures, and this phenomenon is more obvious when the horizontal stress difference in the lower layer is less than that in the upper layer.
It can be seen from Figure 12 that the pressure curve is under the condition of different interlayer stress difference. It can be seen that the peak value of the pressure curve is different. When the interlayer stress difference is 2 MPa (upper > lower), the pressure curve basically coincides with that at 4 MPa (upper > lower), and there is no drop after the pressure area at the liquid injection point is stable, and the pressure peak point of both is 19.0 MPa. This is because although the minimum horizontal stress difference between the two layers is different, the minimum horizontal stress at the horizon where the liquid injection point is located is 8 MPa. When the interlayer stress difference is 2 MPa (lower > upper) and 4 MPa (lower > upper), the pressure peak point is 22.5 and 26.5 MPa, respectively. This is because the minimum horizontal stress in the upper layer is less than that in the lower layer in these two cases.
Different Interface Stiffness
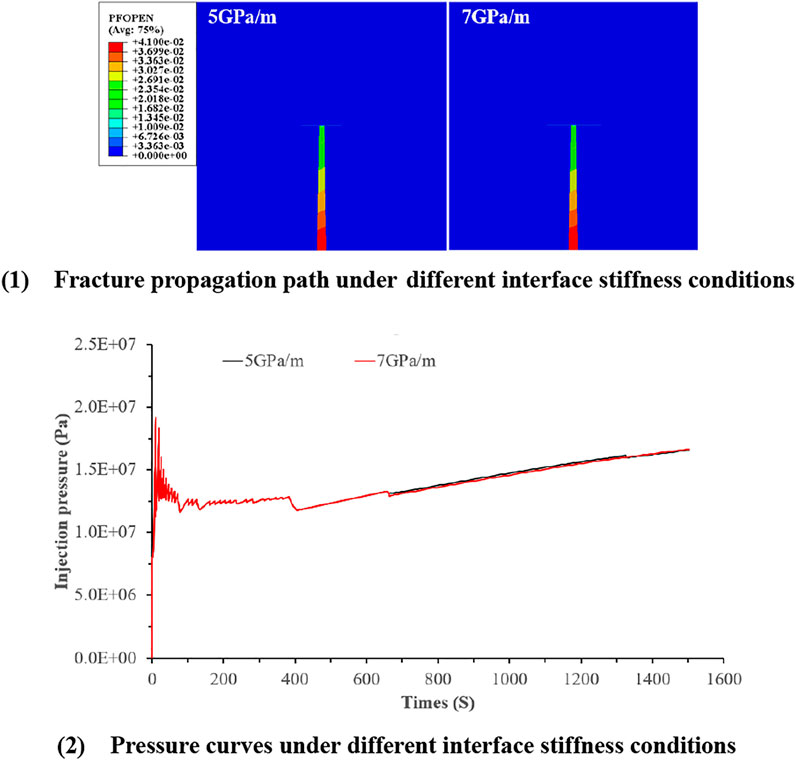
The interface stiffness is used to quantitatively characterize the interface strength. In the numerical simulation, the difference between the vertical stress and the minimum horizontal stress is 4 MPa. The simulation calculation is carried out when the interface stiffness is 7 GPa/m and 5 GPa/m, respectively. The difference between the vertical stress and the minimum horizontal stress in Figure 11 is 4 MPa, the interface stiffness is 10 GPa/m. Figure 13 shows the through layer expansion path under different interface strength conditions.
From the results, it can be seen that the interface stiffness affects the propagation path of vertical cracks at the interface and the shape of vertical cracks. When the interface strength is 10 GPa/m, the vertical crack directly passes through the interface and the interface is not opened. When the interface strength is 7 GPa/m and 5 GPa/m, the growth of the vertical crack height is restrained, the final crack height is 50 m, stops at the interface, and the interface is opened, forming a “+” crack. This shows that the higher the interface stiffness is, the easier the vertical crack is to propagate through the layer interface, and the lower the stiffness strength is, the easier the vertical crack is to deflect along the interface.
It can be seen from Figure 13 that the pressure curve of the liquid injection point is under the conditions of different bedding interface stiffness. The curve trend under the two different conditions is generally the same, and the pressure peak point is 19.5 MPa.
Different Injection Rate
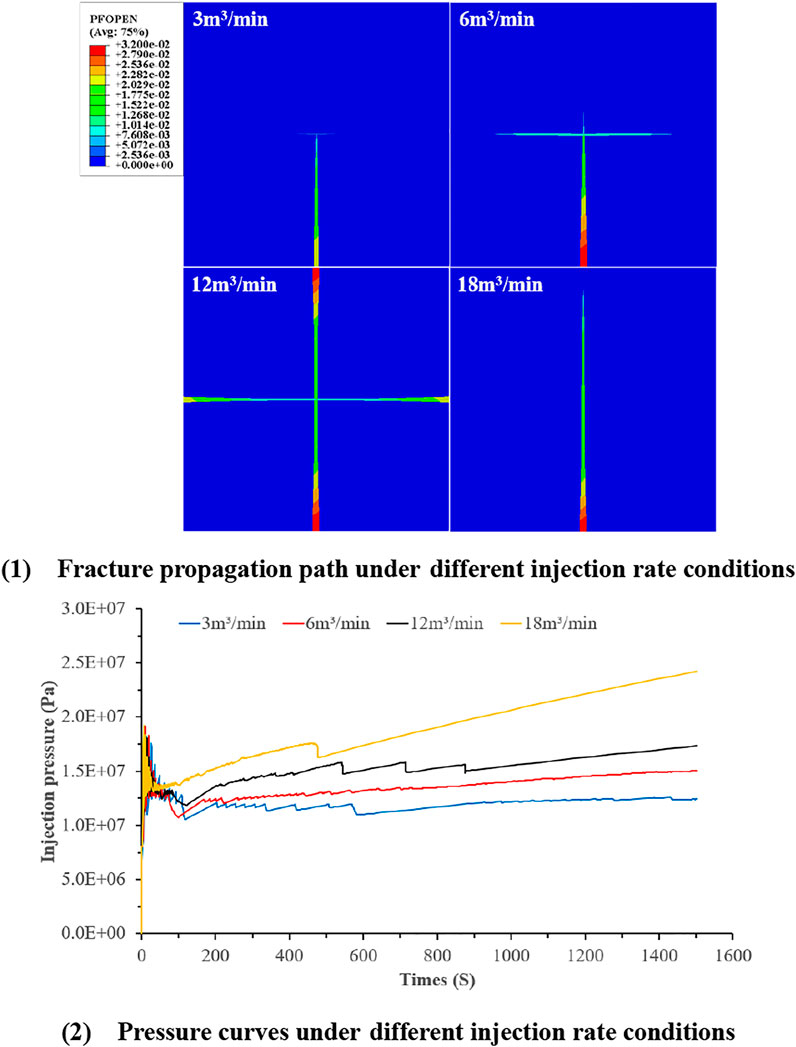
In the numerical simulation, the fracturing fluid injection rates are 3 m3/min, 6 m3/min, 12 m3/min, and 18 m3/min, respectively. Figure 14 shows the propagation path of hydraulic fracture through the layer interface under different liquid injection rates.
According to numerical simulation results, it can be seen that the larger the injection rate is, the greater the vertical crack height is and the greater the crack width is. This is because the greater the injection rate and the greater the net pressure in the fracture, the easier it is to overcome the resistance encountered in the crack propagation process of hydraulic fracture. At the same time, the larger the injection rate is, the greater the opening degree of bedding interface is, and the farther the hydraulic fracture extends on the bedding interface. In general, the greater the injection rate, the greater the crack height, the greater the extension distance on the bedding interface, and the easier it is to form a volumetric fracture network.
It can be seen from Figure 14 that the pressure curves of the liquid injection point are under different liquid injection rates. It can be seen that all curves have the same law from the beginning of the liquid injection to the peak stage of the liquid injection point pressure, and the pressure peak point is 19.5 MPa. For the subsequent curve trend, the higher the injection rate, the greater the pressure at the injection point.
Different Fracturing Fluid Viscosity
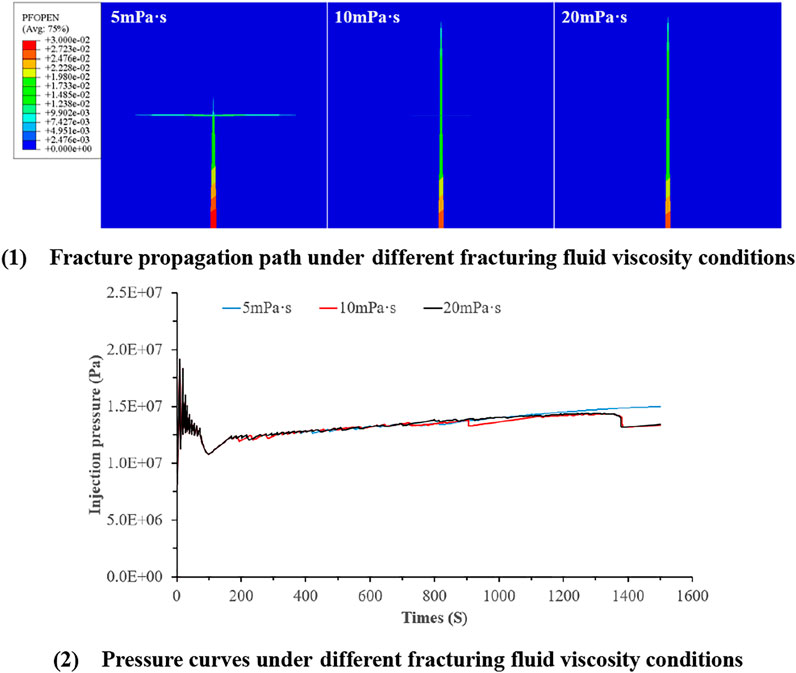
When fracturing fluid is injected into shale, the leakage of the fracturing fluid is mainly determined by the viscosity of the fracturing fluid. In the numerical simulation, the viscosity of the fracturing fluid is 5, 10, and 20 mPa s, respectively. Figure 15 shows the propagation path of hydraulic fracture through the layer under the conditions of different fracturing fluid viscosity.
It can be seen from the results that the viscosity of fracturing fluid affects the propagation of vertical fractures at the interface. When the viscosity of fracturing fluid is low, the bedding interface is easy to open, resulting in the obstruction of vertical fracture propagation in height. For example, when the viscosity of fracturing fluid is 5 mPa s, the bedding interface is opened, and the vertical fracture also passes through the bedding interface to form a “+” fracture. At the same time, when the fracturing fluid viscosity is 10 and 20 mPa s, the vertical fracture directly passes through the interface, and the interface is not opened.
It can be seen from Figure 15 that the pressure curve of the injection point is under different viscosity conditions of fracturing fluid. The change trend of the pressure curve under different viscosity conditions is basically the same, and the pressure peak point is 19.5 MPa.
Conclusion
In this work, we first carried out three-point bending tests on outcrop shale cores with different bedding orientations and tested the mechanical parameters and expansion path of the bedding shale. On this basis, the numerical calculation model of vertical crack propagation at the interlayer interface is established by using a cohesive element, and the propagation path of a vertical crack under different conditions is calculated. The main conclusions are as follows.
1) The strength along the bedding interface is the smallest, the resistance to fracture propagation along the bedding interface is the smallest. When the fracture and bedding interface are orthogonal or vertical, the fracture propagation resistance is large, the fracture propagation path will show an arc shape under the joint action of the bedding interface and tensile stress or deflect along the interface.
2) The greater the difference between the vertical stress and the minimum horizontal stress, the easier it is for the vertical fracture to pass through the shale bedding interface, and the more difficult it is to open the shale bedding interface. When the difference between the vertical stress and the minimum horizontal in-situ stress is equal or the difference is small, the shale bedding interface may be opened in the process of vertical fracture propagation to form a “T” or “cross” fracture propagation path.
3) When the horizontal stress of the lower layer is greater than the horizontal stress difference of the upper layer, the vertical fracture is easier to pass through the shale bedding interface than when the horizontal stress difference of the lower layer is less than the horizontal stress difference of the upper layer. When the horizontal stress difference of the lower layer is greater than the horizontal low stress difference of the upper layer, it is possible that the width of the underwater crack in the lower layer is less than that of the hydraulic crack in the upper layer. When the horizontal stress difference of the lower layer is less than that of the upper layer, the shale interface is easy to open, and the resistance of vertical fracture propagation through the layer is large. The vertical fracture is easier to stop propagation at the interface or open the shale bedding interface to form a “T” shaped fracture.
4) The interface stiffness will affect the propagation path of vertical cracks through layers. The greater the bedding interface stiffness, the easier it is for vertical fractures to pass through bedding fractures. The smaller the stiffness of the bedding interface, the easier it is for the vertical crack to open the bedding interface and form a “T” shaped crack.
5) The larger the injection rate is, the greater the crack height is, the greater the extension distance on the bedding interface is, and the easier it is to form a volumetric fracture network. The higher the viscosity of fracturing fluid, the easier the vertical fracture passes through the shale bedding interface, and the lower the viscosity of fracturing fluid, the easier it is to open the bedding interface.
Data Availability Statement
The raw data supporting the conclusion of this article will be made available by the authors, without undue reservation.
Author Contributions
DX: Formulate experimental scheme and numerical simulation scheme; organize and carry out shale core loading test; establishment of numerical model; data analysis; paper writing. XM: Provide guidance for experiment and numerical simulation; make article modifications. HY: Participate in shale core loading experiment; put forward opinions on the writing of the article. YL: Participate in shale core loading experiment. QZ: Parameter numerical simulation modeling and data analysis.
Funding
This project is financial supported by the National Natural Science Foundation of China (Grant No. 51704037).
Conflict of Interest
The authors declare that the research was conducted in the absence of any commercial or financial relationships that could be construed as a potential conflict of interest.
Publisher’s Note
All claims expressed in this article are solely those of the authors and do not necessarily represent those of their affiliated organizations, or those of the publisher, the editors, and the reviewers. Any product that may be evaluated in this article, or claim that may be made by its manufacturer, is not guaranteed or endorsed by the publisher.
Acknowledgments
Thanks to HY for his support of this article.
References
Anderson, T. L. (1991). Fracture Mechanics: Fundamentals and Applications. CRC Press, Taylor & Francis. 978-1-4987-2813-3.
Benzeggagh, M. L., and Kenane, M. (1996). Measurement of Mixed-Mode Delamination Fracture Toughness of Unidirectional Glass/Epoxy Composites with Mixed-Mode Bending Apparatus. Composites Sci. Tech. 56, 439–449. doi:10.1016/0266-3538(96)00005-X
Blanton, T. L. (1982). An Experimental Study of Interaction between Hydraulically Induced and Pre-existing Fractures. Pittsburgh, Pennsylvania: Proceedings of SPE Unconventional Gas Recovery Symposium. doi:10.2118/10847-MS
Blanton, T. L. (1986). Propagation of Hydraulically and Dynamically Induced Fractures in Naturally Fractured Reservoirs. Louisville, Kentucky: Proceedings of SPE Unconventional Gas Technology Symposium. doi:10.2118/15261-MS
Chandler, M. R., Meredith, P. G., Brantut, N., and Crawford, B. R. (2016). Fracture Toughness Anisotropy in Shale. J. Geophys. Res. Solid Earth 121, 1706–1729. doi:10.1002/2015JB012756
Dan, X., Ruilin, H., Wei, G., and Jiaguo, X. (2015). Effects of Laminated Structure on Hydraulic Fracture Propagation in Shale. Pet. Exploration Develop. 42, 523–528. doi:10.1016/S1876-3804(15)30052-5
Diguang, G., Zhanqing, Q., Jianxiong, L., Guanzheng, Q., Yanchao, C., and Tiankui, G. (2016). Extended Finite Element Simulation of Hydraulic Fracture Based on ABAQUS Platform. Rock Soil Mech. 37 (5), 302–310. doi:10.16285/j.rsm.2016.05.036
Dou, F., Wang, J. G., Zhang, X., and Wang, H. (2019). Effect of Joint Parameters on Fracturing Behavior of Shale in Notched Three-Point-Bending Test Based on Discrete Element Model. Engineering Fracture Mechanics 205, 40–56. doi:10.1016/j.engfracmech.2018.11.017
Forbes Inskip, N. D., Meredith, P. G., Chandler, M. R., and Gudmundsson, A. (2018). Fracture Properties of Nash Point Shale as a Function of Orientation to Bedding. J. Geophys. Res. Solid Earth 123, 8428–8444. doi:10.1029/2018JB015943
Gale, J. F. W., Laubach, S. E., OlsonEichhubl, J. E. P., Eichhuble, P., and Fall, A. (2014). Natural Fractures in Shale: A Review and New Observations. Bulletin 98, 2165–2216. doi:10.1306/08121413151
Gale, J. F. W., Reed, R. M., and Holder, J. (2007). Natural Fractures in the Barnett Shale and Their Importance for Hydraulic Fracture Treatments. Bulletin 91, 603–622. doi:10.1306/11010606061
Guangqing, Z., Mian, C., and Yanbo, Z. (2018). Study on Initiation and Propagation Mechanism of Fractures in Oriented Perforation of New Wells. Acta Petrolei Sinica 29, 116–119. doi:10.7623/syxb200801025
He, L., Suling, W., Minzheng, J., and Yiming, Z. (2013). Experiments of Vertica1 Fracture Propagation Based on the Digita1 Speck1e Technology. Pet. Exploration Develop. 40, 486–491. doi:10.1016/S1876-3804(13)60067-1
He, M., and Hutchinson, J. W. (1989). Crack Deflection at an Interface between Dissimilar Elastic Materials. Int. J. Sol. Structures 25, 1053–1067. doi:10.1016/0020-7683(89)90021-8
Heng, S., Yang, C., Guo, Y. T., and Wang, C. (2015). Influence of Bedding Planes on Hydraulic Fracture Propagation in Shale Formations. Chin. J. Rock Mech. Eng. 34, 228–237. doi:10.13722/j.cnki.jrme.2015.02.002
Hussain, M., Pu, S., and Underwood, J. (1973). “Strain Energy Release Rate for a Crack under Combined Mode I and Mode II,” in Fracture Analysis: Proceedings of the 1973 National Symposium on Fracture Mechanics, Part II. Editor G. Irwin, 2. doi:10.1520/STP33130S
Jian, Z., Mian, C., Yan, J., and Guangqing, Z., (2007). Experimental Study on Hydraulic Fracture Propagation Mechanism of Fractured Reservoir. Acta Petrolei Sinica 28, 109–113. 0253-2697(2007)05-0109-05.
Jinzhou, Z., Yongming, L., Song, W., Youshi, J., and Liehui, Z. (2014). Simulation of Complex Fracture Networks Influenced by Natural Fractures in Shale Gas Reservoir. Nat. Gas Industry B 1, 89–95. doi:10.1016/j.ngib.2014.10.012
Jun, L., Wenbao, Z., Chaowei, C., Gonghui, L., Yingcao, Z., and Liehui, Z. (2021). Research on Random Propagation Method of Hydraulic Fracture Based on Zero-Thickness Cohesive Element. Rock Soil Mech. 42, 265–279. doi:10.16285/j.rsm.2020.0805
Khanna, A., and Kotousov, A. (2016). Controlling the Height of Multiple Hydraulic Fractures in Layered Media. SPE J. 21, 256–263. doi:10.2118/176017-PA
Koenig, R. A., and Stubbs, P. B. (1986). Proceedings of SPE Unconventional Gas Technology Symposium - Interference Testing of a Coalbed Methane Reservoir. Louisville, Kentucky: Proceedings of SPE Unconventional Gas Technology Symposium. doi:10.2523/15225-MS
Lee, H. P., Olson, J. E., Holder, J., Gale, J. F. W., and Myers, R. D. (2015). The Interaction of Propagating Opening Mode Fractures with Preexisting Discontinuities in Shale. J. Geophys. Res. Solid Earth 120, 169–181. doi:10.1002/2014JB011358
Longde, S., Zou, C., Jia, A., Wei, Y., Zhu, R., Wu, S., et al. (2019). Development Characteristics and Orientation of Tight Oil and Gas in China. Pet. Exploration Develop. 46, 1015–1026. doi:10.1016/S1876-3804(19)60264-8
Luo, Y., Xie, H. P., Ren, L., Zhang, R., Li, C. B., and Gao, C. (2018). Linear Elastic Fracture Mechanics Characterization of an Anisotropic Shale. Sci. Rep. 8, 1–12. doi:10.1038/s41598-018-26846-y
Lei, Q., Latham, J.-P., Xiang, J., and Tsang, C.-F. (2017). Role of Natural Fractures in Damage Evolution Around Tunnel Excavation in Fractured Rocks. Engineering Geology 231, 100–113. doi:10.1016/j.enggeo.2017.10.013
Nuismer, R. J. (1975). An Energy Release Rate Criterion for Mixed Mode Fracture. Int. J. Fract 11, 245–250. doi:10.1007/BF00038891
Shi, F., Wang, X., Liu, C., Liu, H., and Wu, H. (2017). An XFEM-Based Method with Reduction Technique for Modeling Hydraulic Fracture Propagation in Formations Containing Frictional Natural Fractures. Eng. Fracture Mech. 173, 64–90. doi:10.1016/j.engfracmech.2017.01.025
Shi, J., Zhang, J., Zhang, C., Jiang, T., and Huang, G. (2020). Numerical Model on Predicting Hydraulic Fracture Propagation in Low-Permeability Sandstone. Int. J. Damage Mech. 30, 297–320. doi:10.1177/1056789520963206
Shuai, H., Xiao, L., Xianzhong, L., Xiaodong, Z., and Chunhe, Y. (2019). Study on the Fracture Propagation Mechanisms of Shale under Tension. Chin. J. Rock Mech. Eng. 38, 2031–2043. doi:10.13722/j.cnki.jrme.2019.0557
Shuai, H., Chunh, Y., Yintong, G., Chuanyang, W., and Lei, W. (1968). An Introduction to Fluid Dynamics. By G. K. Batchelor. Pp. 615. 75s. (Cambridge.). Math. Gaz. 52, 206–207. doi:10.2307/3612749
Sun, C., Zheng, H., Liu, W. D., and Lu, W. (2020). Numerical Simulation Analysis of Vertical Propagation of Hydraulic Fracture in Bedding Plane. Engineering Fracture Mechanics 232, 107056. doi:10.1016/j.engfracmech.2020.107056
Sun, X., Yu, L., Rentschler, M., Wu, H., and Long, R. (2019). Delamination of a Rigid Punch from an Elastic Substrate under Normal and Shear Forces. J. Mech. Phys. Sol. 122, 141–160. doi:10.1016/j.jmps.2018.09.009
Tomar, V., Zhai, J., and Zhou, M. (2004). Bounds for Element Size in a Variable Stiffness Cohesive Finite Element Model. Int. J. Numer. Meth. Engng. 61, 1894–1920. doi:10.1002/nme.1138
Wan, C., Yan, J., Mian, C., Tong, X., Yakun, Z., and Ce, D. (2014). A Criterion for Identifying Hydraulic Fractures Crossing Natural Fractures in 3D Space. Pet. Exploration Develop. 41, 336–340. doi:10.1016/S1876-3804(14)60042-2
Wang, H. (2019). Hydraulic Fracture Propagation in Naturally Fractured Reservoirs: Complex Fracture or Fracture Networks. Journal of Natural Gas Science and Engineering 68, 102911. doi:10.1016/j.jngse.2019.102911
Wang, H., Zhao, F., Huang, Z., Yao, Y., and Yuan, G. (2017). Experimental Study of Mode-I Fracture Toughness for Layered Shale Based on Two ISRM-Suggested Methods. Rock Mech. Rock Eng. 50, 1933–1939. doi:10.1007/s00603-017-1180-8
Wang, S., Qin, C., Feng, Q., Javadpour, F., and Rui, Z. (2021). A Framework for Predicting the Production Performance of Unconventional Resources Using Deep Learning. Appl. Energ. 295, 117016. doi:10.1016/j.apenergy.2021.117016
Wang, S., Wang, X., Bao, L., Feng, Q., Wang, X., and Xu, S. (2020). Characterization of Hydraulic Fracture Propagation in Tight Formations: A Fractal Perspective. J. Pet. Sci. Eng. 195, 107871. doi:10.1016/j.petrol.2020.107871
Yizhao, W., Bing, H., and Dong, W., (2021). Features of Fracture Height Propagation in Cross-Layer Fracturing of Shale Oil Reservoirs. Pet. Exploration Develop. 48, 402–410. doi:10.1016/S1876-3804(21)60038-1
Yizhao, W., Bing, H., Dong, W., and Zhenhua, J. (2017). Crack Deflection in Brittle Media with Heterogeneous Interfaces and its Application in Shale Fracking. J. Mech. Phys. Sol. 101, 235–249. doi:10.1016/j.jmps.2016.12.012
Zhi, L., Changgui, J., Chunhe, Y., Yijin, Z., Yintong, G., Shuai, H., et al. (2015). Propagation of Hydraulic Fissures and Bedding Planes in Hydraulic Fracturing of Shale. Chin. J. Rock Mech. Eng. 34, 12–20.
Zhao, H., and Chen, M. (2010). Extending Behavior of Hydraulic Fracture when Reaching Formation Interface. Journal of Petroleum Science and Engineering 74, 26–30. doi:10.1016/j.petrol.2010.08.003
Keywords: shale gas, hydraulic fracturing, bedding interface, vertical fracture, cohesive element
Citation: Xiong D, Ma X, Yang H, Liu Y and Zhang Q (2021) Experimental and Numerical Simulation of Interlayer Propagation Path of Vertical Fractures in Shale. Front. Energy Res. 9:797105. doi: 10.3389/fenrg.2021.797105
Received: 18 October 2021; Accepted: 19 November 2021;
Published: 21 December 2021.
Edited by:
Huazhou Li, University of Alberta, CanadaReviewed by:
Sen Wang, China University of Petroleum (Huadong), ChinaJiayuan He, Sinopec Petroleum Exploration and Production Research Institute, China
Copyright © 2021 Xiong, Ma, Yang, Liu and Zhang. This is an open-access article distributed under the terms of the Creative Commons Attribution License (CC BY). The use, distribution or reproduction in other forums is permitted, provided the original author(s) and the copyright owner(s) are credited and that the original publication in this journal is cited, in accordance with accepted academic practice. No use, distribution or reproduction is permitted which does not comply with these terms.
*Correspondence: Dong Xiong, MzUxNjE4NDI1QHFxLmNvbQ==; Xinfang Ma, bWF4aW5mYW5nQGN1cC5lZHUuY24=; Huanqiang Yang, eWFuZ2h1YW5xaWFuZ0B5YW5ndHpldS5lZHUuY24=
 Dong Xiong
 Xinfang Ma1*
