 Yangqing Dan1
 Shuran Liu
- 1State Grid Zhejiang Economic Research Institute, Hangzhou, China
- 2ABB Power Grids Investment (China) Ltd., Beijing, China
- 3Zhejiang Huayun Clean Energy Ltd, Hangzhou, China
Along with the rapid increase in the number of electric vehicles, more and more EV charging stations tend to have charging infrastructure, rooftop photovoltaic and energy storage all together for energy saving and emission reduction. Compared with individual design for each of the components in such kind of systems, an integrated design can result in higher efficiency, increased reliability, and lower total capital cost. This paper mainly focuses on the tertiary control strategy for dynamic state operation, such as PV generation fluctuation and random arrival/leave of EVs. The tertiary control aims to achieve stable operation under dynamic states, as well as to optimize the energy flow in the station to realize maximal operational benefits with constraints such as peak/valley price of electricity, state of discharge limitation of battery, etc. In this paper, four energy management functions in tertiary control level are proposed, and their performance is verified by simulations. By using prediction of PV power and EV load in the following 72 h, a novel tertiary control logic is proposed to optimize PVC and ESC power flow by changing their droop characteristics, so that minimum operational cost for the station can be achieved. Furthermore, a sensitivity analysis is conducted for three parameters, including ES battery capacity, weather influence, and PV and EV load prediction error. The results from sensitivity analysis indicate that ES battery capacity and weather condition lead to a great impact on the operational cost of the integrated charging station, while a typical prediction error of PV power and EV load will not influence the optimization result significantly.
Introduction
EVs are being promoted in many countries mainly due to environmental concerns and limited oil resource (Lopes et al., 2011; Liu et al., 2021). However, success in EV promotion highly depends on availability of charging facilities (Clement-Nyns et al., 2010; Pieltain Fernández et al., 2011). In China, after a period of slow development of EV charging infrastructure, the development has speeded up in the recent years (Qiu et al., 2019). By June 2020, there were about 1,322,000 charging poles and 35,849 EV charging stations (EVCS) in China, which is almost 50 times those of 2014 (Ou et al., 2020).
Along with the increase in EVCS installation, more and more EVCS tend to have charging infrastructure, rooftop PV, and energy storage (ES) all together for energy/cost saving and emission reduction (Yasn et al., 2019; Yang and Ribberink, 2019; Sierra et al., 2020). With integrated design and control, a system of this kind is referred to as an EVCS integrated with PV and ES (Colak et al., 2015; Liu et al., 2015; Shariff et al., 2020; Singh et al., 2020; Singh et al., 2021). These EVCSs are mainly distributed in medium-/large-scale communities, business parks, and commercial areas (Brenna et al., 2014). Compared with individual design for each of the components in such kind of systems, an integrated design with optimal sizing of each component can result in higher efficiency, increased reliability, and lower total capital cost (Ji et al., 2020; Liu et al., 2020). Similarly, integrated power flow control and energy management strategy for such a system not only can ensure safety and robust operation but also can benefit the operator with higher efficiency, reliability, and profitability (Liao and Lu, 2015; Xie et al., 2015; Badawy and Sozer, 2017; Chaudhari et al., 2018; Tran et al., 2019; Kabir et al., 2020; Verma and Singh, 2020).
This research focuses on an integrated charging station using DC collection bus connected with PV, ES, EVs, and the upper grid of the utility. With the power generation from PV converter, the operational expense for electricity can be reduced (Yan et al., 2019). Furthermore, with the help of the ES system, this integrated charging station can operate in both grid-connected mode and islanded mode; thus, the reliability of this station is improved (Shaaban et al., 2019). The potential benefits are illustrated from four aspects:
• Operational cost: reduces electricity charge and power losses.
• Investment cost: avoids utility upgrade and AC/DC converter for each DC fast charger.
• Performance: improves power flow performance and allows grid-connected/islanded mode smooth transition.
• Reliability: allows islanded operation during blackout and stable operation when PV/EV power fluctuates.
The coordinated control strategy for the integrated EVCS includes three levels as described below. The overview on the relationship of these three levels is shown in Figure 1.
1) Basic droop control is for automatic power distribution between PVC/ESC/UC converters, output (droop) characteristics of converters.
2) Secondary control is for DC bus voltage regulation, output signal Delta 2 with second scale regulating speed.
3) Tertiary control is for energy management, output signal Delta 1 with minute scale regulating speed.
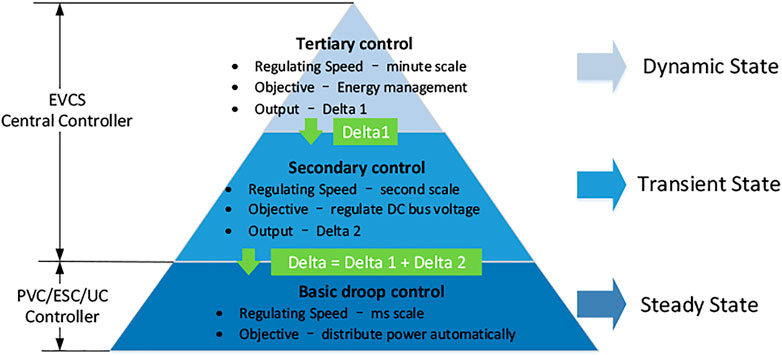
FIGURE 1. Overview of three-level coordinated control system for the integrated charging station.
This paper focuses on the tertiary control strategy for dynamic state operation, such as PV generation fluctuation and random arrival/leave of EVs. The tertiary control aims to achieve stable operation under dynamic states, as well as to optimize the energy flow in the station to realize maximal operational benefits with constraints such as peak/valley price of electricity, SOC limitation of ES battery, etc. In this paper, four energy management functions in tertiary control level are presented, and their performance is verified by simulations. Furthermore, a sensitivity analysis is conducted for three parameters, including ES battery capacity, weather influence, and PV and EV load prediction error.
System Description of Integrated Charging Station
The research object is medium-scale EVCS installed in medium-scale city parking lots, located in front of buildings. The overview of the station layout is shown in Figure 2 (Savio et al., 2019). The specified number and nominal power capacity of each converter are listed in Supplementary Table S1.
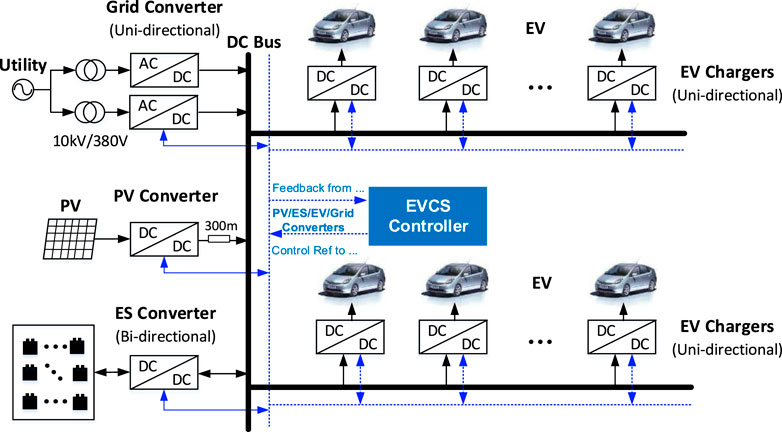
FIGURE 2. Diagram of integrated electric vehicle (EV) charging station.
Since the tertiary control focuses on energy management, the response time scale is on a minute level, and the simulation period is 24 h. To speed up the simulations, only half of the EV chargers (EVCs) are simulated in this modeling. Correspondingly, the nominal power capacity of utility converter (UC), PV converter (PVC), and ES converter (ESC) are also designed as 50% of the specified capacity. Thus, one 150-kW AC/DC utility converter is installed between the utility grid and DC collection bus. The power capacity of PV converter is 50 kW with PV penetration 33% in EVCS. Twelve DC fast chargers are installed, including two EV chargers with a power capacity of 50 kW, and 10 EV chargers with a power capacity of 20 kW. The power capacity of ES converter is 50 kW, which means this integrated EVCS can operate in both grid-connected mode and islanded mode.
Several assumptions and specifications used in this case study were clarified below:
• All the EVs come for charging randomly.
• The station will start EV charging once EV comes.
• The EVs can be fully charged within 1 h by using DC fast chargers.
• The bidirectional power flow of EVs and utility converters are excluded, which means vehicle-to-grid (V2G) or extra PV supply to the grid are not considered.
• The integrated EVCS can operate in both grid-connected mode and islanded mode. ES power is controlled for energy management optimization in grid-connected mode, while ES converter is the main power source for DC bus voltage stabilization and power balance in the station in islanded mode.
Modeling of Integrated electric vehicle Charging Station
Overview
To provide system-level energy management optimization, a MATLAB/Simulink model of medium-scale integrated charging station is built. As mentioned before, tertiary control is the top-level control strategy, and its objective is energy management optimization with regulation speed in minute scale. Thus, a 24-h simulation for energy management control strategy verification is performed. The millisecond scale transient state response of each main component is ignored, so that the sample time of this model is Ts = 0.5 s. Furthermore, all the converters are simplified into controllable DC voltage or current sources with no consideration of their hardware topology (Pinto et al., 2019; Afonso et al., 2020). Several sections are followed to introduce the detailed simulation model of each main component in the station. The overview of this integrated EVCS simulation model is shown in Figure 3.
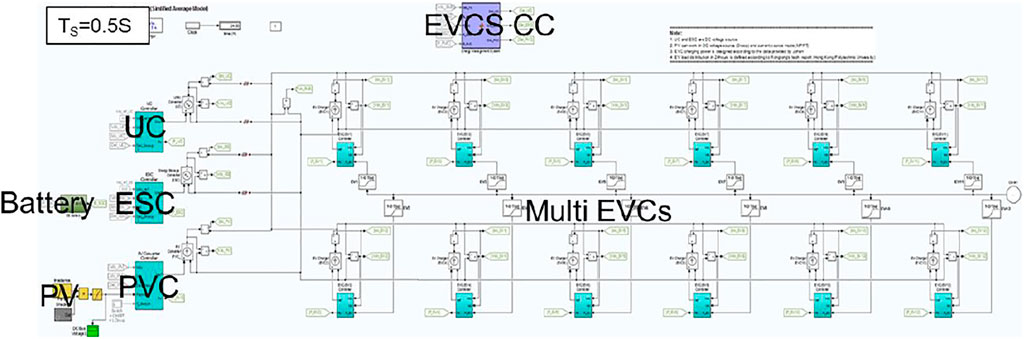
FIGURE 3. Overview of this integrated electric vehicle charging station (EVCS) simulation model.
Utility Converter
A simplified model of utility converter is built for steady state control strategy verification. For power unit part, a controllable DC voltage source is used to simulate the utility converter, as shown in Supplementary Figure S1. Compared with equivalent model for steady state control strategy verification, the three-phase AC sources are ignored. To keep the unidirectional power flow of the utility converter, a diode is connected to the positive pole of the converter in series.
For the control part in the “UC controller” part, a basic droop control method is designed into the converter controller, as shown in Supplementary Figure S2. The droop control method in this modeling is a simplified version with no consideration of millisecond-scale transient state response. The droop characteristic (steady state output characteristic) is the same, but the sample time for simulation verification in this paper is longer with Ts = 0.5 s. As indicated in Figure 1, the control signal Del_Droop (= Delta 1 + Delta 2) is an input signal received from EVCS central controller. During the secondary/tertiary control, this control signal is used to modify the droop characteristics of utility converter, so that the power distribution among different converters can be changed, while the dc bus voltage can be regulated. The control diagram with simplified droop control is shown in Supplementary Figure S2. A PI controller is used for the close loop control of the DC output voltage of UC. After one sample time delay (TDelay), the final output signal Uref is sent to the controllable DC voltage source. Furthermore, an additional PI controller is added for maximum current limitation, which is marked in blue color. When the converter output current reaches the maximum value, this PI will start to work and change the droop characteristic of the converter, so that the utility converter is changed from a DC voltage source to a constant DC current source.
Photovoltaic panel and Converter
The simulation model of PV panel is shown in Supplementary Figure S3. Inside this PV panel model, two submodels are included: the “Irradiance” model is used to simulate the ideal PV panel power when the weather is sunny without any partial shading, while the “Partial Shading” model is used to simulate the partial shading caused by cloud.
The simulation model of PV converter is shown in Supplementary Figure S4. The power unit of PV converter is a controllable DC current source connected to the DC collection bus, where the topology of PV converter is also ignored. The PV panel and PV converter are installed on top of the building beside the EV parking lots, and the cable length from PV converter to EV parking lots is 300 m with a resistance value RPV of 0.1587Ω.
The control diagram of PV converter is shown in Supplementary Figure S5. Besides the typical maximum power point tracking (MPPT) control method, a droop control method is also designed in the PV converter controller. The droop control method of PV converter in this paper is a simplified version with no consideration of millisecond-scale transient state response of each main component. Their droop characteristic (steady state output characteristic) is the same, but the sample time for simulation verification in this paper is longer with Ts = 0.5 s. In some operational status, for example islanding operation with PV converter available only, the PV converter with droop characteristics can help to set up the DC bus voltage in the EVCS.
Assume the current reference calculated by droop control method is Idc_droop and the current reference calculated by MPPT control method is Idc_MPPT. Ignoring the transient state performance of this control method, the output characteristic of PV converter can be summarized as the PV converter output current Iref equals to the minimum value of Idc_droop and Idc_MPPT, as shown in Eq. 1.
To simplify the simulation model, an additional switch is added into the PVC controller, as marked by blue color in Supplementary Figure S5, where Iref is the current reference of controllable DC current source.
Energy Storage Battery and Converter
The simulation model of ES battery and ES converter is shown in Supplementary Figure S6.
A controllable DC current source is connected to the output of battery. Assume the power loss of ES converter is zero; thus, the charging/discharging power of the ES battery is equal to the output power of ESC, and the current reference Ibattery of the controllable DC current source can be calculated in Eq. 2, where P_ES is the real time feedback of output power of ES converter, Vbattery is the real time feedback of output voltage of battery.
The battery is represented by a typical battery model provided by MATLAB/Simulink. In this paper, the battery type is selected to be lithium ion, with rated capacity 150 kWh, nominal voltage 480 V, and initial SOC 50%.
The control diagram of ESC is shown in Supplementary Figure S7. Similar to the simulation model of utility converter, the power unit of ESC is a controllable DC voltage source connected to the DC collection bus, and the control system includes basic droop control with capability of responding to secondary/tertiary control order. Furthermore, as the ES converter is a bidirectional converter, two additional PI controllers are added for maximum charging/discharging current limitation, as shown by the blue color in Supplementary Figure S7. When the converter output current reaches the maximum value, the PI controller will start to work and change the droop characteristic of the converter, so that the ESC is changed from a DC voltage source to a constant DC current source.
Electric vehicle Charger and Load
The simulation model of one EV charger is shown in Supplementary Figure S8. A controllable DC current source is used to simulate the EV charger. Take the charging power curve of Terra 53 as an example to simulate the charging curve of one EV.
A typical pattern of EV arrival is generated according to Liu et al. (2021). Based on this number, the utilization of the EV chargers in the EVCS is shown in Supplementary Figure S9, where the blue color means the corresponding EVC has been occupied, while the white color means the corresponding EVC is available.
Control Strategy Design for Tertiary Control
Overview
With the integration of PV and ES, multiple energy management methods can be applied in the integrated EVCS. In this paper, four energy management functionalities are designed into the EVCS tertiary controller. The overview on these four functionalities can be seen in Table 1. The detailed control strategy design and performance verification results of these four functionalities are introduced in this section.
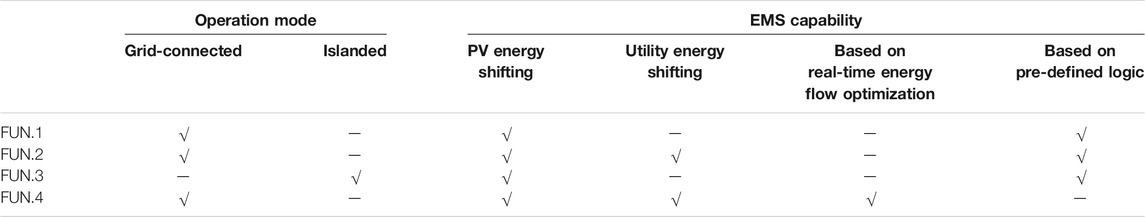
TABLE 1. Overview on the functionalities in tertiary control strategy.
The first functionality (FUN.1) is designed to improve the utilization of PV power in grid-connected mode by shifting PV energy, where ES is used to charge/discharge the extra PV energy when PV power generation capability is bigger/smaller than the EV load requirements of EVCS, so that PV power curtailment can be reduced.
The second functionality (FUN.2) is designed to decrease the operational cost of EVCS by controlling ESC power for both PV and utility energy shifting, where ES is charged from the utility when the electricity price is low and discharged to the EV load when the electricity price is high, so that the electricity charge of the integrated charging station can be reduced.
The third functionality (FUN.3) is designed for energy management in islanded mode with no power contribution from utility. Hence, in some circumstances, the total power capacity of PVC and ESC might be smaller than EV load requirement. If this happens, the converter level control will control the EVCs to disconnect from the dc bus automatically. After the EV load becomes smaller than the power supply, the EVCS central controller should select and re-connect several EVCs to the DC bus. The above three functions are based on a certain pre-defined energy management logic without real-time optimization.
The fourth functionality (FUN.4) is designed for energy flow real-time optimization in grid-connected mode. In FUN.4, the EVCS central controller takes the predicted PV and EV load (EVL) as input parameters, and takes the peak/valley price of electricity price into consideration, and finally calculates the optimal energy flow of the station with the objective of minimum operational cost in 1 day. The detailed energy management logics for FUN.3 and FUN.4 are introduced in the following sections.
Energy Management Logic of First Functionality
To improve the utilization of PV power, the basic energy management logic for minimum PV power curtailment can be seen in Figure 4.
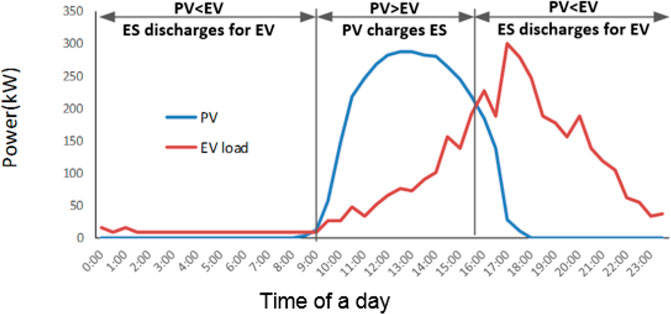
FIGURE 4. Daily photovoltaic (PV) power generation and EV charging load requirement in EVCS
When PV output is larger than EVL during daytime, PV power is used for EV charging with higher priority than the utility grid, and the extra PV power is used to charge the ES when PV power generation is bigger than EV charging load. Furthermore, as we have defined “No Extra PV Power to Grid” in this modeling, PV curtailment is required when PV power generation is bigger than the EV load and ES charging capability.
When PV output is smaller than EVL during nighttime, PV power generation will decrease, and become not enough for EV charging load. In this case, ES will start to discharge its power for EV charging with higher priority than the utility grid.
Energy Management Logic of Second Functionality
The basic logic of this energy management function is similar to FUN.1. The main difference from FUN.1 is the ESC should charge power when the utility price is low, and discharge power with higher priority than the utility converter when the utility price is high. The objective of FUN.2 is to decrease the operational cost of EVCS by controlling ESC power for both PV and utility energy shifting.
Besides the capability to store/release extra PV power in FUN.1, ES can also provide utility energy shifting for further operational cost saving. Take the commercial electricity price in 2014, China as an example, as shown in Figure 5. The energy management control logic for utility energy shifting can be summarized into two parts: 1) Valley electricity price: when electric price is in valley value and ES is not full, ES will start to charge power from PV or utility, but the charging power from PV should have higher priority than the power from utility. 2) Peak electricity price: When electric price is in peak value and ES is not empty, ES will discharge its energy for EV load, but with the installation of PV, the priority of ES discharging should be lower than PV. As ES stores energy with low price, and releases this energy for load when electricity price is high, it will definitely bring operational cost saving for EVCS.
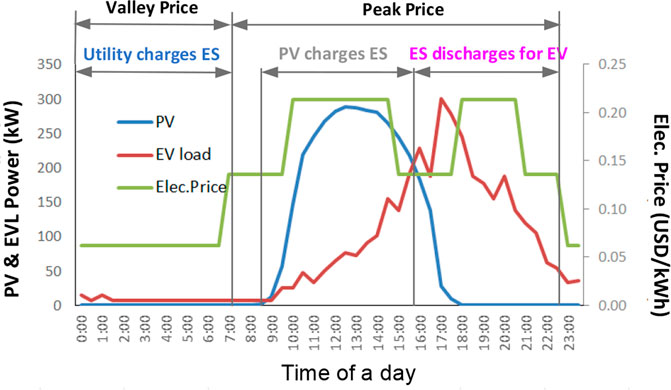
FIGURE 5. Peak-valley electric price, PV and EV load in EVCS
Energy Management Logic of the Third Functionality
FUN.3 mainly focuses on the logic design to restore certain number of EV chargers when PV power generation fluctuates in islanded mode, so that energy management of the station can be realized by using PV power generation with higher priority than ES power. The basic energy management control logic is described below:
For ES converter: Stop the tertiary control of ESC power, where ESC only joins the secondary control with the objective of DC bus voltage regulation. ESC charges/discharges power to keep the power balance of the station. Furthermore, with the limitation of battery SOC, the ESC can only charge power when its battery SOC is smaller than the maximum value, and discharge power when its battery is bigger than the minimum value. To avoid frequent cut-off/reconnection of EVCs, a boundary control of SOC of energy storage (ES_SOC) is used here:
1) If ES_SOC <10%, the ES battery is almost empty, thus, the tertiary controller will stop the EVC reconnection logic. Only EVC cut-off logic is active in the converter level control.
2) If ES_SOC >30%, the ES battery has enough capacity for EV power supply, thus, the tertiary controller will include reconnection logics according to the maximum power generation capacity of the EVCS.
3) If 10% < ES_SOC<30%, the ES battery has limited capability for EV power supply, thus, two different conditions are considered:
• When ES battery is charging from 10% to 30%, the tertiary controller will stop the EVC reconnection logic.
• When ES battery is discharging from 30% to 10%, the tertiary controller will include reconnection logics according to the maximum power generation capacity of the EVCS.
For PV converter: PVC works in MPPT mode when its maximum power generation capacity is smaller than the load requirement of the station, and switches to droop control mode with PV power curtailment when its maximum power generation capacity is bigger than the load requirement of the station. The seamless switch method between MPPT and droop control mode has been introduced in the Energy management logic of FUN.3 section.
For EV converter: As mentioned above, all the EVCs will disconnect from the DC bus voltage automatically when overload in the station happens. The FUN.3 implemented in tertiary controller will select and order part of the EVCs to restore charging according to the maximum power generation capability of PVC and ESC: EV load shedding with limitation ∑P_EVCi<=P_PVC when the SOC is low than minimum (ES_SOC < 10%); EV load recovery/shedding with limitation ∑P_EVCi<=P_PVC + ESCmax when the SOC is enough (ES_SOC > 30%).
The 24-h simulation results of FUN.3 are shown in Figure 6. First, the UC power is always zero, which means that the EVCS is working in islanded mode. Second, the waveform of PVC output power is the same with the input PV panel power which means that there is no PV curtailment. All the PV power generations are used for EVCS power supply. Third, with no contribution from the utility, tertiary controller and the converter level control have limited the EV load to keep the power balance of the station in islanded mode. P_EV is the curve of EV load requirement of EVCS, while EV_cut is the curve of EV load during the real operation. The shadow area marked in Figure 6 is the area between the curve of PV_EV and EV_cut, which is the EV load shedding for power balance. Finally, the enlarged figure in Figure 6 shows that at 6:18 a.m., the overload of the station happens, and all the EVCs are disconnected from the DC bus.
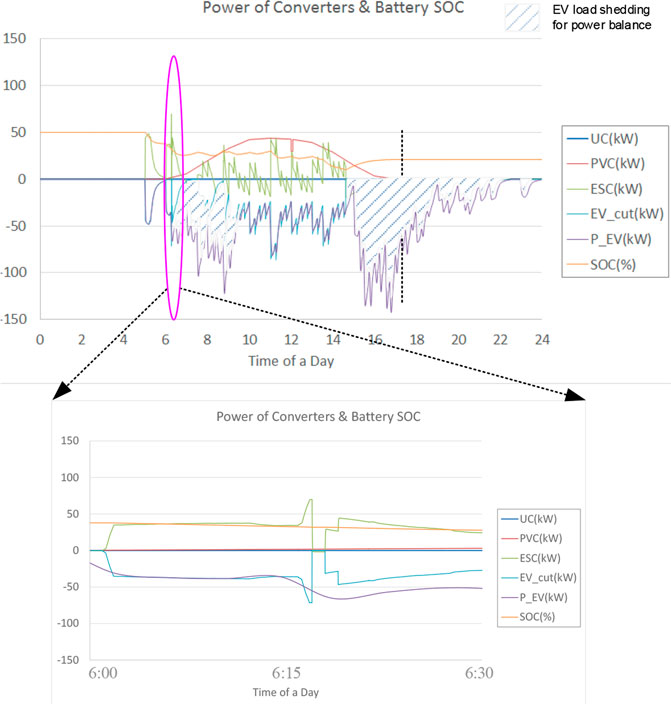
FIGURE 6. Power distribution of each converter in a 24-h simulation of the third functionality (FUN.3).
Energy Management Logic of the Fourth Functionality
FUN.4 is designed for energy flow real-time optimization in grid-connected mode. The objective of FUN.4 is minimum operational cost for the station. The purpose of the real-time optimization is to improve the performance of the energy management strategy FUN2. From the energy management result of FUN.2, as shown in Figure 7, it can be noticed that:
1) Stage 1—from 0:00 a.m. to 2:00 a.m. (midnight): According to the logic of FUN.2, the ES battery should be charged with utility power when the electricity price is in valley value during the midnight. As the ES battery capacity is not big enough, the battery has been fully charged before the sun rises. This fully charging of ES battery during night may lead to a situation that there is little space to store the extra PV power during the day. This will lead to an increase in PV curtailment and, thus, operational cost of the station.
2) Stage 2—from 13:00 p.m. to 17:00 p.m. (afternoon): Also according to the logic of FUN.2, the ES battery should discharge power with higher priority than utility for the load, but the electricity price from 13:00 p.m. to 17:00 p.m. is actually lower than the next 2 h. Thus, it is better to stop the battery discharging from 13:00 p.m. to 17:00 p.m., and save the battery energy in this period to be used from 18:00 p.m. to 20:00 p.m.. This kind of energy optimization can help the station to save more operational cost.
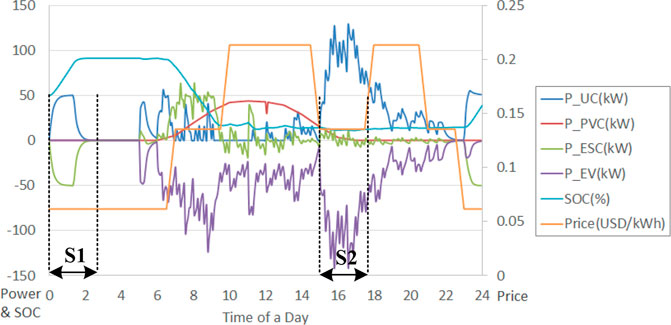
FIGURE 7. Power distribution of each converter in a 24-h simulation of the second functionality (FUN.2).
These two stages are only two examples for further energy flow optimization in grid-connected mode. Different from the FUN.1 and FUN.2, charging of ES battery in FUN.4 is decided by the prediction of PV power generation and EV load requirement. If the prediction result is that the PV power generation during the day is much bigger than the EV load, then the ES battery should be less or even not charged during the night. If the prediction result is that the PV power generation during the day is much smaller than the EV load, then the ES battery should be fully charged for maximum operational cost saving. Furthermore, discharging of ES battery in FUN.4 should pick the time period when electricity price is in higher value, so that the operational cost of the station can be further saved.
The energy flow optimization of FUN.4 includes two parts: the main function for optimized ESC power calculation with the objective of minimum operational cost and subfunction for operational cost calculation. The detailed information of these parts is introduced in this section.
Main Function
As mentioned above, the objective of this main function is to optimize the energy flow of EVCS, so that the operational cost of the station is in minimum value. The input parameters of the main function include the PV power prediction values PVC(i) and EV load prediction values EVL(i). The output of this main function is the average ESC power in 1 h ESC(i), totally 72 output values for the following 72 h, x(i); i = 1,2 … 72.
This main function uses a typical optimization function “fmincon” in optimization toolbox of Matlab. The function expression of main function in this paper is designed as Eq. 3.
where @FUN4 is the sub function for operational cost calculation; A, B, [], [], lb, ub are the constraints of ESC(i) obtained from the following limitations:
The final output of this main function is the array of average ESC power in 1 h, which includes 72 output values for the following 72 h, x(i); i = 1,2 … 72. This array x(i) fits the constrains listed in Eq. 4, and can input x(i) into the sub function @FUN4, the calculated operational cost of the EVCS is in minimum value.
Subfunction
The objective of subfunction FUN4(x) is to calculate the operational cost of EVCS in 24 h. The detailed flowchart of FUN4(x) is shown in Figure 8. The input array x(i) is the average ESC power in 1 h, which includes 72 values for the following 72 h, x(i); i = 1,2 … 72, and the output FUN4(x) is the operational cost in 1 day. This operational cost includes the cost from electric charge and battery degradation.
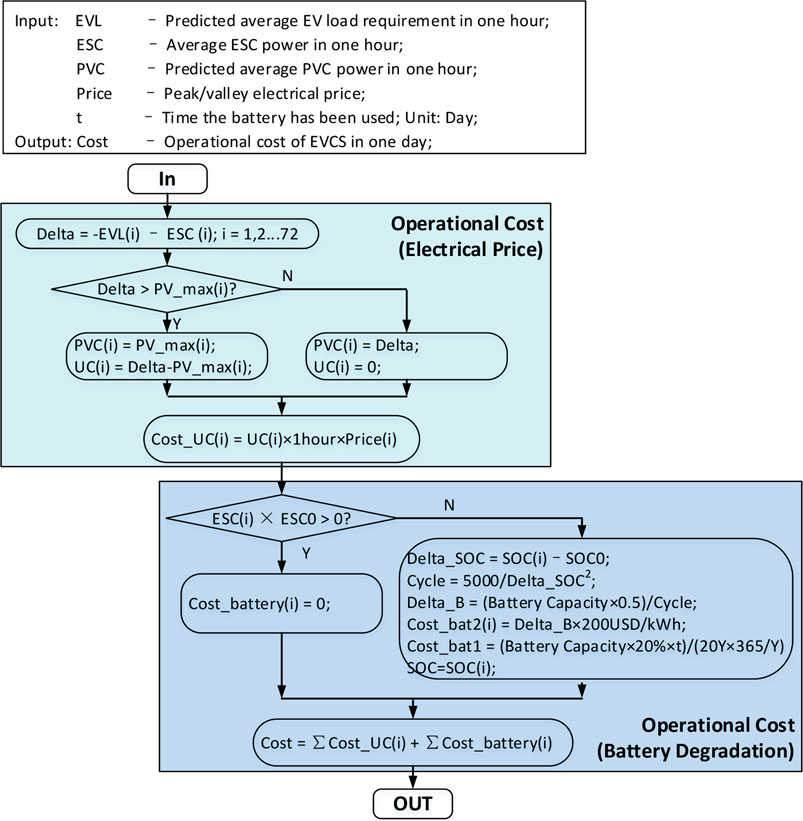
FIGURE 8. Detailed flowchart of the fourth functionality (FUN4).
Operational cost for electric charge )
According to the ESC power x(i), predicted PV power generation PVC(i) and EV load requirement EVL(i), the average UC power UC(i) in each hour is calculated first. Then the operational cost for electricity bill Cost_UC(i) in each hour can be calculated with consideration of peak/valley price.
Operational cost for battery degradation
Besides the operational cost for electricity charge, the degradation of ES battery is another main component for operational cost of the station. Two kinds of degradation are considered here:
1) Degradation Caused by Shelf Life
According to related literature (Shen et al., 2014), shelf life of ES battery is a linear effect. Normally it is defined as the time till the battery is degraded to 80%. Assume the battery with a shelf life of 20 years, each year the battery will experience 1% degradation. Thus, the shelf life of battery can be calculated as Eq. 5, where ∆Cshelf(t) is the degradation of battery capacity caused by shelf life in t days, Cap0 is the initial capacity of new battery, Shelf Life = 20*365 = 7,300 days where the unit of t is day.
2) Degradation caused by charging/discharging battery
The battery degradation estimation caused by the charging/discharging battery has already been used and introduced in many related literature (Stroe et al., 2016; Xu et al., 2018; Wang et al., 2020). According to their findings and the design specifications, the lifecycle of Li ion battery is about 5,000 cycles when its depth of discharge (DOD) is 100%. This lifecycle was tested with constant discharging rate (1C) in each charging and discharging cycle during the whole lifetime. With constant DOD, the capacity loss in one charging/discharging cycle can be estimated as the reciprocal of the life cycle number, but in real application, the DOD of ES battery is fluctuant. To estimate the capacity loss of ES battery based on this fluctuant DOD, the SOC change of ES battery within each continuous charging or discharging period (even if the charging or discharging rate varies in this period) is calculated. The SOC change in the ith period is denoted as ΔSOCi.
Assume the battery is charged or discharged with a constant depth of discharge (DOD) of ΔSOCi, The corresponding lifecycle (Cyclei) can be calculated in Eq. 6, where Cycle0 = 5,000 is the life cycle of battery when DODi = 100%, DODi = ∆SOCi.
Then the battery capacity loss (∆Capi) caused by the ith charging or discharging period can be estimated in Eq. 7, where Cap0 is the initial capacity of fresh new battery, the factor of 0.5 is applied considering that the ith period only covers either a charging or a discharging process, not both.
The sum value of ∆Cshelf(t) and Ʃ∆Capi is the final degradation of battery capacity in t days. Assume the battery price is 200 $/kWh, then the ES battery operation cost caused by$ battery degradation can be expressed in Eq. 8.
Simulation Result Analysis
This section first provides a comparison of the performance of functionalities in tertiary controller, so that their advantage and disadvantage on station-level operational cost saving can be seen. Second, as the optimization result are influenced by multiple input parameters, to analyze the influence of input parameters, sensitivity study is carried out to see the impact of the three parameters on the operational cost of the station. They are the ES battery capacity, the weather condition, and the PV and EVL prediction error.
Solution Comparison
FUN.1, FUN.2, and FUN.4 are energy management methods used in grid-connected mode, while FUN.3 is used in islanded mode. The operational cost for the station mainly includes two parts: electric cost for utility power consumption and equipment expense for battery degradation. As there is no electric cost for utility power consumption in FUN.3, this section mainly focuses on the operational cost comparison among FUN.1, FUN.2, and FUN.4.
The power flow of each converters by using FUN.1, FUN.2, and FUN.4 are shown in Figure 9. It is obvious that there is no PV curtailment in these three cases, but the power curves of UC and ESC are different. With consideration of peak/valley electricity price and ES battery degradation, the difference on UC and ESC power will lead to different operational cost of station, as shown in Table 2. FUN.1 has the longest battery life with the least ES battery charging or discharging frequency. Thus, the equipment expense of FUN 1 for battery degradation is smallest, but its operational cost of station is biggest. Fun.2 has the shortest battery life with the biggest ES battery charging or discharging frequency. Thus, its equipment expense for battery degradation is the biggest, but its operational cost of the station is smaller than FUN.1. Fun.4 is the best solution with the smallest operational cost for the station.
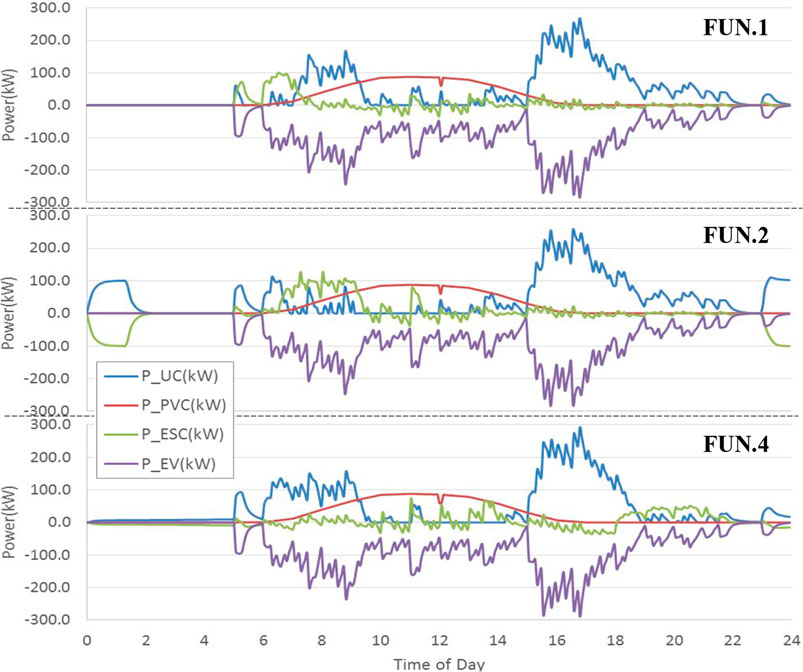
FIGURE 9. Power flow of each converter using FUN.1, FUN.2, and FUN.4.
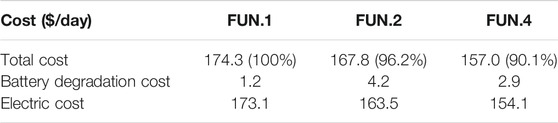
TABLE 2. Operation cost of station between different functionalities.
Comparing the simulation results of FUN.2 to FUN.4, the ES battery are not fully charged during midnight, as shown in Figure 10, so that the extra PV power in the noon can be charged into the ES battery. Furthermore, the real time feedback of ESC power follows the fluctuation of PV and EV load requirement, while the average power of ESC in each hour follows the optimized ESC average power reference of tertiary controller.
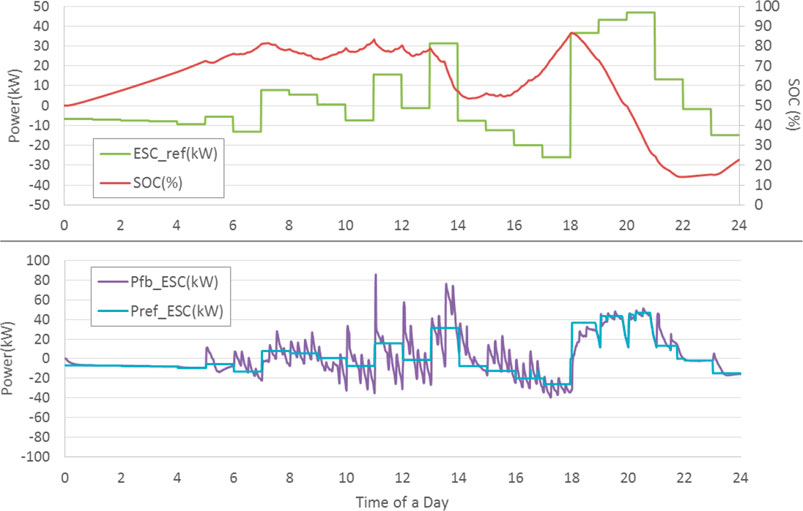
FIGURE 10. Optimized energy storage converter (ESC) power and ESC power feedback using FUN.4.
Impact of Battery Capacity, Weather, photovoltaic and electric vehicle Load Prediction Error
Battery Capacity
The installation of ES battery can help to store extra PV power for PV energy shifting and store utility energy with valley price for utility energy shifting. These two energy-shifting operations can both help to limit the operational cost of the station. The sensitivity study in this section mainly focuses on the influence of ES battery capacity, as shown in Table 3.
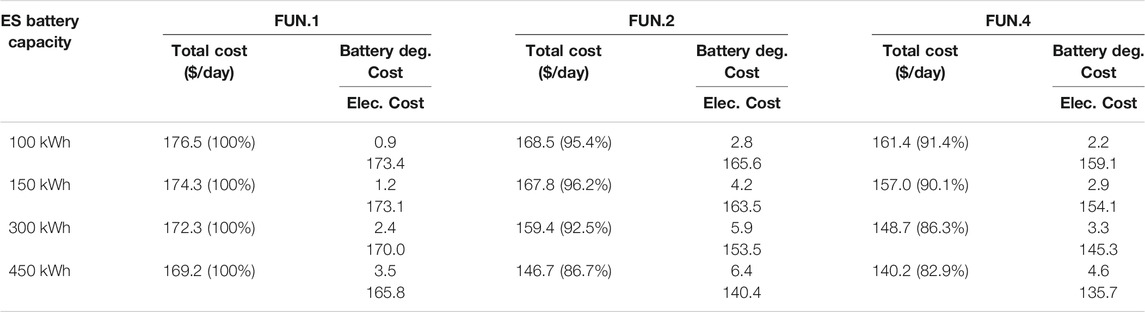
TABLE 3. Operation cost of station under battery capacity sensitivity study.
It can be seen that: along with the increase in ES battery capacity, the operational cost of station is decreasing, no matter which energy management functionality is used in the tertiary controller. This is because the increase in ES battery capacity means the increase in ES energy shifting capability. With more PV or utility energy shifting provided by ES battery, the operational cost of the station is decreased, but it should be noticed that, though the increase in ES battery capacity can help to decrease the operational cost of the station, it can also lead to the increase in the capital cost of the station. Both operational cost and capital cost can influence the economic benefit of the station. Thus, the ES battery capacity design requires consideration of both operational cost and capital cost of the station. Furthermore, similar to the conclusions introduced in the Solution comparison section, with the same battery capacity, FUN.4 has the best operational cost than FUN.1 and FUN.2. Thus, FUN.4 with a 450-kWh battery has the most benefit operational cost for the station.
Weather
The second sensitivity study is about the influence of weather. Different from other kinds of power generation sources, the PV power generation capability changes a lot in different weather conditions. This difference of PV energy in 1 day will lead to the change of operational cost of the station. Thus, the performance of FUN.1, FUN.2, and FUN.4 in different weather conditions should be analyzed.
This section picks four kinds of typical weathers in 1 year as examples, including cloudy, sunny (summer season), sunny (winter season) and rainy day. The typical PV power generation curves in these four kinds of weather are shown in Supplementary Figure S10. It can be seen that the PV power generation in different weather changes a lot. As the input of FUN.4 is the average PV power prediction in each hour, the difference between predicted and real PV power generation curve is very big, and this will influence the energy flow optimization performance of FUN.4.
The operational cost of the station when FUN.1, FUN.2, and FUN.4 is used in EVCS central controller are shown in Table 4. It can be seen that:
• By using the same energy management functionality, the operational cost on a sunny day (summer season) is always at a minimum value because the PV energy in this weather is at the maximum value.
• On the other hand, by using the same energy management functionality, the operational cost on a rainy day is always at the maximum value because the PV energy on a rainy day is small, but the battery degradation speed of FUN.1 on a rainy day is the smallest because less extra PV power is charged into the ES battery on a rainy day.
• Though the optimization performance of FUN.4 is always better than FUN.1 and FUN.2 in these four kinds of weather, the difference of operational cost between FUN.4 and FUN.1 on a sunny day (winter season) is biggest. This means that the advantage of FUN.4 in this weather is biggest.
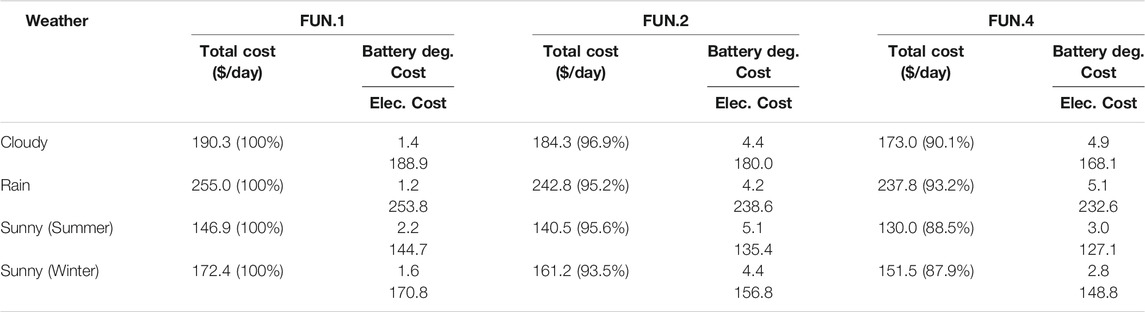
TABLE 4. Operation cost of station under different weather conditions.
Photovoltaic and electric vehicle Load Prediction Error
Different from FUN.1 and FUN.2, FUN.4 requires the predicted PV and EVL curve as input parameter for energy flow optimization. Thus, the accuracy of PV and EVL prediction will influence the optimization result of FUN.4. The operational costs of the station when FUN.4 is used in EVCS central controller are shown in Table 5. The operational cost of the station increases less than 2%, when PV or EVL prediction error used in FUN.4 is ±15%, which is a typical value (Majidpour et al., 2016; Shah et al., 2021). It means a typical prediction error will not influence the optimization result significantly. FUN.4 is providing a very good operational performance for the station.
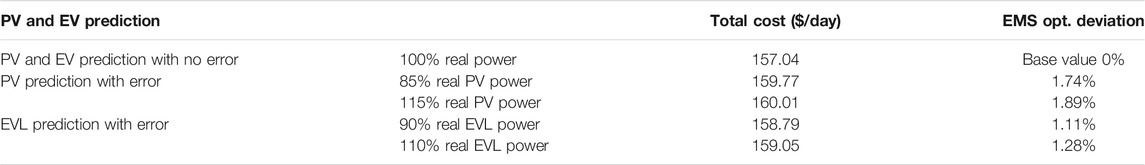
TABLE 5. Operation cost of station under photovoltaic (PV) and electric vehicle load (EVL) prediction error.
Conclusion
The tertiary control strategy for integrated charging station is designed in this paper, so that the operational cost of the station can be saved by the energy flow optimization. Four energy management functionalities of tertiary control are presented, and their performance are verified by using corresponding simulation models:
1) Fun.1—ES control for PV energy shifting in grid-connected mode
Tertiary controller controls the ES power by changing the droop characteristics of ESC, so that the ES battery can charge/discharge extra PV power when PV power generation capability is bigger/smaller than EV load.
2) Fun.2—ES control for utility and PV energy shifting in grid-connected mode
Tertiary controller controls the ES power by changing the droop characteristics of ESC, so that the ES battery can charge power from the utility when the electricity price is low and discharge power to the EV when the electricity price is high in addition to the PV energy shifting as in FUN. 1.
3) Fun.3—ES control for PV energy shifting in islanded mode
With no power contribution from utility in islanded mode, in some circumstances, the total power capacity of PVC and ESC might be smaller than EV load requirement. If this happens, the converter level control will control the EVCs to disconnect from the dc bus automatically. After the EV load becomes smaller than the power supply, the EVCS central controller should select and re-connect several EVCs to the DC bus. Furthermore, tertiary controller should control ES power to charge/discharge extra PV power when PV power generation capability is bigger/smaller than EV load.
4) Fun.4—ES control with energy flow optimization in grid-connected mode
By using prediction of PV power and EV load in the following 72 h, tertiary controller optimizes PVC and ESC power flow by changing their droop characteristics, so that minimum operational cost for the station can be achieved.
The comparison of these four functionalities shows that FUN.4 can provide the best energy optimization with smallest operational cost for the station. The sensitivity study of the three parameters shows the following: 1) ES battery capacity. Larger ES battery capacity can help to reduce the operational cost of the integrated charging station. 2) Weather influence. The sunny weather in summer season has the smallest operational cost in 1 year, while the rainy weather has the biggest operation cost of the station. 3) PV and EV load prediction error. The simulation results show that, with a typical prediction error of ±15%, the operational cost of the station will increase <2%. It means a typical prediction error will not influence the optimization result significantly.
The proposed four energy management functionalities can be used for tertiary control in the actual integrated EV charging station depending on different availability of site conditions, data prediction, and operational status. Also, the sensitivity study provides the developers with more informed suggestions on the sizing of ES battery, the installation of prediction devices, and the expected impact from weather condition. Future work around economics, optimal sizing, and configuration can be continued based on the modeling and proposed energy management functionalities in this paper.
Data Availability Statement
The raw data supporting the conclusion of this article will be made available by the authors, without undue reservation.
Author Contributions
SL conceptualized the study and wrote the original draft of the manuscript. SL and YD were in charge of the methodology. HX and YZ reviewed, edited, and wrote the manuscript. HX supervised the study.
Funding
This research was funded by the State Grid Zhejiang Economic Research Institute under the research project Research on the Regulation Capability Construction of Renewable Plants (JY02202107).
Conflict of Interest
SL and HX were employed by ABB Power Grids Investment (China) Ltd. YZ was employed by Zhejiang Huayun Clean Energy Ltd.
The remaining authors declare that the research was conducted in the absence of any commercial or financial relationships that could be construed as a potential conflict of interest.
Publisher’s Note
All claims expressed in this article are solely those of the authors and do not necessarily represent those of their affiliated organizations, or those of the publisher, the editors, and the reviewers. Any product that may be evaluated in this article, or claim that may be made by its manufacturer, is not guaranteed or endorsed by the publisher.
Supplementary Material
The Supplementary Material for this article can be found online at: https://www.frontiersin.org/articles/10.3389/fenrg.2021.793553/full#supplementary-material
References
Afonso, J. L., Cardoso, L. A. L., Pedrosa, D., Sousa, T. J. C., Machado, L., Tanta, M., et al. (2020). A Review on Power Electronics Technologies for Electric Mobility. Energies 13 (23), 6343. doi:10.3390/en13236343
Badawy, M. O., and Sozer, Y. (2017). Power Flow Management of a Grid Tied PV-Battery System for Electric Vehicles Charging. IEEE Trans. Ind. Applicat. 53 (2), 1347–1357. doi:10.1109/TIA.2016.2633526
Brenna, M., Dolara, A., Foiadelli, F., Leva, S., and Longo, M. (2014). Urban Scale Photovoltaic Charging Stations for Electric Vehicles. IEEE Trans. Sustain. Energ. 5 (4), 1234–1241. doi:10.1109/TSTE.2014.2341954
Chaudhari, K., Ukil, A., Kumar, K. N., Manandhar, U., and Kollimalla, S. K. (2018). Hybrid Optimization for Economic Deployment of ESS in PV-Integrated EV Charging Stations. IEEE Trans. Ind. Inf. 14 (1), 106–116. doi:10.1109/TII.2017.2713481
Clement-Nyns, K., Haesen, E., and Driesen, J. (2010). The Impact of Charging Plug-In Hybrid Electric Vehicles on a Residential Distribution Grid. IEEE Trans. Power Syst. 25 (1), 371–380. doi:10.1109/TPWRS.2009.2036481
Colak, I., Bayindir, R., Aksoz, A., Hossain, E., and Sayilgan, S. (2015). Designing a Competitive Electric Vehicle Charging Station With Solar PV and Storage. IEEE International Telecommunications Energy Conference INTELEC, 1–6. doi:10.1109/INTLEC.2015.7572480
Ji, D., Lv, M., Yang, J., and Yi, W. (2020). Optimizing the Locations and Sizes of Solar Assisted Electric Vehicle Charging Stations in an Urban Area. IEEE Access. 8, 112772–112782. doi:10.1109/ACCESS.2020.3003071
Kabir, M. E., Assi, C., Tushar, M. H. K., and Yan, J. (2020). Optimal Scheduling of EV Charging at a Solar Power-Based Charging Station. IEEE Syst. J. 14 (3), 4221–4231. doi:10.1109/JSYST.2020.2968270
Liao, Y.-T., and Lu, C.-N. (2015). Dispatch of EV Charging Station Energy Resources for Sustainable Mobility. IEEE Trans. Transp. Electrific. 1 (1), 86–93. doi:10.1109/TTE.2015.2430287
Liu, G., Xue, Y., Chinthavali, M. S., and Tomsovic, K. (2020). Optimal Sizing of PV and Energy Storage in an Electric Vehicle Extreme Fast Charging Station. IEEE Power & Energy Society Innovative Smart Grid Technologies Conference (ISGT), 1–5. doi:10.1109/ISGT45199.2020.9087792
Liu, S., Cheng, M., Xing, Q., Jiang, Y., Xiang, Q., and Xie, H. (2021). Increasing Electric Vehicle Penetration Using Smart Switching and Emergency Uprating. Front. Energ. Res. 9, 672721. doi:10.3389/fenrg.2021.672721
Liu, Y., Tang, Y., Shi, J., Shi, X., Deng, J., and Gong, K. (2015). Application of Small-Sized SMES in an EV Charging Station With DC Bus and PV System. IEEE Trans. Appl. Supercond. 25 (3), 1–6. doi:10.1109/TASC.2014.2374174
Lopes, J. A. P., Soares, F. J., and Almeida, P. M. R. (2011). Integration of Electric Vehicles in the Electric Power System. Proc. IEEE 99 (1), 168–183. doi:10.1109/JPROC.2010.2066250
Majidpour, M., Qiu, C., Chu, P., Pota, H. R., and Gadh, R. (2016). Forecasting the EV Charging Load Based on Customer Profile or Station Measurement? Appl. Energ. 163, 134–141. doi:10.1016/j.apenergy.2015.10.184
Ou, S., Lin, Z., He, X., Przesmitzki, S., Bouchard, J., and “, (2020). Modeling Charging Infrastructure Impact on the Electric Vehicle Market in China. Transportation Res. D: Transport Environ. 81, 102248. doi:10.1016/j.trd.2020.102248
Pieltain Fernández, L., Gomez San Roman, T., Cossent, R., Mateo Domingo, C., and Frías, P. (2011). Assessment of the Impact of Plug-In Electric Vehicles on Distribution Networks. IEEE Trans. Power Syst. 26 (1), 206–213. doi:10.1109/TPWRS.2010.2049133
Pinto, J., Monteiro, V., Exposto, B., Barros, L., Sousa, T., Monteiro, L., et al. (2019). Power Electronics Converters for an Electric Vehicle Fast Charging Station with Energy Storage System and Renewable Energy Sources. EAI Endorsed Trans. Energ. Web. 7 (25), 161749. doi:10.4108/eai.13-7-2018.161749
Qiu, Y. Q., Zhou, P., and Sun, H. C. (2019). Assessing the Effectiveness of City-Level Electric Vehicle Policies in China. Energy Policy 130, 22–31. doi:10.1016/j.enpol.2019.03.052
Savio, D. A., Juliet, V. A., Chokkalingam, B., Padmanaban, S., Holm-Nielsen, J. B., and Blaabjerg, F. (2019). Photovoltaic Integrated Hybrid Microgrid Structured Electric Vehicle Charging Station and its Energy Management Approach. Energies 12 (1), 168. doi:10.3390/en12010168
Shen, J., Dusmez, S., and Khaligh, A. (2014). Optimization of Sizing and Battery Cycle Life in Battery/Ultracapacitor Hybrid Energy Storage Systems for Electric Vehicle Applications. IEEE Trans. Ind. Inf. 10, 2112–2121. doi:10.1109/TII.2014.2334233
Shaaban, M. F., Mohamed, S., Ismail, M., Qaraqe, K. A., and Serpedin, E. (2019). Joint Planning of Smart EV Charging Stations and DGs in Eco-Friendly Remote Hybrid Microgrids. IEEE Trans. Smart Grid. 10 (5), 5819–5830. doi:10.1109/TSG.2019.2891900
Shah, A. A., Ahmed, K., Han, X., and Saleem, A. (2021). A Novel Prediction Error-Based Power Forecasting Scheme for Real PV System Using PVUSA Model: A Grey Box-Based Neural Network Approach. IEEE Access. 9, 87196–87206. doi:10.1109/ACCESS.2021.3088906
Shariff, S. M., Alam, M. S., Ahmad, F., Rafat, Y., Asghar, M. S. J., and Khan, S. (2020). System Design and Realization of a Solar-Powered Electric Vehicle Charging Station. IEEE Syst. J. 14 (2), 2748–2758. doi:10.1109/JSYST.2019.2931880
Sierra, A., Gercek, C., Geurs, K., and Reinders, A. (2020). Technical, Financial, and Environmental Feasibility Analysis of Photovoltaic EV Charging Stations With Energy Storage in China and the United States. IEEE J. Photovoltaics 10 (6), 1892–1899. doi:10.1109/JPHOTOV.2020.3019955
Singh, B., Verma, A., Chandra, A., and Al Haddad, K. (2020). Implementation of Solar PV- Battery and Diesel Generator Based Electric Vehicle Charging Station. IEEE Trans. Ind. Applicat. 56 (4), 1. doi:10.1109/TIA.2020.2989680
Singh, S., Chauhan, P., and Jap Singh, N. (2021). Feasibility of Grid-Connected Solar-Wind Hybrid System With Electric Vehicle Charging Station. J. Mod. Power Syst. Clean Energ. 9 (2), 295–306. doi:10.35833/MPCE.2019.000081
Stroe, D.-I., Swierczynski, M., Stroe, A.-I., Laerke, R., Kjaer, P. C., and Teodorescu, R. (2016). Degradation Behavior of Lithium-Ion Batteries Based on Lifetime Models and Field Measured Frequency Regulation Mission Profile. IEEE Trans. Ind. Applicat. 52 (6), 5009–5018. doi:10.1109/TIA.2016.2597120
Tran, V. T., Islam, M. R., Muttaqi, K. M., and Sutanto, D. (2019). An Efficient Energy Management Approach for a Solar-Powered EV Battery Charging Facility to Support Distribution Grids. IEEE Trans. Ind. Applicat. 55 (6), 6517–6526. doi:10.1109/TIA.2019.2940923
Verma, A., and Singh, B. (2020). Multimode Operation of Solar PV Array, Grid, Battery and Diesel Generator Set Based EV Charging Station. IEEE Trans. Ind. Applicat. 56 (5), 5330–5339. doi:10.1109/TIA.2020.3001268
Wang, S., Liu, S., Yang, F., Bai, X., Wang, S., and Yue, C. (2020). Novel Power Allocation Approach in a Battery Storage Power Station for Aging Minimization. Front. Energ. Res. 7, 166. doi:10.3389/fenrg.2019.00166
Xie, D., Chu, H., Gu, C., Li, F., and Zhang, Y. (2015). A Novel Dispatching Control Strategy for EVs Intelligent Integrated Stations. IEEE Trans. Smart Grid. 8 (2), 1. doi:10.1109/TSG.2015.2463819
Xu, B., Oudalov, A., Ulbig, A., Andersson, G., and Kirschen, D. S. (2018). Modeling of Lithium-Ion Battery Degradation for Cell Life Assessment. IEEE Trans. Smart Grid. 9 (2), 1131–1140. doi:10.1109/TSG.2016.2578950
Yan, Q., Zhang, B., and Kezunovic, M. (2019). Optimized Operational Cost Reduction for an EV Charging Station Integrated With Battery Energy Storage and PV Generation. IEEE Trans. Smart Grid. 10 (2), 2096–2106. doi:10.1109/TSG.2017.2788440
Yang, L., and Ribberink, H. (2019). Investigation of the Potential to Improve DC Fast Charging Station Economics by Integrating Photovoltaic Power Generation And/or Local Battery Energy Storage System. Energy 167, 246–259. doi:10.1016/j.energy.2018.10.147
Glossary
∆Capi Battery capacity loss caused by the ith charging or discharging period, kWh
∆Cshelf(t) Degradation of battery capacity caused by shelf life in t days
Cap0 Initial capacity of fresh new battery, kWh
CapES Capacity of energy storage, kWh
CC Central Controller
Cost_B Battery degradation cost of EVCS, $
Cost_battery(i) Operational cost for battery degradation in hour i, $
Cost_E Electric charge cost of EVCS, $
Cost_T Total operational cost of EVCS, $
Cost_UC(i) Operational cost for electric charge in hour i, $
Cycle0 Lifecycle of battery when DODi = 100%
Cyclei Corresponding lifecycle of battery in the ith period
Del_Droop Input signal received from central controller (=Delta 1 + Delta 2)
Delta 1 Output signal from tertiary control
Delta 2 Output signal from secondary control
DOD Depth of Discharge for energy storage
DODi Depth of discharge in the ith period
ES Energy Storage
ES_SOC State of Charge for Energy Storage
ESC Energy Storage Converter
ESC(i) Average ESC output power in hour i, kW
ESCmax Maximum output power of ES converter, kW
ESCmin Minimum output power of ES converter, kW
EV Electric Vehicle
EV_cut EV load during the real operation, kW
EVCS Electric Vehicle Charging Station
EVL EV Load
EVL(i) EV load prediction values in hour i, kW
Ibattery Battery’s current reference of the controllable DC current source, A
Idc DC output current, A
Idc_droop Current reference calculated by droop control method, A
Idc_MPPT Current reference calculated by MPPT control method, A
Iref Current reference of controllable DC current source, A
MPPT Maximum Power Point Tracking
P_ES Output power of ES converter, W
P_EV EV load requirement of EVCS, kW
P_EVCi Output power of EV converter i, W
P_PVC Output power of PV converter, W
Price(i) Electricity price in hour i, $
PV Photovoltaic
PVC Photovoltaic Converter
PVC(i) PV power prediction values in hour i, kW
PVmax(i) Maximum PV output power in hour i, kW
RPV cable resistance value from PV converter to EV parking lots, Ω
SOC State of Charge for energy storage
SOC(0) State of charge in initial time 0
SOC(i) State of charge in hour i
SOCmax Maximum state of charge in hour i
SOCmin Minimum state of charge in hour i
TDelay Sample time delay, s
Ts Sample time of this model, s
UC Utility Converter, also called grid converter
UC(i) UC output power in hour i, kW
UCmax Maximum output power of utility converter, kW
Udc DC output voltage, V
Uref Voltage reference of controllable DC voltage source, V
V2G Vehicle-to-Grid
Vbattery Output voltage of battery, V
x(i) Array of average ESC power in the following 72 h, i = 1,2 … 72
ΔSOCi SOC change in the ith period
Keywords: energy management, electric vehicles, energy storage, integrated charging station, photovoltaic, tertiary control
Citation: Dan Y, Liu S, Zhu Y and Xie H (2022) Tertiary Control for Energy Management of EV Charging Station Integrated With PV and Energy Storage. Front. Energy Res. 9:793553. doi: 10.3389/fenrg.2021.793553
Received: 12 October 2021; Accepted: 19 November 2021;
Published: 03 January 2022.
Edited by:
Vitor Monteiro, University of Minho, PortugalReviewed by:
Anjeet Verma, The University of Sheffield, United KingdomTek Tjing Lie, Auckland University of Technology, New Zealand
Copyright © 2022 Dan, Liu, Zhu and Xie. This is an open-access article distributed under the terms of the Creative Commons Attribution License (CC BY). The use, distribution or reproduction in other forums is permitted, provided the original author(s) and the copyright owner(s) are credited and that the original publication in this journal is cited, in accordance with accepted academic practice. No use, distribution or reproduction is permitted which does not comply with these terms.
*Correspondence: Shuran Liu, c2h1cmFuLmxpdUBoaXRhY2hpZW5lcmd5LmNvbQ==