 Sen Qiao1
 Kai Quan Zhang
95% of researchers rate our articles as excellent or good
Learn more about the work of our research integrity team to safeguard the quality of each article we publish.
Find out more
ORIGINAL RESEARCH article
Front. Energy Res. , 14 December 2021
Sec. Sustainable Energy Systems
Volume 9 - 2021 | https://doi.org/10.3389/fenrg.2021.789871
This article is part of the Research Topic Progress Towards Achieving Cross-Regional Carbon Mitigation Targets View all 14 articles
With the improvement of China’s carbon emission trading system, the spillover effect between carbon and energy markets is becoming more and more prominent. This paper selects four representative pilot carbon markets, including Beijing (BEA), Guangdong (GDEA), Hubei (HBEA) and Shanghai (SHEA). And three representative energy markets, including Crude Oil Futures (SC), power index (L11655) and China Securities new energy index (NEI). Combining the rolling window technology with DY spillover index, set a 50-weeks rolling window to measure the spillover index, and deeply analyze the time-varying two-way spillover effect between China’s carbon and energy markets. The results show that the spillover effect between China’s carbon and energy markets has significant time variability and two-way asymmetry. The time-varying spillover effect of different carbon pilot markets on the energy market has regional heterogeneity. The volatility spillover effect of Beijing and Shanghai carbon markets mainly comes from the crude oil futures market, Guangdong carbon market mainly comes from the new energy market, and Hubei carbon market mainly comes from crude oil and electricity market. The above research results contribute to the prevention of potential risk spillover between carbon and energy markets, which can promote the establishment of China’s unified carbon market and the prevention of systemic financial risks in energy market.
Climate change brought about by the increase of carbon emissions poses a serious threat to the ecosystem. As the world’s largest energy consumer and carbon emitter, China attaches great importance to the energy and environmental problems caused by carbon emissions and actively participates in the construction of the global climate governance system (Mansanet-Bataller., 2007; Liu and Chen, 2013). The proposal of “double carbon” goal and the establishment of carbon market are broad and profound changes in the energy system (Sandra and Jūratė, 2018; Wang et al., 2021). Carbon market is widely regarded as an effective policy means to control global carbon emissions (Liu et al., 2021; Chen and Lin, 2021), which has a far-reaching impact on high emission industries, especially the thermal power industry (Todd et al., 2019; Qi et al., 2021). Generally, raising the carbon price can reduce the carbon emission of the thermal power industry (Jonathan et al., 2013; Zhu et al., 2017). China is dominated by thermal power, and more than 80% of carbon emissions come from the use of fossil energy (Gallego-Alvarez et al., 2015; Zhao et al., 2019). While limiting carbon emissions, the construction of carbon market also provides opportunities for the development of renewable energy (Zou et al., 2021; He et al., 2021). Therefore, developing low-carbon economy is a new way to seize the commanding height of a new round of world economic development and competition (Joanna, 2010; Li et al., 2021).
There is a close relationship between carbon market and energy market. When the carbon price fluctuates sharply, industrial enterprises may change the energy structure and affect the energy market. In turn, the adjustment of the energy market structure will also affect the carbon market (Guo and Farouk, 2021; Zhang et al., 2021). The carbon market and energy market have significant time-varying characteristics in the direction and intensity of volatility spillover (Chevallier, 2012), especially when impacted by emergencies, the spillover effect is significantly higher than that in other periods, which indicates that there is a structural break (Li et al., 2015; Lin and Chen, 2019). Therefore, this paper discusses the time-varying two-way spillover effect between carbon and energy markets, so as to prevent the sharp fluctuation of carbon price, stabilize the carbon trading price, and promote the formation of a reasonable price transmission mechanism between China’s carbon market and energy market. At the same time, it is also conducive to the prevention of systemic financial risks in the energy market and ensure the safe supply of energy.
The linkage effect theory showed that if there is a certain correlation mechanism between markets, the change of one market parameter will cause the change of one or more other related market parameters, thus forming the interaction linkage between markets (Hirschman, 1958). With the mutual penetration and integration of carbon market and energy market. Energy commodities such as crude oil, natural gas, ethanol, heating oil, coal, and gasoline will improve the diversification of carbon assets (Gazi and Jose., 2018), and then promote the mutual penetration and integration of carbon and energy markets. There is a significant two-way causal relationship between carbon and energy markets, which is mainly reflected in the dynamic spillover effect between crude oil, natural gas and carbon market (Chevallier, 2012). Specifically, there are strong two-way linear and nonlinear spillover effects between carbon and crude oil markets (Yu et al., 2015), especially the volatility spillover effect between carbon and coal markets is the strongest (Wu et al., 2020).
Our study makes three major contributions to the empirical literature on modeling carbon and energy markets. On one hand, we provide new evidence for the existing literature to prove that the volatility spillover between carbon and energy markets has two-way time-varying characteristics. On the other hand, dynamic model is a contribution, previous literature dealt mostly with static models, whereas this paper applied dynamic and its advantage is that it better reflects the dynamic spillover effect over time. In addition, the spillover index model is also a contribution, previous literature dealt mostly with the Copula and GARCH models, whereas this paper applied the spillover index model combined with rolling window technology, and its advantage is that it can more accurately measure the time-varying spillover effect between carbon and energy markets.
The spillover effect between markets is that the emergencies will usually cause severe fluctuations in related market prices. According to the linkage effect transmission mechanism, it can be considered that there is a certain linkage behavior between energy and carbon markets, and there is a time-varying price fluctuation transmission mechanism between the two markets. Lin and Jia (2019) used a dynamic recursive computable general equilibrium model to analyze the impact of different emission trading scheme (ETS) price level, they found the output of energy industry is more sensitive to ETS price than that of other industries. Low ETS prices will weaken the ability of the carbon market to reduce emissions, and higher ETS prices will lead to higher carbon dioxide emission reduction. There is a nonlinear structure between the carbon and energy markets, and there is a relatively significant correlation between the carbon and energy futures markets on different time scales (Cao and Xu, 2016). Xu et al. (2020) constructed a time-delay multilayer recursive network, and introduced the time-delay information correlation coefficient to measure the interaction between systems. They found that the linkage relationship between oil, coal, natural gas, and carbon prices showed a U-shaped trend of the EU carbon market, while the linkage trend between gasoline and carbon prices continued to rise. Balcilar et al. (2016) indicated that the dominant relationship between energy and carbon price changes in different stages, and carbon price plays a leading role at this stage. There is a significant spillover effect between carbon and energy markets, changes in energy prices often affect carbon emission rights prices.
Risk spillover is a particular concern in the connection between carbon and energy markets. Balcilar et al.(2016) examined the risk spillover between energy futures prices and European carbon futures contracts, and pointed out that there is significant volatility and time-varying risk transmission from energy to carbon market, then the spot and futures parts of emission market show time-varying correlation and volatility hedging effectiveness. In the renewable energy market system, the volatility spillover relationship involving multiple markets is more complex than that between two markets. Fuel cell and solar energy markets play an important role in the risk diffusion path, which needs to be prevented. Zhou et al. (2021) comprehensively analyzed the risk diffusion relationship between renewable energy markets. They found that the volatility spillover of renewable energy market tends to exist in high dimensions. Khamis et al. (2019) analyzed the dynamic returns and risk spillovers between commodity futures (energy and precious metals) and the Gulf Cooperation Council (GCC) stock market. It showed that there is a significant income and risk spillover between commodities and GCC stock market, especially during the outbreak of the global financial crisis in 2008–2009. In addition, the systemic risk brought by volatility spillover may threaten the stability of financial markets. Hedi and Imed. (2020) studied the spillover mechanism of permanent and temporary shocks in the Islamic stock market and a series of global risk factors by using the Diebold and Yilmaz (DY) methods, and pointed out that the intensity of earnings and volatility spillover increased during the financial turmoil, which supported the evidence of contagion. Chen and Jin (2020) studied the risk spillover of China’s stock market by using the method of spatial econometrics. It showed that both real contact channel and information channel are effective communication channels to drive spillover effect. The spillover effects of specific determinants persist, and the communication channels and spillover effects in different regions are asymmetric.
The spillover relationship between carbon and energy markets is not invariable, and there is a time-varying spillover effect (Ji et al., 2018). There is dynamic dependence between the international carbon and energy markets (Chen et al., 2021). Ma et al. (2020) used the copula GARCH model and the overall fitting effect method to study the dynamic dependence between the international carbon emission rights market, and found that there is an obvious dynamic dependence between EUA and CER futures and spot. Balcilar et al. (2016) used MS-DCC-GARCH model to analyze the risk spillover effect and linkage relationship between the European energy and carbon markets, indicating that the energy market has significant dynamic characteristics of risk spillover to the carbon market. Zhang and Sun (2016) employed the threshold dynamic conditional correlation generalized autoregressive conditional heteroscedasticity (GARCH) model to explore the dynamic volatility spillover between European carbon trading market and fossil energy market. Dutta et al. (2018) studied the daily return and volatility relationship between EU subsidy (EUA) price and clean energy stock return, and used the bivariate VAR-GARCH method to record the positive impact of the change of EUA price on the return of renewable energy stock. The results showed that there is a significant volatility relationship between emissions and European clean energy price index. Compared with foreign countries, China’s carbon market started relatively late. Gong et al. (2021) showed that there is an obvious spillover effect between carbon and fossil energy markets, and its intensity and direction are time-varying and asymmetric. The coal market has the greatest impact on the carbon market. The time-varying spillover effect between carbon and fossil energy markets lasts about 3 weeks, and the spillover effect gradually weakens with time. Especially in the case of 1 week lag, the time-varying spillover effect is the most significant. Chang et al. (2019) used dynamic conditional correlation (DCC) generalized autoregressive conditional heteroscedasticity (GARCH) model to study the fluctuation spillover effect and dynamic correlation between China’s emission quota and fossil energy market. The dynamic correlation between fossil energy and regional emission quota market shows a slight time-varying trend, and its dynamic correlation is at a low level in the considered period. The prohibition of cross regional emission quota flows, inefficient dynamic links between the two markets and low-price transmission may lead to the reduction of volatility spillover effect and dynamic correlation.
The spillover effect between carbon and energy markets still has some bidirectional and regional heterogeneity. Xu (2021) combined copula and conditional VaR methods to reveal the asymmetric risk spillover of international and China’s domestic energy market uncertainty, such as Hubei and Shenzhen carbon pilot. Although the uncertainty of international and China’s domestic energy market has a significant risk spillover effect on China’s carbon pilot, there are differences between carbon pilot projects. Liu et al. (2017) examined the level of oil market risk measured by value at risk (VaR) and conditional var (CoVaR), as well as the dynamic and asymmetric dependence between West Texas Intermediate (WTI) yield and crude oil volatility index (OVX). The results showed that WTI returns are negatively correlated with OVX in most cases, OVX has a significant risk spillover effect on WTI returns, and CoVaR also has an asymmetric effect on the extreme fluctuations of different OVX. Wang and Guo (2018) revealed the asymmetric spillover effects of the two types of markets on the return and volatility series. Among the three major energy markets of WTI oil, Brent oil and natural gas, WTI oil market has the strongest spillover effect on the system, and natural gas has the most significant spillover effect on the carbon market. There is feedback from carbon to other energy markets, and electricity price has proved to be the largest information receiver in the system. And the connectivity level of volatility system is significantly higher than that of income system. The extreme risk Spillovers of energy companies vary greatly in business and regions, which deserves more attention in energy risk management (Zhu et al., 2020). Chang et al. (2018) showed that coal, oil and natural gas prices are the main determinants of regional emission quota prices in the long run, except for the second phase of Beijing ETS pilot. The long-term cointegration relationship in Beijing and Shanghai is not completely consistent with that in Guangdong and Hubei. In the short term, the oil and gas price changes in the second stage of Beijing ETS pilot, the natural gas price changes in Shanghai ETS pilot and the coal price changes in Hubei ETS pilot have a significant impact on China’s regional emission quota price.
In summary, the existing literature on the spillover effects of carbon and energy markets mostly discusses the relationship between carbon market and single energy market, such as the spillover effects of carbon market and traditional energy market, carbon market and new energy market, ignoring the connection and risk transmission between the whole energy market. In addition, the existing literature mainly measures the spillover effect between carbon and energy markets by analyzing the GARCH model, and can’t accurately analyze the directional characteristics of spillover effect. Finally, most of the existing literatures use static models to study the volatility spillover effect, but there is still a lack of investigation on the dynamic spillover effect.
DY spillover index model was proposed by Diebold and Yilmaz (2009) to analyze the volatility spillover effect between stock markets in different countries, which has certain limitations. It can only simply quantify the dynamic total spillover index, but can’t measure the directional spillover index, and is too dependent on the order of variables. This paper adopts the method improved by Diebold and Yilmaz (2012, 2014), and uses the DY spillover index model based on generalized VaR to measure the time-varying two-way spillover effect between China’s carbon and energy markets. On the one hand, it eliminates the possible dependence of the results on the lag order of variables, on the other hand, it can quantify the directional spillover between different markets. The method is established as follows. The VaR (P) model as:
Where represents the random disturbance term vector of independent and identically distributed. The moving average is expressed as:
Where
When i < 0,
Under the framework of the above vector autoregressive model, the improved DY spillover index model in 2012 adopts the generalized variance decomposition method to predict the impact of the residual term in order to eliminate the possible dependence of the calculation results on the lag order of the variables. The results obtained based on this method not only do not depend on the lag order of the variable, but also do not require the orthogonalization of the equation error. In this model, the estimated value of variable
Where,
In order to make the error variance decomposition matrix satisfy that the sum of row vectors is equal to 1, the matrix needs to be standardized in rows, and the matrix element calculation formula is expressed as follows.
Based on the transformed matrix
Since the generalized impulse response and variance decomposition do not depend on the ranking of the variables to be measured, the generalized variance decomposition matrix can be used to calculate the directional overflow index. Among them, the spillover index, that is, the spillover effect of the market on all other markets, is calculated as follows:
Similarly, the spillover index is that the market is subject to the directional spillover effect of all other markets, and the calculation formula is:
Thus, the net spillover effect index can be obtained, that is, the net spillover effect of the market on all other markets:
Finally, the net volatility spillover index between markets can also be obtained:
China currently has nine carbon emission pilot markets, among which there is no quota trading in Sichuan carbon pilot trading market before 2018. China has established pilot carbon emission trading markets in various regions. Each pilot carbon market is established at different times and the economic conditions of the cities are different, so the degree of market activity is also different. According to the historical transaction data of each carbon market, this paper selects four relatively representative pilot carbon markets: Beijing (BEA), Guangdong (GDEA), Hubei (HBEA), and Shanghai (SHEA) as the research object. These four pilot carbon markets not only opened early, but also ranked among the top in market activity. In energy market, this paper selects crude oil futures (SC), power index (L11655) and CSI new energy index (NEI) to represent China’s traditional energy market, power market and new energy market respectively. Finally, each pilot carbon market and energy market are analyzed respectively.
The transaction hours of the four carbon markets are different from those of the three energy markets. In order to ensure the consistency of time series, this paper selects the trading period of each group of data, and finally selects the common trading date of each market. The start dates and end dates of the samples are March 26, 2018 and May 31, 2021, respectively. In order to ensure the stability of the time series data, the daily log yield of each market is calculated. The descriptive statistics and ADF test results of the daily yield of each market are shown in Table 1.
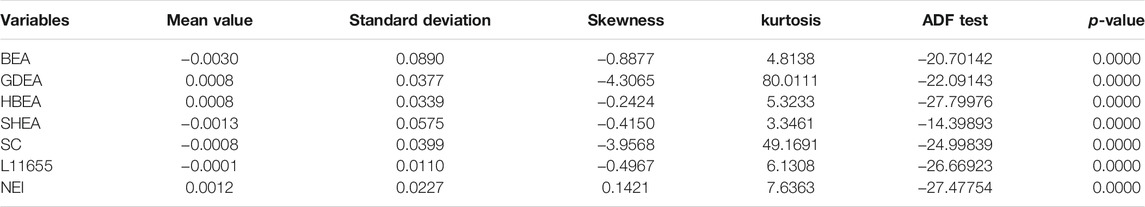
TABLE 1. Descriptive statistical results of the markets.
From Table 1, first, the ADF test and its p-value can confirm that the log return data of each market are smooth. Second, from the standard deviation, among the four carbon markets, the daily yield fluctuation of Beijing pilot carbon market is the largest, that of Hubei pilot carbon market is the smallest. The standard deviation of crude oil futures market is the largest, and standard deviation of power industry index is the smallest. Third, the skewness of the time series in the table is not equal to 0, and the kurtosis is greater than 3, that is, the sample data do not belong to normal distribution, showing the characteristics of peak and thick tail.
The static volatility spillover index model between China’s pilot carbon market and energy market is constructed. The static volatility spillover effect between markets is shown in Table 2. The spillover index describes the extent to which the market is affected by the spillover effects of other markets. The net spillover index represents the difference between the spillover effect of the market on other markets and the spillover effect by other markets. The total spillover index is the total spillover effect included in the market.
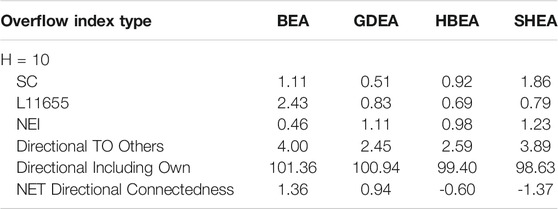
TABLE 2. Spillover index of pilot carbon markets to energy markets.
From Table 2, the spillover index between the pilot carbon market and the energy market is greater than 0, indicating that there is a fluctuation spillover effect between the carbon market and each energy market. In addition, the static directional spillover index shows that the spillover and spillover indexes of the pilot carbon market are not equal, and both are greater than 0, indicating that there may be two-way asymmetry in the spillover effect between the carbon market and the energy market. In addition, in the static net spillover effect, the net spillover index of the pilot carbon markets in Beijing (BEA) and Guangdong (GDEA) is greater than 0, indicating that the spillover effect of the carbon market on the energy market is stronger on the whole. On the contrary, the net spillover index of carbon market in Hubei (HBEA) and Shanghai (SHEA) is less than 0, indicating that the spillover effect of energy market on carbon market is stronger.
Due to the static estimation of volatility spillover effect cannot reflect the dynamic spillover effect changing with time, this paper further combines the rolling window technology with DY spillover index. Firstly, a 50-weeks rolling window is set to measure the time-varying spillover effect between China’s pilot carbon market and energy market. Then, the total volatility spillover index, directional spillover index, net spillover index and net paired spillover index between China’s pilot carbon market and energy market are drawn. Finally, the spillover index charts obtained from different angles can help us comprehensively identify the characteristics of time-varying spillover effects between China’s pilot carbon market and energy market.
Figure 1 shows the total spillover index of four pilot carbon markets and energy market in Beijing (BEA), Guangdong (GDEA), Hubei (HBEA), and Shanghai (SHEA). Observing the total volatility spillover index between the pilot carbon market and energy market, it can be found that the total spillover index of the four carbon markets and energy markets has generally fluctuated greatly since the beginning of 2018. Among them, the total spillover index of Beijing pilot carbon market and energy market changes between 20 and 54%. The total spillover index of the pilot carbon market group in Guangdong varies from 20 to 56%. The total spillover index of Hubei pilot carbon market group changes between 25 and 65%. The total spillover index of Shanghai pilot carbon market group changes between 20 and 60%. The four groups of total spillover indexes of carbon market and energy market show significant time-varying characteristics within the sample measurement range.
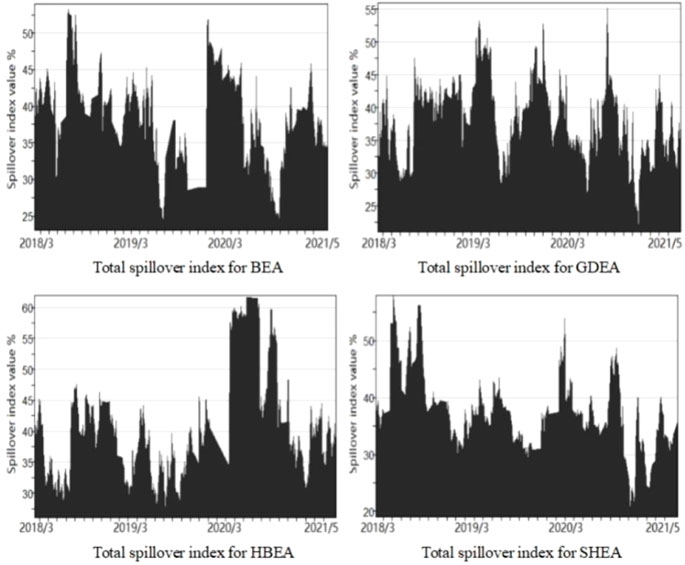
FIGURE 1. Total spillover index of carbon and energy markets. Notes: This group of figures shows the total time-varying spillovers indexes generated between carbon and energy markets in four sample groups, each containing different carbon markets (BEA, GDEA, HBEA, SHEA) and energy markets (SC, L11655, NIE).
In addition, the total spillover index chart shows some significant fluctuation cycles of the total spillover effect. The first cycle is from 2018 to early 2019. In the early stage of this cycle (before 2019), the total spillover index of carbon market and energy market directly fluctuated and decreased by different ranges. On the one hand, China’s crude oil futures market has just been officially established in 2018, and the market trading is in its infancy, which has little impact on other relevant markets. On the other hand, due to the continuous international trade differences between China and the United States in 2018, the policy impact of the Sino US trade war led to more fluctuations in the energy market due to real-time policies, and the spillover effect between markets was relatively reduced. In the later period (from the end of 2018 to the beginning of 2019), due to the increasing Sino US trade friction and the import and export of energy and energy equipment involved in international trade, the energy market price is greatly uncertain affected by policies, resulting in a sharp rise in the total spillover index between markets. After the first significant fluctuation cycle, the total spillover index between carbon market and energy market experienced relatively small and frequent fluctuations. From the beginning of 2019 to the end of 2019, the total spillover index of each group did not show significant periodicity. The second significant cycle is from the beginning of 2020 to the end of 2020. This cycle also experienced a significant rise and fall of the total spillover index. During this period, it should be mainly due to the impact of price fluctuations in the crude oil futures market on the total spillover index among various markets. At the beginning of 2020, the COVID-19 epidemic swept the world. In March of the same year, the U.S. WTI crude oil futures price fell to a negative number. During this period, the huge price fluctuation in the energy market dominated by the crude oil market caused the sharp rise of the total spillover index between markets. According to the above analysis of some significant fluctuation cycles of the total spillover index, it can be seen that the total spillover effect between China’s pilot carbon market and energy market will have a significant upward trend mainly in the period of major social time and significant fluctuation of energy market.
Since the total spillover index can only measure the time-varying characteristics of the overall volatility spillover effect between the pilot carbon market and the energy market, this paper also needs to further measure the time-varying directional spillover effect between the pilot carbon market and the energy market.
From Figure 2, both the spillover effect of carbon market on energy market and the spillover effect of energy market on carbon market have significant time variability. In addition, from the spillover indexes in different directions, it can be seen intuitively that the spillover effects between the four pilot carbon markets and energy markets are bidirectional and asymmetric. From the value of the spillover index, the peak value of the directional spillover index of the pilot carbon market to the energy market can reach 20% or even higher, while the peak value of the carbon market affected by the spillover effect index of the energy market is mostly below 15%. On the other hand, the overall continuity of the directional spillover effect of the pilot carbon market on the energy market is not as good as that of the carbon market. It is because the carbon market is largely affected by policy regulation. When new policies or new regulatory mechanisms are introduced, the spillover effect index of the pilot carbon market on the energy market will increase, but the fluctuation of the pilot carbon market caused by policy adjustment will soon stabilize, and the spillover effect index of the carbon market on the energy market will also decline rapidly. The energy market is more subject to market independent regulation, which itself has high volatility, so the spillover effect index on the carbon market is also high. Overall, when there are major social events or market policy adjustments, the spillover effect of the carbon market on the energy market is significant. The spillover effect of the energy market on the carbon market is stronger in the case of daily market fluctuations.
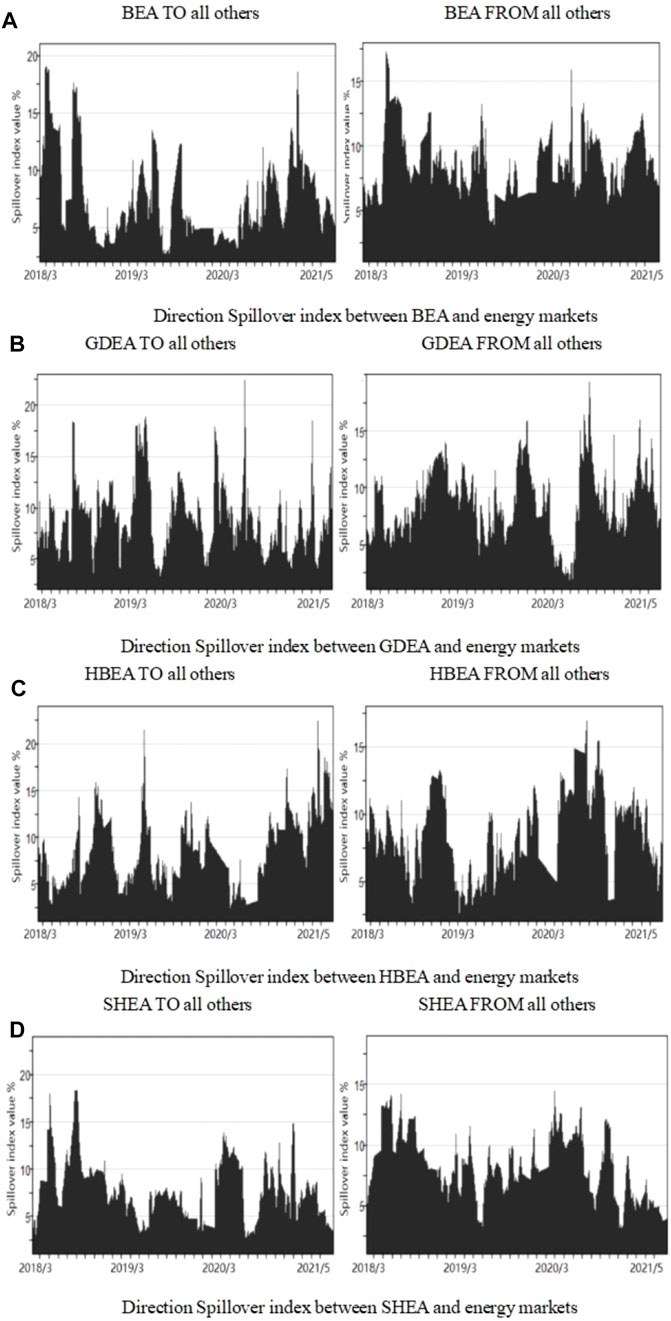
FIGURE 2. (A) Direction spillover index between BEA and energy markets. (B) Direction spillover index between GDEA and energy markets. (C) Direction spillover index between HBEA and energy markets. (D) Direction spillover index between SHEA and energy markets.
Figure 3 shows the net spillover index between the pilot carbon market and the energy market in each group. In order to facilitate the analysis of the characteristics of the time-varying spillover effect between the pilot carbon market and the energy market, this paper also measures the net paired spillover effect of the pilot carbon market on the energy market (Figure 4). Based on the net spillover index in Figure 3, we can intuitively see that, unlike the static spillover index, the time-varying net spillover effect between China’s pilot carbon market and energy market is not always positive or negative. When the net spillover index is positive, it shows that the forward spillover effect of China’s pilot carbon market on the energy market is greater than the backward spillover effect. On the contrary, when the net spillover index is negative, it shows that the output of China’s pilot carbon market on the energy market is less than the input. Overall, there are net spillovers in different directions between China’s pilot carbon market and energy market.
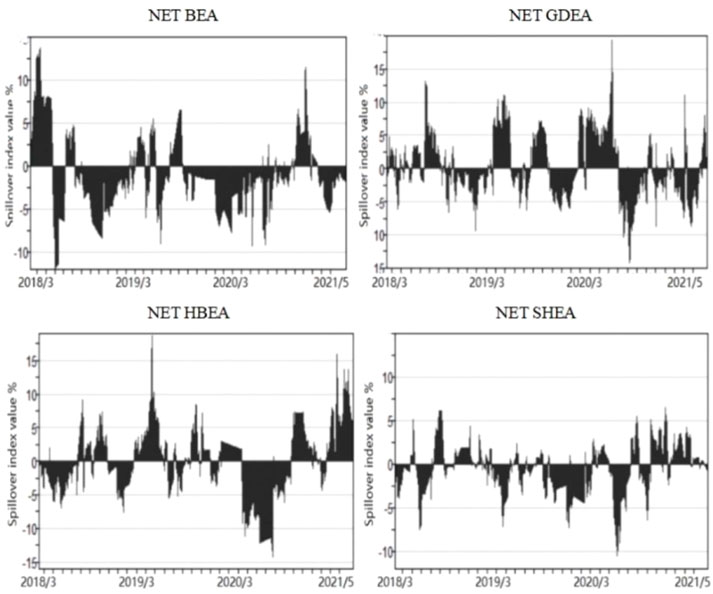
FIGURE 3. Net spillover index between carbon and energy markets. Notes: This group of figures shows net spillover index for each carbon market. The net spillover index is calculated from the spillover index from the carbon to energy markets minus the spillover index from the energy to carbon markets.
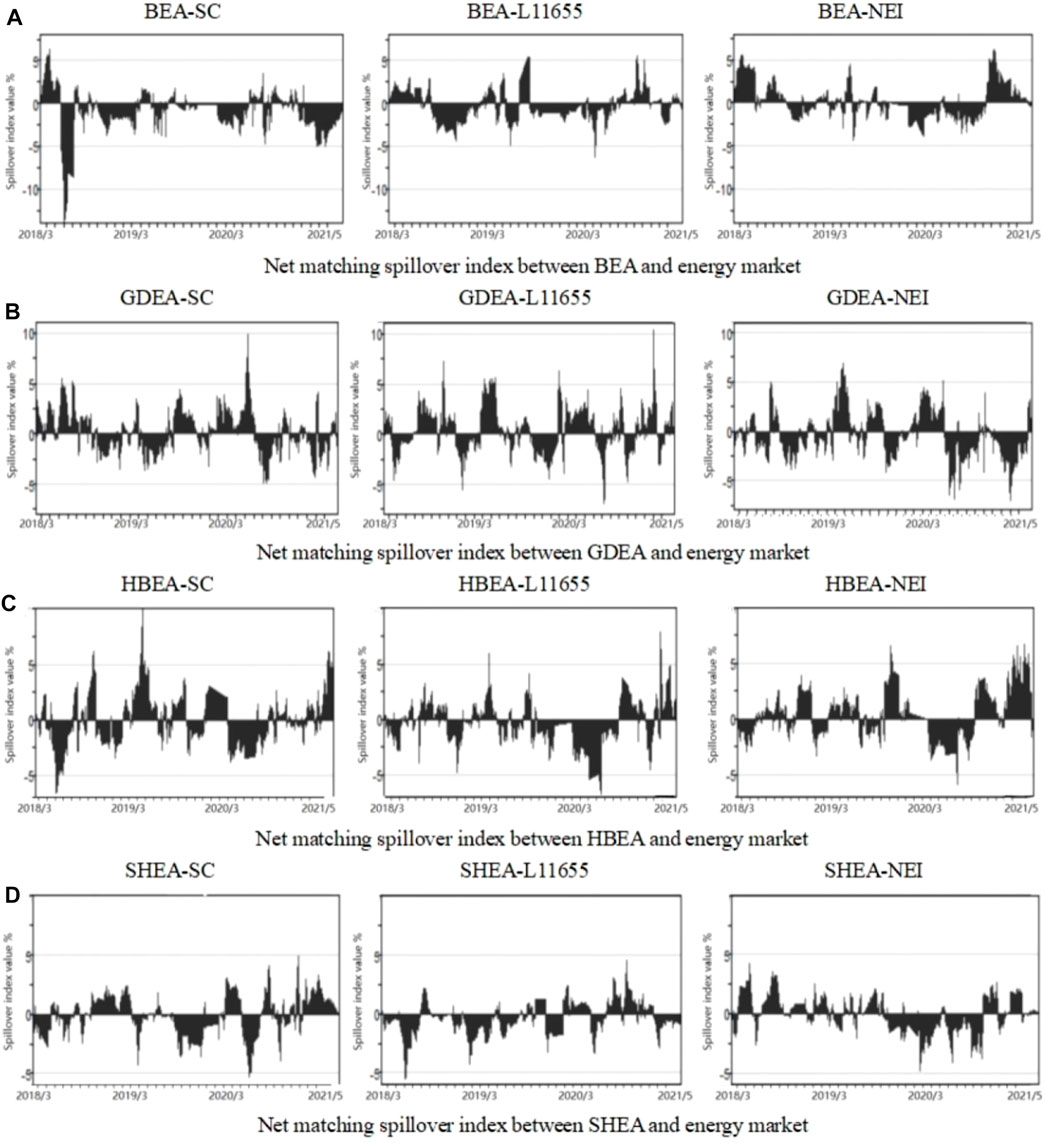
FIGURE 4. (A) Net matching spillover index between BEA and energy market. (B) Net matching spillover index between GDEA and energy market. (C) Net matching spillover index between HBEA and energy market. (D) Net matching spillover index between SHEA and energy market.
From the directional spillover index between the pilot carbon market and the energy market, we can find that during the period of energy market shock, the spillover index of the energy market to the pilot carbon market increased significantly. Combined with Figure 3, we found that the net spillover index showed a negative net spillover index in the corresponding period, this can better explain that the spillover effect of the energy market on China’s pilot carbon market mainly increases significantly during the shock period of the energy market. When sudden political events happen, major social events and market environmental factors will cause energy market shocks, due to the existence of inter market linkage mechanism, the fluctuation of energy price will also affect the pilot carbon market. At this time, it is reflected in the significant enhancement of the spillover effect of energy market on carbon market in the corresponding period.
Further analysis of the net paired spillover index between the pilot carbon market and the energy market shows that there are some differences in the time-varying spillover effects between different carbon markets and different energy markets. The volatility spillover effect of Beijing (BEA) and Shanghai (SHEA) pilot carbon markets mainly comes from the crude oil futures market, especially the volatility spillover effect of Beijing Pilot carbon market from 2018 to 2019 is negative and reaches the minimum. In addition, from 2020 to 2021, Shanghai’s carbon market was also affected by the significant fluctuation spillover effect of the new energy index. For Guangdong pilot carbon market (GDEA), its net spillover index changed significantly negatively during the shock period of new energy index. The volatility spillover effect of Hubei pilot carbon market (HBEA) mainly comes from crude oil and power industry indexes. Overall, in the period of energy market price shock, the spillover effect of energy market on China’s carbon market is significantly higher than that in other periods, but there are certain regional differences in the degree of impact of different pilot carbon markets in China by the fluctuations of the energy market in the corresponding period. This phenomenon may be caused by the significant differences in local economic development level, energy consumption structure and government market policies.
This paper changes the window period of the rolling window to test the robustness of the time-varying overflow index. The rolling window period is adjusted from 50 to 25 weeks and 100 weeks respectively, and then the total spillover index is measured respectively. It can be seen from the total spillover index diagram of each group in Figure 5 that although the increase of the window period will cause the total spillover index to lose more sample values than the small window period, on the whole, each total spillover index will rise significantly in early 2020, indicating that the time-varying total spillover index can still reflect the conclusion that the total spillover index will rise during the period of severe fluctuations in the energy market. Thus, the robustness test is passed.
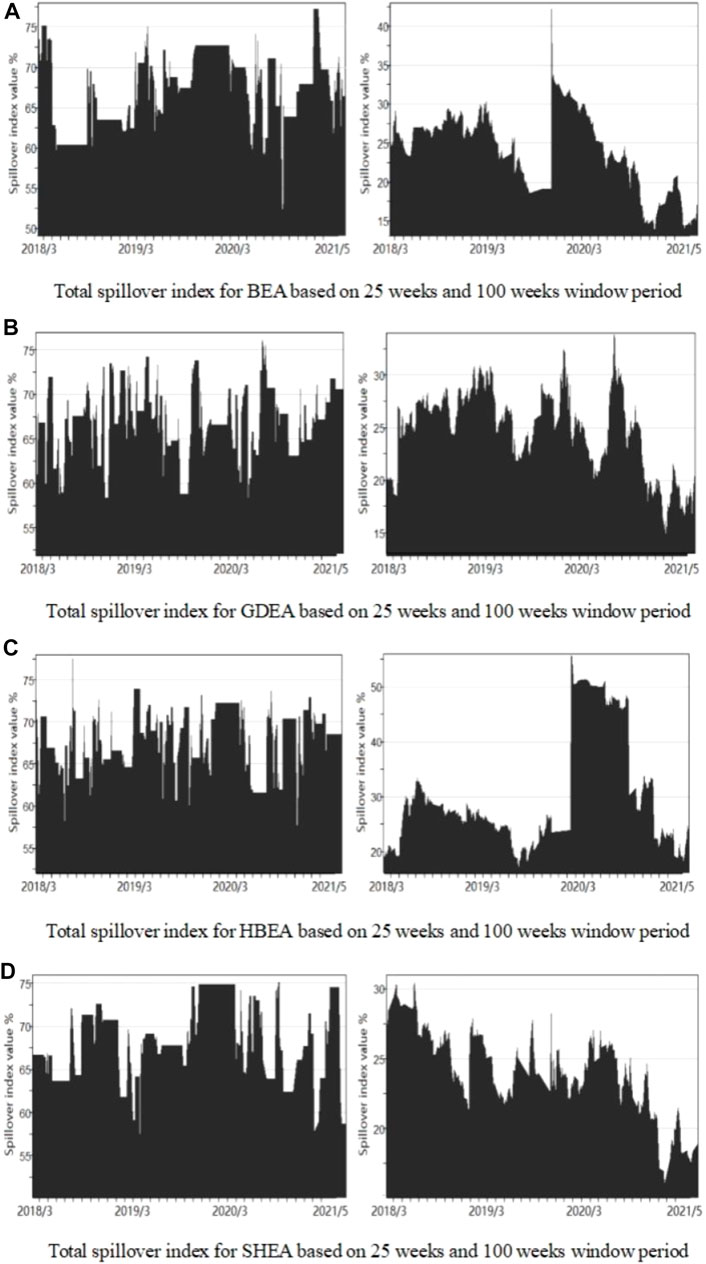
FIGURE 5. (A) Total spillover index for BEA based on 25 weeks and 100 weeks window period. (B) Total spillover index for GDEA based on 25 weeks and 100 weeks window period. (C) Total spillover index for HBEA based on 25 weeks and 100 weeks window period. (D) Total spillover index for SHEA based on 25 weeks and 100 weeks window period.
Combined with rolling window technology and DY spillover index model, this paper studies the time-varying two-way spillover effect between China’s carbon and energy markets, and draws the following conclusions: 1) The spillover index between carbon and energy markets measured by the static volatility spillover index model is greater than 0, indicating that there is volatility spillover effect between China’s carbon and traditional energy markets, power and new energy markets. 2) The total spillover index shows that there is a time-varying spillover effect between China’s carbon and energy markets. 3) The directional spillover index reflects that the spillover effect between China’s carbon and energy markets is bidirectional and asymmetric. 4) The net spillover index and net paired spillover index show that the time-varying spillover effect between China’s carbon and energy markets has significant regional heterogeneity.
Based on the above conclusions, the policy implications are as follows:
1) Form an inherently stable price mechanism between China’s carbon market and energy market. The fluctuation transmission mechanism between China’s carbon market and energy market has great uncertainty. In order to effectively prevent the intrusion of energy price fluctuations on China’s carbon market, it is necessary to integrate the carbon emission right trading price into China’s energy price system for comprehensive consideration, so as to form an internal stable price mechanism between China’s carbon market and energy market.
2) Improve the risk monitoring and early warning mechanism of China’s carbon market. The spillover effect of carbon market during the period of energy market price shock is significantly higher than that in other periods, so it is necessary to improve the risk monitoring and early warning mechanism of China’s carbon market to effectively deal with the possible fluctuation impact during the period of energy market shock. On the one hand, carbon market regulators need to be vigilant about the possible risk impact when the energy market price fluctuates violently. On the other hand, when building a national unified carbon market, it is necessary to fully consider the adverse impact that external shocks such as energy price fluctuations may have on regional emission reduction costs, and formulate reasonable and effective risk monitoring, risk early warning and crisis management schemes.
3) Comprehensively consider and effectively coordinate regional differences. The impact of energy market price shocks on carbon markets in different regions of China shows certain differences. Therefore, on the premise of ensuring the design of national unified carbon market system, comprehensively consider the characteristics of regional carbon market and choose diversified trading systems to effectively reduce the adverse effects caused by different shocks. In addition, in the process of carbon market system design and rule management, it is necessary to comprehensively analyze the reasons for the differences in the impact of external shocks such as energy price fluctuations on different regional carbon markets, so as to effectively reduce regional heterogeneity and ensure fair competition in carbon prices.
4) Give play to the guiding role of the government in the construction of carbon market. The development of the carbon market is inseparable from the top-level design of the government. It should be carried out from the aspects of the establishment of the institutional system, regulatory legislation and macro-control of the carbon market, improve the legal system and supporting management system of the carbon market, and effectively play its role in resource allocation. At the same time, it is necessary to learn from the experience of EU carbon market construction, combined with the actual situation of China’s development, improve the regulatory mechanism, reduce the carbon market risk, take the impact of energy market risk spillover into account, and establish an effective risk monitoring and early warning mechanism to prevent the occurrence of systemic risks.
In the future research, this study will add time-varying factors when analyzing the asymmetry of volatility connectivity between markets, and the connectedness network is also introduced to visualize the direction and intensity of volatility spillover effect between carbon and energy markets. In addition, with the establishment of China’s unified carbon market and the continuous development of crude oil futures market, we can further research the long-term time-varying two-way spillover effect of the national unified carbon market on the energy market.
Publicly available datasets were analyzed in this study. This data can be found here: http://cndata1.csmar.com/.
The research is designed and performed by SQ, CZ, and KZ. The data was collected by SQ, CZ, and KZ. Analysis of data was performed by SQ, KZ, and ZR. Finally, the paper is written by SQ, CZ, and KZ.
This work was supported by Youth Project of Humanities and Social Sciences of Ministry of Education in China (grant number: 19YJC790103), Social Science Foundation of Fujian Province (grant number: FJ2021C023), Youth talent innovation team support program of Zhengzhou University (grant number: 32320293).
The authors declare that the research was conducted in the absence of any commercial or financial relationships that could be construed as a potential conflict of interest.
All claims expressed in this article are solely those of the authors and do not necessarily represent those of their affiliated organizations, or those of the publisher, the editors, and the reviewers. Any product that may be evaluated in this article, or claim that may be made by its manufacturer, is not guaranteed or endorsed by the publisher.
Balcilar, M., Demirier, R., Hammoudeh, S., and Khuong Nguyen, D. (2016). Risk Spillovers across the Energy and Carbon Markets and Hedging Strategies for Carbon Risk. Energ. Econ. 54, 159–172. doi:10.1016/j.eneco.2015.11.003
Cao, G., and Xu, W. (2016). Nonlinear Structure Analysis of Carbon and Energy Markets with MFDCCA Based on Maximum Overlap Wavelet Transform. Physica A: Stat. Mech. its Appl. 444, 505–523. doi:10.1016/j.physa.2015.10.070
Chang, K., Ge, F., Zhang, C., and Wang, W. (2018). The Dynamic Linkage Effect between Energy and Emissions Allowances price for Regional Emissions Trading Scheme Pilots in China. Renew. Sustain. Energ. Rev. 98, 415–425. doi:10.1016/j.rser.2018.09.023
Chang, K., Ye, Z., and Wang, W. (2019). Volatility Spillover Effect and Dynamic Correlation between Regional Emissions Allowances and Fossil Energy Markets: New Evidence from China's Emissions Trading Scheme Pilots. Energy 185, 1314–1324. doi:10.1016/j.energy.2019.07.132
Chen, N., and Jin, X. (2020). Industry Risk Transmission Channels and the Spillover Effects of Specific Determinants in China's Stock Market: A Spatial Econometrics Approach. North Am. J. Econ. Finance 52, 101137. doi:10.1016/j.najef.2019.101137
Chen, W. D., Xiong, S., and Chen, Q. Y. (2021). Characterizing the Dynamic Evolutionary Behavior of Multivariate price Movement Fluctuation in the Carbon-Fuel Energy Markets System from Complex Network Perspective. Energy 239, 121896. doi:10.1016/j.energy.2021.121896
Chen, X., and Lin, B. (2021). Towards Carbon Neutrality by Implementing Carbon Emissions Trading Scheme: Policy Evaluation in China. Energy Policy 157, 112510. doi:10.1016/j.enpol.2021.112510
Chevallier, J. (2012). Time-varying Correlations in Oil, Gas and CO2prices: an Application Using BEKK, CCC and DCC-MGARCH Models. Appl. Econ. 44 (32), 4257–4274. doi:10.1080/00036846.2011.589809
Diebold, F. X., and Yilmaz, K. (2012). Better to Give Than to Receive: Predictive Directional Measurement of Volatility Spillovers. Int. J. Forecast. 28 (1), 57–66. doi:10.1016/j.ijforecast.2011.02.006
Diebold, F. X., and Yilmaz, K. (2009). Measuring Financial Asset Return and Volatility Spillovers, with Application to Global Equity Markets. Econ. J. (London) 119 (534), 158–171. doi:10.1111/j.1468-0297.2008.02208.x
Diebold, F. X., and Yılmaz, K. (2014). On the Network Topology of Variance Decompositions: Measuring the Connectedness of Financial Firms. J. Econom. 182 (1), 119–134. doi:10.1016/j.jeconom.2014.04.012
Dutta, A., Bouri, E., and Noor, M. H. (2018). Return and Volatility Linkages between CO2 Emission and Clean Energy Stock Prices. Energy 164, 803–810. doi:10.1016/j.energy.2018.09.055
Gallego-Álvarez, I., Segura, L., and Martínez-Ferrero, J. (2015). Carbon Emission Reduction: the Impact on the Financial and Operational Performance of International Companies. J. Clean. Prod. 103, 149–159. doi:10.1016/j.jclepro.2014.08.047
Gazi, S. U., Jose, A. H., Shahzad, S. J. H., and Hedström, A. (2018). Multivariate Dependence and Spillover Effects across Energy Commodities and Diversification Potentials of Carbon Assets. Energ. Econ. 71, 35–46. doi:10.1016/j.eneco.2018.01.035
Gong, X., Shi, R., Xu, J., and Lin, B. (2021). Analyzing Spillover Effects between Carbon and Fossil Energy Markets from a Time-Varying Perspective. Appl. Energ. 285, 116384. doi:10.1016/j.apenergy.2020.116384
Guo, Y. P., and Farouk, A. (2021). Financial Development and Carbon Emissions: Analyzing the Role of Financial Risk, Renewable Energy Electricity, and Human Capital for China. Discrete Dyn. Nat. Soc. 2021, 1025669. doi:10.1155/2021/1025669
He, A., Xue, Q., Zhao, R., and Wang, D. (2021). Renewable Energy Technological Innovation, Market Forces, and Carbon Emission Efficiency. Sci. Total Environ. 796, 148908. doi:10.1016/j.scitotenv.2021.148908
Hedi, B. H., Imed, M., and Al Dohaiman, M. (2020). Common Shocks, Common Transmission Mechanisms and Time-Varying Connectedness Among Dow Jones Islamic Stock Market Indices and Global Risk Factors. Econ. Syst. 44 (2), 100760. doi:10.1016/j.ecosys.2020.100760
Hirschman, A. O. (1958). The Strategy of Economic Development. New Haven: Yale University Press, 98–116.
Ji, Q., Zhang, D., and Geng, J.-b. (2018). Information Linkage, Dynamic Spillovers in Prices and Volatility between the Carbon and Energy Markets. J. Clean. Prod. 198, 972–978. doi:10.1016/j.jclepro.2018.07.126
Joanna, I. L. (2010). The Evolving Role of Carbon Finance in Promoting Renewable Energy Development in China. Energy Policy 38 (6), 2875–2886. doi:10.1016/j.enpol.2010.01.020
Jonathan, D., Paul, D. H. H., and Seth, B. (2013). Estimating the Impact of Fuel-Switching between Liquid Fuels and Electricity under Electricity-Sector Carbon-Pricing Schemes. Socio-Economic Plann. Sci. 47 (2), 76–88. doi:10.1016/j.seps.2012.09.004
Khamis, H. A., Walid, M., Ahmet, S., and Hoon Kang, S. (2019). Energy, Precious Metals, and GCC Stock Markets: Is There Any Risk Spillover? Pacific-Basin Finance J. 56, 45–70. doi:10.1016/j.pacfin.2019.05.006
Li, L., Yin, L. B., and Zhou, Y. M. (2015). Exogenous Shocks and the Spillover Effects between Uncertainty and Oil price. Energ. Econ. 54, 224–234. doi:10.1016/j.eneco.2015.11.017
Li, Y., Chen, K., Zheng, N., Cai, Q., Li, Y., and Lin, C. (2021). Strategy Research on Accelerating Green and Low-Carbon Development under the Guidance of Carbon Peak and Carbon Neutral Targets. IOP Conf. Ser. Earth Environ. Sci. 793 (1), 012009. doi:10.1088/1755-1315/793/1/012009
Lin, B., and Chen, Y. (2019). Dynamic Linkages and Spillover Effects between CET Market, Coal Market and Stock Market of New Energy Companies: a Case of Beijing CET Market in China. Energy 172, 1198–1210. doi:10.1016/j.energy.2019.02.029
Lin, B., and Jia, Z. (2019). Impacts of Carbon price Level in Carbon Emission Trading Market. Appl. Energ. 239, 157–170. doi:10.1016/j.apenergy.2019.01.194
Liu, B.-Y., Ji, Q., and Fan, Y. (2017). Dynamic Return-Volatility Dependence and Risk Measure of CoVaR in the Oil Market: A Time-Varying Mixed Copula Model. Energ. Econ. 68, 53–65. doi:10.1016/j.eneco.2017.09.011
Liu, B., Sun, Z., and Li, H. (2021). Can Carbon Trading Policies Promote Regional Green Innovation Efficiency? Empirical Data from Pilot Regions in China. Sustainability 13 (5), 2891. doi:10.3390/su13052891
Liu, H.-H., and Chen, Y.-C. (2013). A Study on the Volatility Spillovers, Long Memory Effects and Interactions between Carbon and Energy Markets: the Impacts of Extreme Weather. Econ. Model. 35, 840–855. doi:10.1016/j.econmod.2013.08.007
Ma, Y., Wang, L., and Zhang, T. (2020). Research on the Dynamic Linkage Among the Carbon Emission Trading, Energy and Capital Markets. J. Clean. Prod. 272, 122717. doi:10.1016/j.jclepro.2020.122717
Mansanet-Bataller, M., Pardo, A., and Valor, E. (2007). CO2 Prices, Energy and Weather. Energy 28 (3), 73–92. doi:10.5547/issn0195-6574-ej-vol28-no3-5
Qi, S.-Z., Zhou, C.-B., Li, K., and Tang, S.-Y. (2021). Influence of a Pilot Carbon Trading Policy on Enterprises' Low-Carbon Innovation in China. Clim. Pol. 21, 318–336. doi:10.1080/14693062.2020.1864268
Sandra, S., and Jūratė, J. (2018). Explaining the Interplay of Three Markets: Green Certificates, Carbon Emissions and Electricity. Energ. Econ. 71, 1–13. doi:10.1016/j.eneco.2018.01.012
Todd, L., Jonghwan, K., and Audun, B. (2019). The Long-Term Impacts of Carbon and Variable Renewable Energy Policies on Electricity Markets. Energy Policy 131, 53–71. doi:10.1016/j.enpol.2019.02.070
Wang, X. Y., Khurshid, A., Qayyum, S., and Cantemir Calin, A. (2021). The Role of green Innovations, Environmental Policies and Carbon Taxes in Achieving the Sustainable Development Goals of Carbon Neutrality. Environ. Sci. Pollut. Res. Int., 11356-021–16208-Z. doi:10.1007/s11356-021-16208-z
Wang, Y., and Guo, Z. (2018). The Dynamic Spillover between Carbon and Energy Markets: New Evidence. Energy 149, 24–33. doi:10.1016/j.energy.2018.01.145
Wu, Q., Wang, M., and Tian, L. (2020). The Market-Linkage of the Volatility Spillover between Traditional Energy price and Carbon price on the Realization of Carbon Value of Emission Reduction Behavior. J. Clean. Prod. 245, 118682. doi:10.1016/j.jclepro.2019.118682
Xu, H., Wang, M. G., and Yang, W. G. (2020). Information Linkage between Carbon and Energy Markets: Multiplex Recurrence Network Approach. Complexity 2020, 5841609. doi:10.1155/2020/5841609
Xu, Y. (2021). Risk Spillover from Energy Market Uncertainties to the Chinese Carbon Market. Pacific-Basin Finance J. 67, 101561. doi:10.1016/j.pacfin.2021.101561
Yu, L., Li, J., Tang, L., and Wang, S. (2015). Linear and Nonlinear Granger Causality Investigation between Carbon Market and Crude Oil Market: A Multi-Scale Approach. Energ. Econ. 51, 300–311. doi:10.1016/j.eneco.2015.07.005
Zhang, Y.-J., and Sun, Y.-F. (2016). The Dynamic Volatility Spillover between European Carbon Trading Market and Fossil Energy Market. J. Clean. Prod. 112, 2654–2663. doi:10.1016/j.jclepro.2015.09.118
Zhang, Y., Shi, X., Qian, X., Chen, S., and Nie, R. (2021). Macroeconomic Effect of Energy Transition to Carbon Neutrality: Evidence from China's Coal Capacity Cut Policy. Energy Policy 155, 112374. doi:10.1016/j.enpol.2021.112374
Zhao, T., Zhang, X., and Bai, J. (2019). Analysis of Impact of National Carbon Market on thermal Power and Renewable Energy Development. IOP Conf. Ser. Earth Environ. Sci. 227 (4), 042001. doi:10.1088/1755-1315/227/4/042001
Zhou, W., Gu, Q., and Chen, J. (2021). From Volatility Spillover to Risk Spread: An Empirical Study Focuses on Renewable Energy Markets. Renew. Energ. 180, 329–342. doi:10.1016/j.renene.2021.08.083
Zhu, B., Han, D., Chevallier, J., and Wei, Y.-M. (2017). Dynamic Multiscale Interactions between European Carbon and Electricity Markets during 2005-2016. Energy Policy 107, 309–322. doi:10.1016/j.enpol.2017.04.051
Zhu, B., Lin, R., and Liu, J. (2020). Magnitude and Persistence of Extreme Risk Spillovers in the Global Energy Market: A High-Dimensional Left-Tail Interdependence Perspective. Energ. Econ. 89, 104761. doi:10.1016/j.eneco.2020.104761
Keywords: carbon market, energy market, time-varying spillover, spillover index model, regional heterogeneity
Citation: Qiao S, Zhao CX, Zhang KQ and Ren ZY (2021) Research on Time-Varying Two-Way Spillover Effects Between Carbon and Energy Markets: Empirical Evidence From China. Front. Energy Res. 9:789871. doi: 10.3389/fenrg.2021.789871
Received: 05 October 2021; Accepted: 15 November 2021;
Published: 14 December 2021.
Edited by:
Kangyin Dong, University of International Business and Economics, ChinaReviewed by:
Vidya C. T., Centre for Economic and Social Studies (CESS), IndiaCopyright © 2021 Qiao, Zhao, Zhang and Ren. This is an open-access article distributed under the terms of the Creative Commons Attribution License (CC BY). The use, distribution or reproduction in other forums is permitted, provided the original author(s) and the copyright owner(s) are credited and that the original publication in this journal is cited, in accordance with accepted academic practice. No use, distribution or reproduction is permitted which does not comply with these terms.
*Correspondence: Kai Quan Zhang, emhhbmdrYWlxdWFuX2x5QHNpbmEuY29t
Disclaimer: All claims expressed in this article are solely those of the authors and do not necessarily represent those of their affiliated organizations, or those of the publisher, the editors and the reviewers. Any product that may be evaluated in this article or claim that may be made by its manufacturer is not guaranteed or endorsed by the publisher.
Research integrity at Frontiers
Learn more about the work of our research integrity team to safeguard the quality of each article we publish.