 Yue Ping
 Qu Simin1
- 1State Key Laboratory of Reservoir Geology and Development, Southwest Petroleum University, Chengdu, China
- 2China University of Petroleum Beijing, Beijing, China
- 3CNOOC Shanxi Coalbed Methane Company Limited, Taiyuan, China
- 4New Mexico Institute of Mining and Technology, Socorro, NM, United States
The coalbed methane (CBM) resources in the Qinshui Basin are abundant with exceptional production potential. Coalbed methane wells usually need to be hydraulically fractured to build economical production. However, the exploration and production experiences have shown that the penetration distances of hydraulic fractures in the vertical direction of coal seams are uncertain, which may lead to fracture communication of the layers above and beneath aquifer layers, resulting in divergent production dynamics among coalbed methane producers. It has been observed that some of the CBM wells in Block M produced significantly more water than other wells in the surrounding area. It is suspected that the hydraulic fracturing among these producers may have communicated to the sandstone aquifers. To address the above challenge, this study investigated the geological characteristics of the aforementioned aquifer and coalbed layers, established a three-dimensional geological model, applied numerical simulation to quantify the influence of the aquifer on the production of the CBM wells, and developed a method to improve the history matching of CBM production simulation with the influence of the aquifer considered. This method has significantly improved the accuracy of the history matching performance and the reliability of the remaining gas study. The results from this study laid the foundation for the subsequent development strategy optimization.
1 Introduction
The coalbed methane resources in the Qinshui Basin are abundant and have good production potential. Unlike conventional oil and gas reservoirs, coalbed methane reservoirs tend to have relatively unique reservoir characteristics. Coal reservoirs are characterized by loose texture, strong adsorption, cutting development, a large surface area, and fracture development, and they tend to be low-porosity, low-permeability, and low-pressure reservoirs with poor overall physical properties (Qin et al., 2012; Guo and Zhang, 2017; Zhu et al., 2017; Lai, 2020; Cui et al., 2021; Taboada Jose and Diaz-Casas VicenteYu, 2021). They usually need to be developed by hydraulic fracturing of gas wells, drainage, reduction of formation pressure, coalbed methane desorption, and gas percolation (Ma, 2003; Zhang et al., 2017; Zhu et al., 2018; Zhu et al., 2019a; Hu et al., 2021; Zhang, 2021). Depending on the background of coal seam formation, the upper and lower parts of coal seams are often accompanied by top and bottom water-bearing layers, and the cores of water-bearing layers usually include sandstone or tuff. A large number of studies have shown (Sun et al., 2007; Cai et al., 2009; Peng et al., 2019; Lv et al., 2020; Liu et al., 2021a; Liu et al., 2021b; Wu et al., 2021) that the main coal reservoir parameters affecting CBM well capacity include porosity, coalbed thickness, permeability, gas content, desorption pressure, etc. In addition, water- and gas-bearing formations near the top and bottom plates can also significantly affect gas well capacity. Usually, hydraulic fracturing is required to establish the production capacity of CBM gas wells (Sang et al., 2011; Ting, 2017; Sun et al., 2019; Zhao, 2020; Mu et al., 2021). In this study, the characteristics of the sandstone aquifer at the top of the block are studied together with the geological characteristics of the coal seam. Then, a three-dimensional geological model of the coal seam + top aquifer is established, and the fitting effect of special single wells is improved by simulating the fracturing of the upper sandstone aquifer in some gas wells during numerical simulation. At the same time, the numerical simulation technique is applied to quantify the degree of influence of the top and bottom aquifers on the production status of CBM wells, and a method to improve the fitting effect of numerical simulation of CBM considering the influence of aquifers is established, which significantly improves the fitting accuracy of the numerical simulation history and the reliability of the remaining gas study in the study block. The practice shows that the penetration distance of hydraulic fracture joints in the longitudinal direction has certain uncertainty, which may lead to fracture to communicate the top–bottom plate water-bearing layer or the top–bottom plate sandstone gas-bearing layer, resulting in large differences between the production dynamics of gas wells and the surrounding CBM wells under normal conditions (Zhu et al., 2019b; Hou, 2020). During the development of Block M, it was found that certain CBM gas wells produced significantly more water than other surrounding gas wells. Under the same geological background and coal seam conditions, their production characteristics were significantly different from normal, and the reason for the anomaly was inferred to be the communication of the upper roof water-bearing layer after fracturing (Deng et al., 2019). Therefore, in the numerical simulation of this block when shooting holes at the coal seam location only, the history fitting indicated that the water in the coal seam was severely insufficient to simulate the production history of some of the highly productive water wells. Based on the hypothesis that it is possible that the producing wells fractured the top sandstone water layer during the fracturing process, resulting in some of the gas wells producing significantly more water than the average producing wells, and this study focuses on the effect of the water-bearing layer in the coal seam on the gas production effect of CBM.
2 Geological Overview of the Block
2.1 Overview of the Qinshui Basin
The Qinshui Basin is a large syncline complex trending north to south with rich sub-parallel hinge lines. The northern and southern parts are mainly northern–southern oriented folds, with locally eastern–western and northern–eastern trending sub-folds; the central part of the basin is dominated by northern–eastern oriented folds. As shown in Figure 1, the Shanxi and Taiyuan formations are the main coal-bearing systems in the Qinshui Basin, and the #3 and #15 coal seams are the important target layers for CBM production, among which the #15 coal seam is the main coal seam in Block M and Area A and is also the target layer in this study.
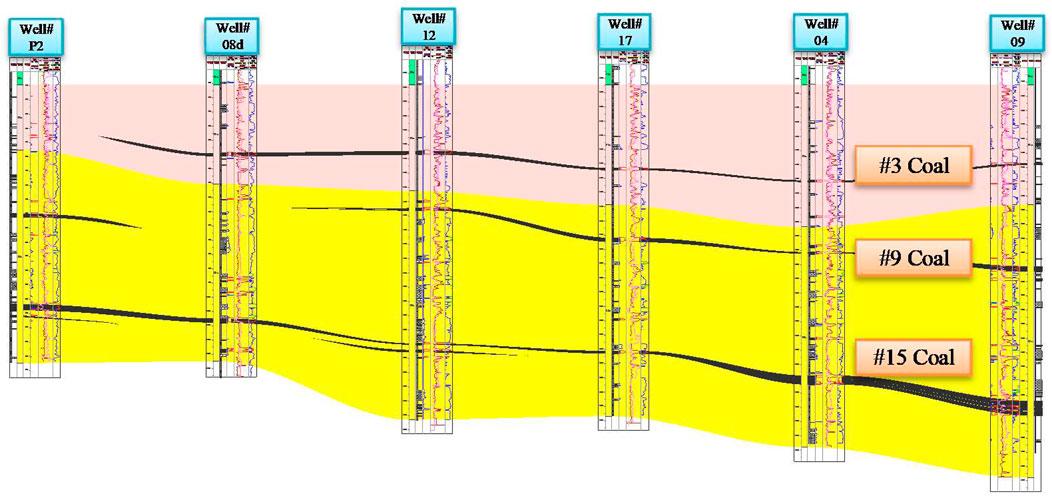
FIGURE 1. Distribution of coal seam reservoirs in Block M.
2.2 Characteristics of Coalbed Methaen
Block M is located at the western foot of Taihang Mountains, the southeast wing of Taiyuan East Mountain Backslope, with a topography of west high and east low, north high and south low, and the elevation is 980–1342.10 m, but the relative height difference is not big, generally between 100 and 200 m. The north and the west are covered by red and yellow soil in the new world and are relatively flat. The yellow soil ditch is developed, and it is mostly U-shaped and dendritic, which is a hilly landscape. In the south, the bedrock is well-exposed, the rocks are seriously weathered and denuded, and the loess only remains on the slope or the top of the mountain, with little vegetation, which is a hilly landform.
After the deposition of the coal system in the Qinshui Basin, it has been modified by three tectonic movements: the Indo-Chinese, Yanshan, and Xishan. During the Indo-Chinese period, a depression centered on the east–west trend of Houma ∼ Qinshui ∼ Jiyuan was controlled by continuous subsidence; the Triassic river–lake clastic rocks with a thickness of several kilometers were deposited, and the thickness increased from north to south. The Indo-Chinese movement before the Triassic period caused the gradual disintegration of the North China Plateau, and the Qinshui Basin began to be uplifted as a whole and suffered from weathering and denudation. During the Yanshan period, the strongest tectonic movement in the Qinshui Basin was caused by the north-west-south-east extrusion stress, and the Carboniferous, Permian, and Triassic strata were uplifted and folded with the rise of the Shanxi uplift, forming a compound oblique in the axial direction near the north–south, with local fractures, uplift, and denudation. At the same time, the Moho surface arch in the Qinshui Basin and the local magmatic rock intrusion formed an unbalanced high geothermal field, which further deepened the coal metamorphism. Since the metamorphism was carried out when the coal seam was uplifted, folded, and stripped and the overlying static rock pressure was gradually reduced, it had an impact on the generation and preservation of fissures in the coal, which was different from the deep metamorphism. During the Xishan period, the tensional stress field at the eastern edge of the Ordos Basin produced north–west to south–east tensional stresses in the Shanxi uplift area, developed the Shanxi graben system, and formed the Jin interruption in the Qinshui Basin from Yuzi to Jiexiu, depositing thousands of meters of Neoproterozoic and Quaternary terrestrial clastic rocks. The north–east orthogonal fractures were formed in the north and southeast due to tensioning, resulting in the present state of the Qinshui Basin.
The classification type of the coalbed methane reservoir in the M area is based on the gas reservoir boundary type of the Qinshui Basin, which should be an oblique-hydrodynamic blocked coalbed methane reservoir. The main coal-bearing strata in the Qinshui Basin are the Taiyuan Group and the Shanxi Group, and the coal-bearing strata are about 150 m thick. The Taiyuan Group contains 5–11 layers of coal, and its #15 coal is the main recoverable coal seam. The Shanxi Group contains 3–4 layers of coal; the #3 coal is the main recoverable coal seam, and the total thickness of the two groups of coal seams is about 15 m. Usually, the thickness of the #15 coal is 1–8 m, and the average thickness is about 3 m. The coal seams are assigned. The general characteristics of the coal seam are thick in the east, thin in the west, thick in the north, and thin in the south, and it is a stable and mineable coal seam. The burial depth of the main layer of the #15 coal is 0–1500 m, and the current mining area does not exceed 800 m. The main influencing factor of the coal seam thickness is the geological evolution of the sedimentary environment, according to the predevelopment practice.
Coalbed methane gas content: Most of the coalbed methane components in the Qinshui Basin are methane, with content usually greater than 98%, and a small amount of ethane, nitrogen, carbon dioxide, etc., with content no more than 2%. At the edge of the basin, the coal seam is gradually exposed to the surface, and the proportion of methane gradually becomes smaller, while the proportion of nitrogen and carbon dioxide increases. The coalbed methane content in the Qinshui Basin is high, with most of the coalbed methane in the Shanxi Group #3 coal seam ranging from 7 m3/t to 32 m3/t, with the highest measured being 36 m3/t, and most of the coalbed methane in the Taiyuan Group #15 coal seam ranging from 6 m3/t to 21 m3/t, with the highest measured being 27 m3/t. The southern part of the Qinshui Basin has a high methane content and is one of the main areas of coalbed methane enrichment in China.
3 Coal Seam and Upper Aquifer Characteristics
Block M is located at the northern end of the Qinshui Basin, which is overall geographically higher in the north and lower in the south. The overall monoclinic structure is always south-dipping, and the local east–west oriented stress forms slightly amplitude syncline and anticline structures. The depth of the #15 coal increases from the north to the south, and the variation range is between 393.00 and 1743.30 m, with an average depth of 799 m; the thickness is stable and the variation ranges from 0.5 to 9.52 m, with an average of 3.6 m; the gas content is unevenly distributed in the plane, and the variation range is from 1.04 to 24.48 m3/t, with an average of 13.61 m3/t; the coal structure is mainly connate fractured and locally granular.
From the logging curve, it is seen that the #15 coal seam is stably distributed in the region, and the thick coal zone of the #15 coal is mainly distributed as two strips in the east and west of the block. According to the lithology analysis of nearly 20 m formation above the #15 coal, the average thickness of the water-bearing sandstone layer is about 7 m, and the middle region is thicker and gets thinner in the east and west directions. This trend can be seen from Figure 2.
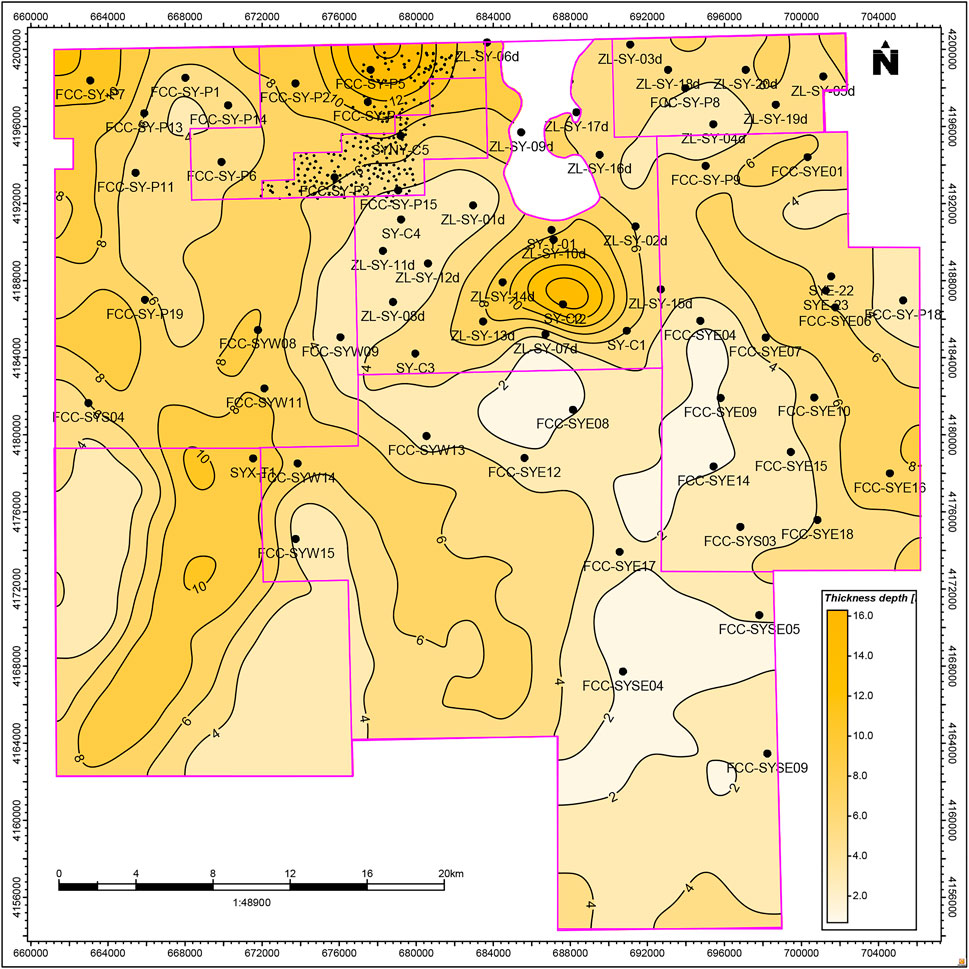
FIGURE 2. Thickness distribution of the water-bearing sandstone layer near the upper 20 m of the top plate of the #15 coal seam.
4 Simulation of the Aquifer Effect
Based on the geological background of a district in the northern part of the Qinshui Basin and the geological characteristics of the main coal seam and the upper aquifer mentioned above, the well group 165-166-167 in Area A was selected to establish the simulation model. The corresponding physical parameters including porosity, permeability, coal seam thickness, adsorbed gas content, and initial pressure temperature of the model were obtained from the average values of the logging interpretation results of each well. Reservoir simulation software, tNavigator, was used to create a three-dimensional dual-porosity geological model of the upper aquifer and the main #15 coal seam. The model contains three geologic layers including the aquifer, top sealing layer, and coal seam reservoir. The model contains 200 × 200 × 6 grids in the I, J, and K directions. The size of the grid dimension is 5 m in the I and J directions and 10, 10, and 5.4 m for the aquifer, upper sealing layer, and coal seam layer, respectively. The average well spacing of the three producers is 280 m.
4.1 Model Fitting Effect With Aquifer
The average water production rate around this well group is less than 20 m3/d, and the average gas production rate is 400 m3/d. However, the initial average daily water production of well 165 in this well group is as high as 70 m3/d. The high water production and low gas production wells are a challenge to fit to the numerical simulation history of CBM wells, and the historical production data of well 165 cannot be matched in the model with perforations only in #15 coalbed formation. The analysis inferred that the producing well 165 fractured the top sandstone water layer during the fracturing process, resulting in a significantly different water production than other surrounding gas wells in the same geological background and coal seam conditions. Through the numerical simulation model of the reservoir with coal seam with the top water layer established in this study, the influence of the top water layer on the production status of the CBM well was quantified by applying numerical simulation techniques. As shown in Table 1, the values of coalbed parameters are taken to be the same as the actual situation, and the maximum and minimum values of aquifer parameters are within the reasonable range of the values taken for the physical parameters of the aquifer in the block, which are as close as possible to the actual geological parameters’ conditions of the aquifer in a CBM block. Figures 3, 4 show the production history matching of each well considering the influence of the aquifer. It can be observed that when setting the thickness of the upper sandstone aquifer to 10 m, the porosity at 30%, the permeability at 80 mD, and the aquifer multiplier at 200 times of the primary water volume, the production history matching results were significantly improved.
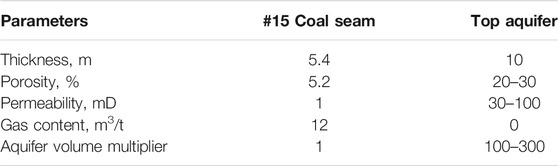
TABLE 1. Numerical simulation production fitting parameters.
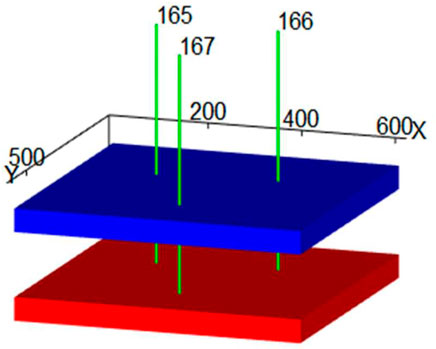
FIGURE 3. Three-layer mechanism model of the aquifer, sealing layer, and coal seam.
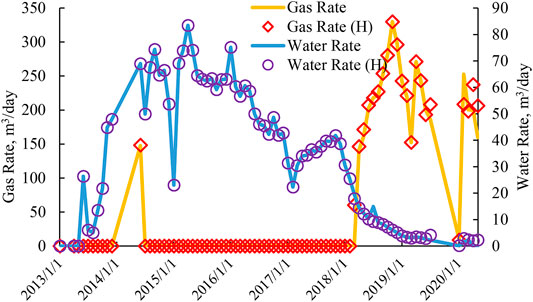
FIGURE 4. History matching of daily gas and water production of well 165.
Following the traditional development strategy of drainage, decompression, desorption, diffusion, and percolation to produce a single layer of coalbed, the reservoir pressure depleted too rapidly, and the water replenishment in the coal seam will be insufficient. Therefore, the production history of some of the high water cut wells was unable to be simulated. To resolve the challenge, the adjacent aquifer is communicated to simulate some of the long-term high water cut production wells (inferring that a large amount of produced water originates from the upper sandstone water layer). Special production wells with high water production and low gas production are simulated by opening the upper water layer to slow down the rate of pressure drop in the coal seam, allowing a small amount of gas desorption–diffusion in the coal seam. Since the water in the aquifer is extracted and replenished to the coal seam, the pressure drop rate in the coal seam was slowed down, and the ideal fitting of gas and water production index can be achieved by adjusting the water output from the aquifer to match the water production rate in the fracture system of the coal seam. Therefore, the results indicate that by perforating the water-bearing sandstone, the fitting effect is ideal and in line with the real geology and gas well productions through geologic engineering-integrated study.
4.2 Comparison of Traditional Simulation Results
Removing the aquifer from the model, a single coal seam model is established to simulate single mining of the #15 coal seam with a constant flow pressure drop. Taking well 165 as an example, the daily water production is less than 1/3 of the actual produced water volume. If the sandstone aquifer is not considered, the output water is completely extracted from the coal seam matrix and fracture drainage, but after a large amount of coal seam drainage, the formation pressure drops greatly, the gas desorption is fast, and a large amount of gas is produced, resulting in high gas production and insufficient water production in the gas well during the simulation, both of which did not match the production history, and the matching was poor.
According to the statistics shown in Table 2, the simulated peak gas production from a single coal seam layer is twice as high as the actual value, and the average gas production from a single well is 5.3 times higher than the actual one, indicating that the aquifer of the roof formation has an obvious inhibiting effect on the release of the actual gas production capacity of the coal seam in the model. Through the comprehensive analysis of geology (fine interpretation of logging), engineering (fracturing), drainage, and numerical simulation, it can be judged that the aquifer layer is the main controlling factor for the production capacity of CBM wells in a certain region, and the development of top plate water-bearing sandstone or fracturing communication will lead to the drainage of high water production and low gas production, thus affecting the overall regional drainage and gas production. The peak water production of this well is 26 m3/d. According to the understanding of the integrated geology and engineering study in the early stage of the block, the peak water production exceeding 10 m3/d is most likely to be water production from the sandstone of the top aquifer, which indicates that the numerical simulation model of coal seam–aquifer coproduction is more in line with the real geological situation. The simulation shows that the water production of each well at the later stage is lower than 5 m3/d, which is consistent with the reality, indicating that the limited water body is gradually emptied by the multi-well productions of the aquifer, and the water production at the later stage mainly reflects the real water production capacity of the coal seam.
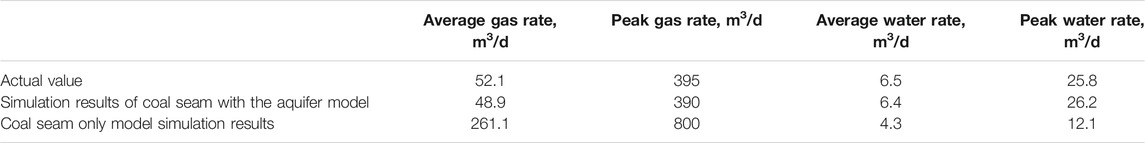
TABLE 2. Comparison of fitting results of different models with actual values.
5 Upscaled Model Simulation
5.1 Numerical Simulation Model
Block M Area A is selected to establish a three-dimensional dual-porosity (matrix and fracture systems) model including the aquifer, sealing layer, and coal seam, with corner point grid dimensions of 50 m × 50 m × 4.08 m and a total count of grid dimensions of 307 × 162 × 6 = 298404. The initial reservoir pressure of the coal seam is 3.3 MPa, and 206 producers are included in the model. The gas saturation in the aquifer matrix and fracture system is 0, and the water volume is set to be 186.47 × 10⁸ m3; the aquifer fracture system contains 8.8 × 10⁸ m3 of water. The gas volume in the coalbed matrix system is 84.8 × 10⁸ m3 without water, and the water volume in the coalbed fracture system is 2.8 × 10⁷ m3 without containing gas.
The model aquifer matrix porosity is 30%, and the aquifer fracture porosity is 30%. The coal seam matrix porosity is 100%, and the coal seam fracture porosity is 2.6% on average. Model permeability parameters: the permeability of the model aquifer matrix system is 0 mD, and the permeability of the aquifer fracture system is 30 mD. The permeability of the coalbed matrix system is 0 mD, and the permeability of the coalbed fracture system is 7.8 mD on average. The water saturation of both the model aquifer matrix system and the fracture system is 100%. The water content saturation in the model coalbed matrix system is 0%, and the distributions are shown in Figure 5.
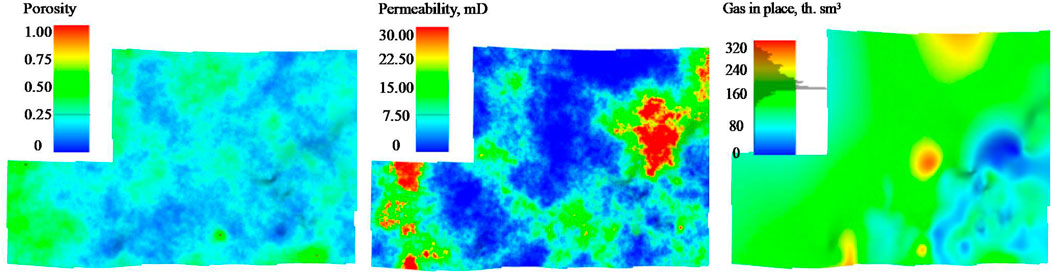
FIGURE 5. Porosity/permeability/gas content parameter fields of the fracture system in the coal seam.
5.2 Comparison of History Matching
5.2.1 Overall Block History Matching Results
During the production, the water rate is greater than historical data and the gas production is slightly lower than historical data. From the production during 2005–2020, 66 wells in block A produced 8.43 × 10⁷ m3 cumulatively, with an average pressure decline of 1.0 MPa in the gas reservoir. The historical water production was 6.60 × 10⁶ m3, and the simulated water production was 6.62 × 10⁶ m3. The historical gas production was 8.43 × 10⁷ m3, and the simulated gas production was 8.41 × 10⁷ m3. Using the method proposed in this study, for some of the abnormal high water production wells, after opening the top aquifer layer, the history matching was significantly improved, and the main fitting indicators of the block are shown in Figure 6 below.

FIGURE 6. History matching of the daily gas and water production in the upscaled model.
5.2.2 History Matching Without Aquifer
In the block model, some wells may exhibit a high gas production rate without significant water cut. This could be resulting from the different extent of local coal seam layer communication with the upper aquifer layers and the seal layer in between was intact, and these wells are referred to as “typical wells” in this study. The peak gas production of a typical gas well can reach as high as 3,000 m3/d, and the average gas production is in the range of 2000–2,500 m3/d. The gas production history matching of this well is basically consistent with the history date, but the water production is obviously insufficient. The actual water production at the beginning of the well was 20 m3/d, while the highest water production of the coal seam perforated only model is less than 15 m3/d, and the water production cannot be matched. After communicating with the upper aquifer, adjusting the permeability of the aquifer fracture, and controlling the water supply from the upper aquifer to the lower coal seam, when the fracture permeability is adjusted to 135 mD, the well can significantly improve its water production matching, as shown in Figure 7 below.
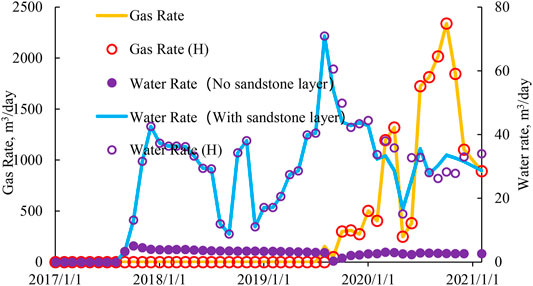
FIGURE 7. History matching result of daily gas–water and cumulative gas–water is significantly improved when the aquifer is considered.
5.3 Analysis of Results
Combined with the analysis of dynamic and simulation results, the upper aquifer developed at a distance of 0–20 m above the sealing layer of the #15 coal seam in block M may be the main source of abnormally large water production in some CBM wells. If the average porosity of this sandstone aquifer layer is greater than 5% and is about 10 m away from the coal seam, there is a greater risk of abnormal water production. The aquifer at the top of the block has good porosity and permeability; once communicated, the CBM wells will have high water production and low gas production, but through the overall pressure reduction of multiple wells, the aquifer water will be gradually depleted after about 2–4 years, and the coalbed desorption and gas production will be improved during the pressure reduction. The drainage situation and numerical simulation results showed that the aquifer layer on the top of the #15 coal has a greater impact on the fracture transformation, depressurization, and desorption of the coal seam. For wells where the upper sealing layer of the coal seam is close to the upper aquifers, fracturing design can be considered to avoid pressing open the upper aquifer to optimize the #15 CBM production capacity.
6 Conclusion
A CBM production simulation model that considers the influence of the upper aquifer can simulate the abnormal production situation of some gas wells with higher water cut. This method can significantly improve the accuracy of the numerical simulation history matching in the study area, enhance the reliability of the remaining gas study, and lay the foundation for the subsequent development strategy optimization.
The upper sandstone aquifer developed at a distance of 0–20 m above the top of the #15 coal seam in Block M may be the main source of abnormally large water production in some CBM wells. If the average porosity of this sand layer is greater than 5%, and there is a greater risk of abnormal water production near the 10 m range from the coal seam.
The depletion and recovery strategy and numerical simulation results showed that the upper aquifer on the top of the #15 coal seam layer has a greater impact on the coal seam fracture transformation and pressure drop and desorption. For wells where the upper sealing layer of the coal seam is close to the upper aquifers, fracturing design can be considered to avoid pressing open the upper aquifer to optimize #15 CBM production capacity.
Numerical simulation techniques for coalbed methane considering the upper aquifer layer near the top and bottom of coal seams can be applied to modify the numerical simulation model considering the action of water migration within the field to quantitatively analyze the influence of aquifer layers on the production performances of CBM wells. This method established reliable quantitative analysis methods and techniques for three-dimensional exploration and production of coalbed methane.
Author Contributions
YP provides technical guidance and thesis writing guidance. S-MQ finished writing her thesis. ZY provides field data. TJ completes the English translation. NW completes the project model analysis. DJ provided on-site project data.
Funding
This work was supported by the China Postdoctoral Science Foundation (No. M2019650965), the Major R and D Plan of Sichuan Province (No. 2020YFQ0034), and the CNOOOC Technology Project (No. CNOOC-KJ135ZDXM40ZL0).
Conflict of Interest
Authors ZY and DJ were employed by the company CNOOC Shanxi Coalbed Methane Company Limited.
The remaining authors declare that the research was conducted in the absence of any commercial or financial relationships that could be construed as a potential conflict of interest.
Publisher’s Note
All claims expressed in this article are solely those of the authors and do not necessarily represent those of their affiliated organizations or those of the publisher, the editors, and the reviewers. Any product that may be evaluated in this article or claim that may be made by its manufacturer is not guaranteed or endorsed by the publisher.
References
Cai, D. M., Sun, L. D., and Zhao, Y. J. (2009). A Preliminary Investigation on the Mechanism of Coal Reservoir Permeability Development Based on the Degree of Coal Evolution[J]. J. Shandong Univ. Sci. Tech. (Natural Sci. Edition) 28 (02), 22–27.
Cui, X. S., Zhou, R., and Zhang, K. (2021). Study on the Evaluation of Coal-Bed Methane Resource Potential in the Western Shouyang Area of Qinshui Basin [J/OL]. Coal Sci. Tech. 1–10. [2021-07-29] http://kns.cnki.net/kcms/detail/11.2402.TD. 20201218.1653.015.html.
Deng, P., Zhu, S., Meng, S., Sun, H., Peng, X., and Wang, C. (2019). “Influence of Roof Water Bodies on the Dynamics of Coalbed Methane Production,” in China Coalbed Methane Exploration and Development Technology and Industrialization Development Strategy - Proceedings of the 2019 Symposium on.
Guo, J., and Zhang, B. (2017). Current Situation and Outlook of Coal Bed Methane (Coal Mine Methane) Development and Utilization in China[J]. Coal Eng. 49 (03), 83–86.
Hou, X. (2020). Gas Control Mechanism and Co-generation Reservoir Effect in Deep Coal Gas Reservoirs in Qinshui Basin[D]. Xuzhou, Jiangsu: China University of Mining and Technology.
Hu, Q., Mao, C., Fan, B., Jia, H., Zhang, Q., Zhang, X., et al. (2021). Law of Reservoir Pressure Drop Expansion in High Coalbed Methane wells and its Application in Well Network Optimization [J/OL]. J. Coal, 1–10. 2021-07-29. doi:10.13225/j.cnki.jccs.CB21.0769
Lai, F. (2020). Key Technology and Scale Application for High Coal-Grade Coal-Bed Methane Reservoir Development. Beijing: China University of Geosciences–1021.
Liu, A., Liu, S., Liu, P., and Satya, H. (2021). The Role of Sorption-Induced Coal Matrix Shrinkage on Permeability and Stress Evolutions under Replicated in Situ Condition for CBM reservoirs[J]. Fuel, 294.
Liu, B., Wang, H., Zhang, S., Zhang, X., and Liu, Q. (2021). Data Mining on the Influence of Capillary Force on the Productivity of CBM Wells[J]. J. Phys. Conf. Ser. 1894 (1).
Lv, Y., Liu, Y., Chen, G., Wang, C., Zhu, X., Guo, G., et al. (2020). Analysis of Factors Influencing the Capacity of Horizontal Coalbed Methane wells in the Southern Qinshui Basin[J]. Coal Sci. Tech. 48 (10), 225–232.
Ma, D. (2003). Analysis of Gas Recovery Mechanism of Coalbed Methane Wells[J]. J. Xi'an Inst. Sci. Tech. 2003 (02), 156–159.
Mu, Y., Fan, N., and Wang, J. (2021). CBM Recovery Technology Characterized by Docking Ground Multi-branch Horizontal wells with Underground Boreholes[J]. Energy Sourc. A: Recovery, Utilization, Environ. Effects 43 (6). doi:10.1080/15567036.2019.1630519
Peng, S., Zhu, S. Y., Sun, H. S., Meng, S. C., Deng, P., and Wang, C. (2019). “Unconventional Understanding in Coal-Bed Methane Development Practice,” in China Coalbed Methane Exploration and Development Technology and Industrialization Development Strategy - Proceedings of the 2019 Symposium on Coalbed Methane (Nanjing, Jiangsu: Geology Press), 148–157.
Qin, Y., Yuan, L., Hu, Q., Ye, J. P., Hu, A., Shen, B., et al. (2012). Current Status and Development Direction of Coalbed Methane Exploration and Development Technology in China[J]. Coal Sci. Tech. 40 (10), 1–6.
Sang, H., Sang, S., Zhou, X., Liu, H., Shi, W., and Zhang, K. (2011). Study on Production History Fitting and Well Network Optimization of Coalbed Methane wells in Southern Qinshui Basin[J]. J. Shandong Univ. Sci. Tech. (Natural Sci. Edition) 30 (04), 58–65.
Sun, L. D., Zhao, Y. J., and Cai, D. M. (2007). Study on the Influence of Stress Field, Ground Temperature Field and Pressure Field on the Permeability of Coal-Bed Methane Reservoirs-Eexample in the Qinshui Basin, Shanxi [J]. J. Shandong Univ. Sci. Tech. (Natural Sci. Edition) 2007 (03), 12–14+31.
Sun, R. Y., Yao, S. F., Mei, Y. G., Sun, Y., Sun, X. F., and Zhang, X. M. (2019). Factors Affecting the Capacity of Fractured Horizontal Coalbed Methane Wells[J]. Xinjiang Pet. Geology. 40 (05), 575–578.
Taboada Jose, V., Diaz-Casas Vicente, , and Yu, Xi. (2021). CBM Challenges and Opportunities for O&M of the Johan Sverdrup Oil and Gas Field [J]. Amsterdam: Journal of Petroleum Science and Engineering, 205.
Ting, R. (2017). Sensitivity Analysis of Coal Reservoir Parameters Based on Numerical Simulation Method[J]. China Coal Geology. 29 (04), 31–34.
Wu, Y., Tao, S., Tian, W., Chen, H., and Chen, S. (2021). Advantageous Seepage Channel in Coal Seam and its Effects on the Distribution of High-Yield Areas in the Fanzhuang CBM Block, Southern Qinshui Basin, China[J]. Berlin: Natural Resources Research. (prepublish).
Zhang, K. (2021). Analysis of Factors Influencing Coal-Bed Methane Content in the Anzaidong Area of the Qinshui Basin[J]. Coal Tech. 40 (06), 96–97.
Zhang, Y. P., Yang, Y. F., Shao, G. L., Chen, L. W., Wei, N., and Zhang, L. W. (2017). Problems and Countermeasures in Horizontal Well Exploitation of High Coal-Grade Coal- Bed Methane in Fanzhuang-Zhengzhuang Block of Qinshui Basin[J]. Nat. gas industry 37 (06), 46–54.
Zhao, Y. (2020). Reservoir Characteristics and Sensitivity Evaluation of a Coal-Bed Methane Block in the Qinshui Basin, Shanxi [J]. China Coal Geology. 32 (03), 34–38.
Zhu, S.-Y., Peng, X.-L., Du*, Z.-M., Wang, C.-W., Deng, P., Mo, F., et al. (2017). Modeling of Coal Fine Migration during CBM Production in High-Rank Coal. Transp. Porous Med. 118 (1), 65–83. doi:10.1007/s11242-017-0847-7
Zhu, S., Du, Z., Li, C., You, Z., Peng, X., Jiang, H., et al. (2019). Effects of Numerical Dispersion on Pressure Diffusion in CBM Reservoirsffects of Numerical Dispersion on Pressure Diffusion in CBM Reservoirs[J]. Fuel 251, 534–542. doi:10.1016/j.fuel.2019.04.015
Zhu, S., Salmachi, A., and Du, Z. (2018). Two Phase Rate-Transient Analysis of a Hydraulically Fractured Coal Seam Gas Well: A Case Study from the Ordos Basin, China. Int. J. Coal Geology. 195, 47–60. doi:10.1016/j.coal.2018.05.014
Zhu, S. Y., Peng, S. L., Zhang, S., Meng, S-C., Deng, P., and Wang, C-W. (2019). “Reflections and Discussion on Gas Fugacity States in Undersaturated Coalbed Methane Reservoirs,” in China Coalbed Methane Exploration and Development Technology and Industrialization Development Strategy - Proceedings of the 2019 Symposium on Coalbed Methane (Nanjing, Jiangsu: Geological Press), 311–317.
Keywords: coalbed methane, fracturing, production capacity, aquifer, numerical simulation, top plate Chinese library classification number: TE349
Citation: Ping Y, Simin Q, Yafei Z, Jiawei T, Wei N and Jing D (2022) Numerical Simulation Study of the Upper Aquifer Impact on the Coalbed Methane Production. Front. Energy Res. 9:789021. doi: 10.3389/fenrg.2021.789021
Received: 04 October 2021; Accepted: 13 December 2021;
Published: 19 January 2022.
Edited by:
Wei Wang, Aramco Services Company, United StatesReviewed by:
Hussein Hoteit, King Abdullah University of Science and Technology, Saudi ArabiaYang Xiao, Xi’an University of Science and Technology, China
Copyright © 2022 Ping, Simin, Yafei, Jiawei, Wei and Jing. This is an open-access article distributed under the terms of the Creative Commons Attribution License (CC BY). The use, distribution or reproduction in other forums is permitted, provided the original author(s) and the copyright owner(s) are credited and that the original publication in this journal is cited, in accordance with accepted academic practice. No use, distribution or reproduction is permitted which does not comply with these terms.
*Correspondence: Yue Ping, eXVlcGluZ2FhQDEyNi5jb20=; Tu Jiawei, RGF2aWQuSmlhd2VpLnR1QG5tdC5lZHU=