 Meiqi Song
 Xiaojing Liu
- 1Institute of Applied Thermofluidics, Karlsruhe Institute of Technology, Karlsruhe, Germany
- 2School of Nuclear Science and Engineering, Shanghai Jiao Tong University, Shanghai, China
Supercritical heat transfer systems may undergo trans-critical procedures and work at subcritical conditions during startup, shutdown, or some accidents. However, well-validated heat transfer models for the high-pressure condition (
Introduction
A substance above its critical temperature Tc and critical pressure Pc is referred as a supercritical fluid (SCF). As can be seen from Figure 1, the vapor–liquid phase change in the supercritical region disappears, and the fluid is always single phase. With its unique properties, SCFs have been widely used in a variety of fields such as chemical engineering, power generation, refrigeration, and food engineering (Eggers, 2012).
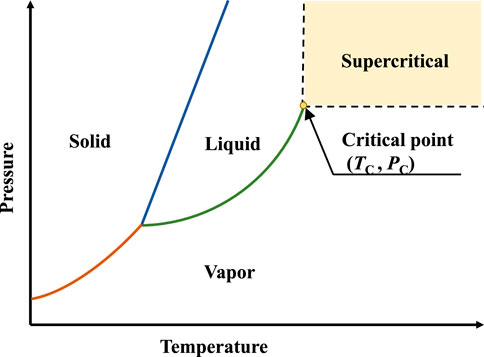
FIGURE 1. Phase diagram (pressure–temperature) of substance (Debenedetti et al., 1994).
Supercritical power cycles, working with SCFs, are of great interest for their higher thermal efficiency. Currently, supercritical water (SCW) and supercritical carbon dioxide (sCO2) are actively considered as a coolant for power cycles throughout the world. For instance, it has been reported by Marion et al. (2019) that the STEP 10 MWe sCO2 Pilot Plant Demonstration would achieve a net efficiency over 50%. Particularly, supercritical power cycles have a great potential in waste heat recovery and application of clean energy (such as nuclear energy, solar energy, geothermal energy, and bioenergy) (Ahn et al., 2015; Sarkar, 2015; Crespi et al., 2017).
(A) Waste heat
The application market of the industrial waste is extraordinarily large, such as waste heat from metal mines, chemical plants, cement plants, gas turbines, and reciprocating engines. However, the development of the utilization of low temperature waste heat is still limited. The critical temperature of CO2 is about 30.98°C, which allows the sCO2 power cycles to be applied for various temperature ranges and therefore for low-temperature heat sources (Sarkar, 2015; Musgrove et al., 2017). Currently, organic Rankine cycle (ORC), with the flammable hydrocarbon-based organic as working fluid, is applied to use the low-temperature heat sources. For safety measures, an intermediate loop is used to transfer heat from the heat source to the organic fluid. Obviously, when applying sCO2 power cycle to waste heat recovery, the safety measures are not required further, since CO2 is nontoxic and nonflammable. Moreover, compared to ORC plants, the equipment size of sCO2 power cycles would be smaller, and it could work with even lower heat source temperature (Li et al., 2017; Poerner et al., 2017).
(B) Nuclear energy
The supercritical water-cooled reactor (SCWR), as the only reactor concept with supercritical water as working fluid, was recommended as one of the six most promising Generation IV reactor systems by the Generation IV International Forum (GIF) (uclear Energy R, 2002). Designed to be operated at 25 MPa and outlet temperature over 500°C, the net efficiency of SCWR can reach up to 45%. In addition, due to a direct-cycle design with single-phase coolant, expensive plant components utilized in conventional nuclear power plants such as steam generators in pressurized water reactor (PWR) or moisture separator and steam dryer in boiling water reactor (BWR) are eliminated in SCWR. Hence, SCWR achieves a considerable reduction in capital costs (Oka et al., 2010; Cheng et al., 2016; Pioro et al., 2016; Pioro and Pioro, 2016; Schulenberg et al., 2016).
Concepts of cooling system with sCO2 power cycles have been proposed for various kinds of Generation IV reactors, such as direct cycle and indirect cycle (Qi et al., 2018). Compared to the most often considered gas cycles for gas cooled fast reactor (GFR), i.e., Helium cycles, the sCO2 cycles eliminate the leakage problem practically, as CO2 is a triatomic gas with a much higher molecular weight (Dostal et al., 2002; Hejzlar et al., 2006). The high-density sCO2 enables the cycle layout to be more compact and provides an acceptable size of heat exchangers. Taking place of the traditional Rankine superheated steam cycle, the application of sCO2 Brayton cycle to the sodium-cooled fast reactor (SFR) could avoid considering the sodium–water reaction since sCO2 is stable and relative inert in the working range (Sienicki et al., 2014).
For fusion reactors, a simple but high-efficiency sCO2 Brayton cycle could realize the integration of all three main heat sources (i.e., blanket, divertor, and vacuum vessel) taking the advantage of the wide working range of sCO2 Brayton cycle (Linares et al., 2015; Vesely et al., 2017; Syblik et al., 2019).
(C) Solar energy, geothermal energy, and bioenergy
sCO2 power cycle is appealing to be utilized in renewable energy systems, not only taking the advantage of its higher efficiency, good power scalability (∼10–150 MWe), smaller size, and simpler layout but also because CO2 is environment-friendly. Moreover, it allows concentrating solar power (CSP) plants to be applied in the desert places where water is scarce while solar energy is abundant (Osorio et al., 2016; Binotti et al., 2017; Yin et al., 2020). Similar for dry geothermal reservoirs, in which water is inadequate, the energy resource could be captured by injecting cold sCO2 through wells into the thermal plume (Frank et al., 2012; Wang et al., 2019). As indicated, another benefit is that 2% of the CO2 flowing through the geothermal heat source would be captured in the well (Musgrove et al., 2017).
As seen, supercritical power cycles have been designed to utilize various energy sources. Studies of heat transfer characteristics for supercritical condition are thereby carried out. Since supercritical fluid is single phase, the two-phase boiling crisis phenomena, which is a crucial limitation to conventional subcritical systems, are eliminated and regarded as an advantage of the supercritical power cycle (Oka et al., 2010). However, trans-critical processes in which the system pressure transfers between supercritical condition and subcritical condition could happen during startup, shutdown, and abnormal transients such as the loss-of-coolant accidents (LOCA) (Liu et al., 2016). Obviously, the boiling crisis problem cannot be avoided when taking these trans-critical transients into consideration.
Moreover, as can be seen from Figure 2, differences in thermal property between the saturated vapor and saturated liquid phase will be smaller when the pressure increases, and in the high-pressure region, thermal properties change drastically, which may lead to the difference in heat transfer characteristic compared to conventional pressure condition. It is noted that the evaporation heat decreases to zero at the critical point, which could enhance the vaporization process. Thus, in the high-pressure region, the boiling crisis could occur even with a low heat flux, and post-CHF heat transfer region will be encountered, which could even cause burnout of the heated wall. Therefore, the heat transfer behavior not only at supercritical pressure but also at high-pressure subcritical condition is of great significance for the supercritical systems.

FIGURE 2. Variation of saturated properties for water (Lemmon et al., 2007). (A) Density. (B) Specific heat. (C) Surface tension and evaporation heat. (D) Thermal conductivity. (E) Dynamic viscosity.
In subcritical condition, with the development of conventional steam generators, the great majority of previous heat transfer research are usually at pressure lower than the PWR working pressure (15.5 MPa, with reduced pressure at 0.7,
In the present work, experimental databank of CHF and post-CHF heat transfer for the high-pressure condition will be established, and existing prediction methods will be collected based on literatures all over the world and previous research by the authors. Thereby, prediction methods could be examined with the aid of the new developed experimental databank. Besides, the influence of pressure on CHF and post-CHF heat transfer will be analyzed.
Assessment of CHF Prediction Method for High-Pressure Region
Boiling crisis occurs when the heat flux raises up to a high level that the heated surface can no longer support the continuous liquid-wall contact (Thermohydrau, 2001). The heat flux at the boiling crisis point is usually referred as critical heat flux (CHF). Because of the poor heat transfer capability of vapor, the boiling crisis could lead to failure of the heated surface. Therefore, CHF is a significant safety limitation.
Regarding flow boiling in a pressure duct, two boiling crisis mechanisms are supposed to be considered (Tong and Tang, 2018). The first is referred as “departure from nucleate boiling (DNB),” as shown in Figure 3A, occurring in a subcooled or low-quality condition. The upstream of the DNB point is the so-called “nucleate boiling” (bubbly flow). After the DNB point, the flow pattern transfers to inverted annular flow, where the liquid phase forms as a continuous core with dispersed vapor bubbles, while the vapor phase flows along the wall. Since vapor flows faster, it causes instabilities in the liquid core and leads to break up of the liquid core. The flow will transfer to dispersed droplet flow in which the liquid droplets dispersed in the vapor phase (Tong and Tang, 2018). Figure 3B exhibits another kind of boiling crisis, “dryout (DO).” The upstream of the DO point is an annular flow, where the liquid film flows along the heated wall. Then, the dryout of the liquid film leads to dispersed droplet flow where the liquid droplets dispersed in vapor phase, and the heated wall lost the cooling through continuous liquid phase. Normally, the dryout type boiling crisis occurs under higher quality (Tong and Tang, 2018).
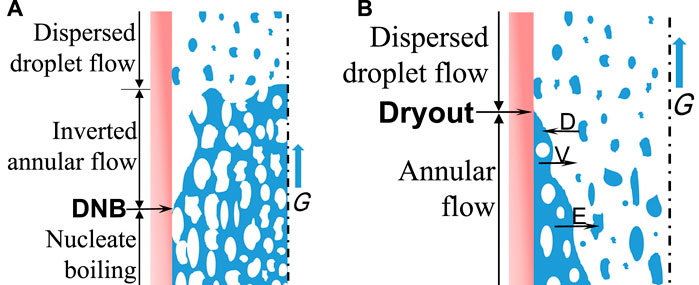
FIGURE 3. Sketch of flow patterns near the CHF point for flow boiling (Tong and Tang, 2018). (A) DNB. (B) Dryout.
CHF Databank for High-Pressure Condition
CHF experiments are usually carried out with constant mass flux, pressure, and inlet subcooling, whereas the supplied heat flux is increased stepwise until boiling crisis occurs. In the present work, experiments in uniformly heated round tubes are collected from literatures and previous experiments carried out in the Institute for Applied Thermofluidic (IATF) (Song et al., 2021a; Katto and Yokoya, 1984; (2019). Unpublished, 2019). Accordingly, a CHF databank with water, R12, CO2, or helium as coolant is obtained for reduced pressure (P/Pc) above 0.7. For each experiment record, the information contains the system pressure
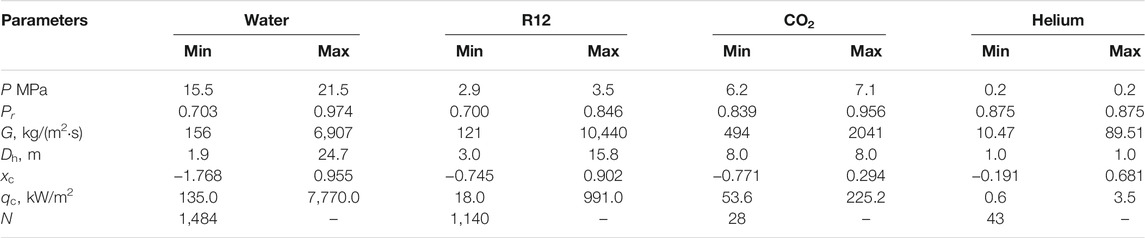
TABLE 1. Parameter range of high-pressure CHF databank.
Existing CHF Prediction Method for High-Pressure Condition
Up to now, numerous prediction methods for CHF have been proposed (Hall and Mudawar, 2000). For example, the W-3 correlation (Tong, 1967), which could evaluate the value of critical heat flux as a function of pressure, mass flux, quality, hydraulic diameter, and inlet subcooled, has been widely applied for the safety analysis of PWR. However, prediction methods for the high-pressure region (
In the present work, CHF prediction methods that are applicable to high-pressure condition are collected from the literature and summarized in Table 2. Most of these prediction methods were derived from water experiments. Nevertheless, Kariya et al. (2013) developed a CHF correlation from experiments with R22, R134a, or water as coolant. Vijayarangan correlation (Vijayarangan et al., 2006) is derived from their R134a measurements. Shah correlation (Mohammed Shah, 1987) is developed from 23 different fluids including water, halocarbon refrigerants, chemicals, liquid metals, helium, and other cryogens. Chen correlation (Chen et al., 2017), Becker correlation (Becker et al., 1972), Lombardi correlation (Lombardi, 1995), Vijayarangan correlation (Vijayarangan et al., 2006), and Shah correlation (Mohammed Shah, 1987) require known inlet quality

TABLE 2. CHF prediction models for high-pressure condition.
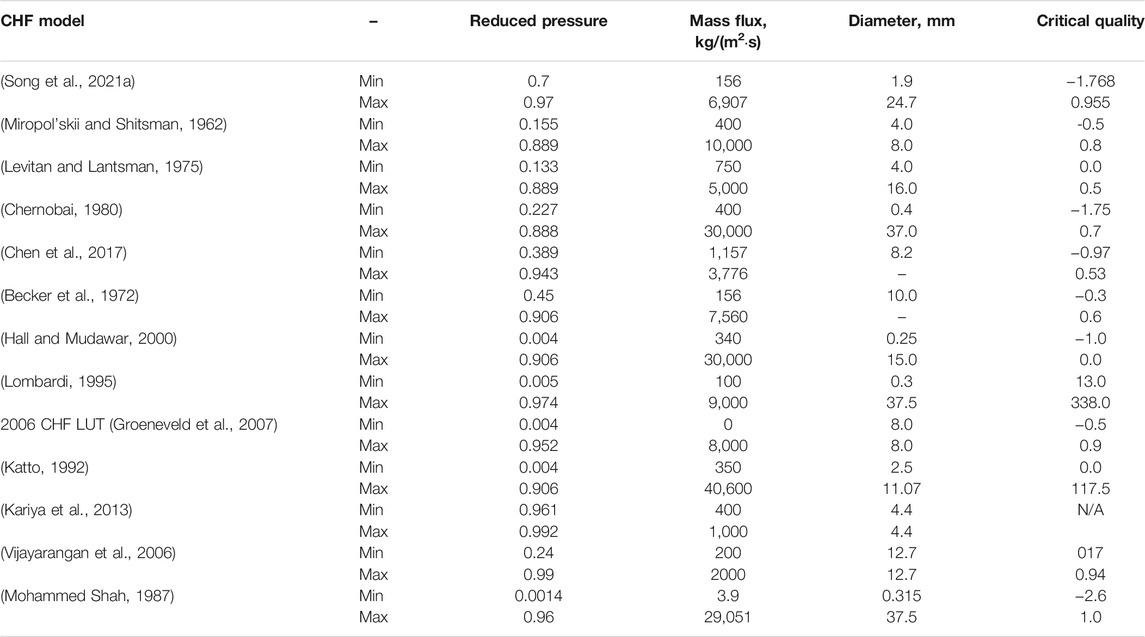
TABLE 3. Validity range of high-pressure CHF prediction models.
Assessment of High-Pressure CHF Prediction Method
In order to evaluate predictive capability of CHF models with the aid of CHF databank, for each experimental data point, the error parameter is defined by,
with
Applied to high-pressure CHF databank for water as listed in Table 1, the mean error and RMS error of CHF prediction models are summarized in Table 4. As exhibited, mean error of Levitan correlation (Levitan and Lantsman, 1975), Chernobai correlation (Chernobai, 1980), Becker correlation (Becker et al., 1972), Vijayarangan correlation (Vijayarangan et al., 2006), and Shah correlation (Mohammed Shah, 1987) are above ±50%. Although only applied to 414 subcooled data points, the RMS error of Hall correlation (Hall and Mudawar, 2000) and Katto’s sublayer dryout model (Katto, 1992) is still up to 42.4% and 89.1%, respectively. The Song correlation (Song et al., 2021a) proposed by the author obtains mean error of 2% and RMS error of 37.4%, which seems better than other prediction models.
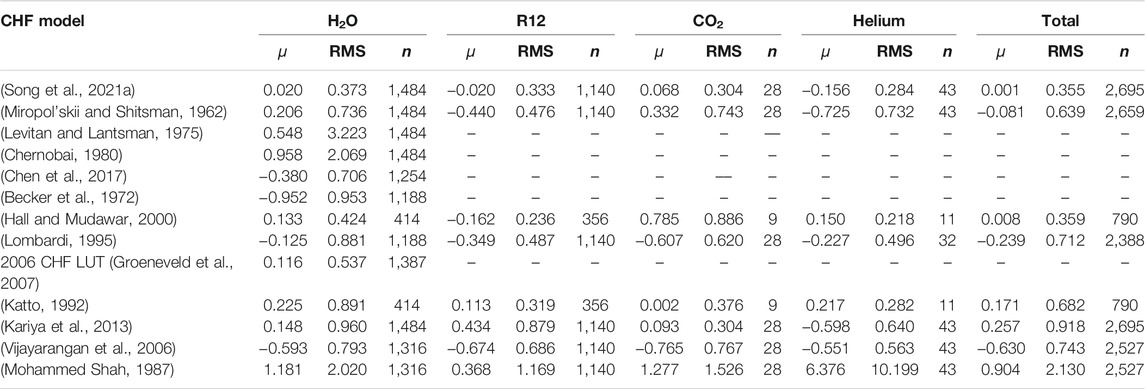
TABLE 4. Predictive capability of CHF models for water experiments.
Since some prediction models in Table 2 developed from water experiments are not dimensionless, they could not be applied to non-aqueous fluids. Thereby, Table 4 only gives prediction accuracy of dimensionless models when compared with experiments using non-aqueous fluids (R12, CO2, or helium) as coolant. It is indicated that when applied to different fluids, the prediction capability of CHF prediction model is also different. In general, RMS error of Miropol’skii correlation (Miropol'skii and Shitsman, 1962), Vijayarangan correlation (Vijayarangan et al., 2006), and Shah correlation (Mohammed Shah, 1987) exceeds 50%. When applied to 356 subcooled experimental data points for R12, Hall correlation (Hall and Mudawar, 2000) and Katto’s sublayer dryout model (Katto, 1992) obtain RMS error of 23.6% and 31.9%, respectively. Besides, Katto’s sublayer dryout model (Katto, 1992) gives a good prediction to subcooled CO2 experiments with mean error of 0.2% and RMS error of 37.6%.
Furthermore, the prediction capability of these eight dimensionless models is evaluated with experiments carried out with four different fluids (water, R12, CO2, and helium) together. The variations in error parameters versus the reduced pressure are shown in Figure 4. Besides, the mean error and RMS error in different ranges of reduced pressure are displayed in Figure 5. Apparent systematic deviation of Miropol’skii correlation (Miropol'skii and Shitsman, 1962), Lombardi correlation (Lombardi, 1995), Katto’s sublayer dryout model (Katto, 1992), Kariya correlation (Kariya et al., 2013), Vijayarangan correlation (Vijayarangan et al., 2006), and Shah correlation (Mohammed Shah, 1987) can be observed.
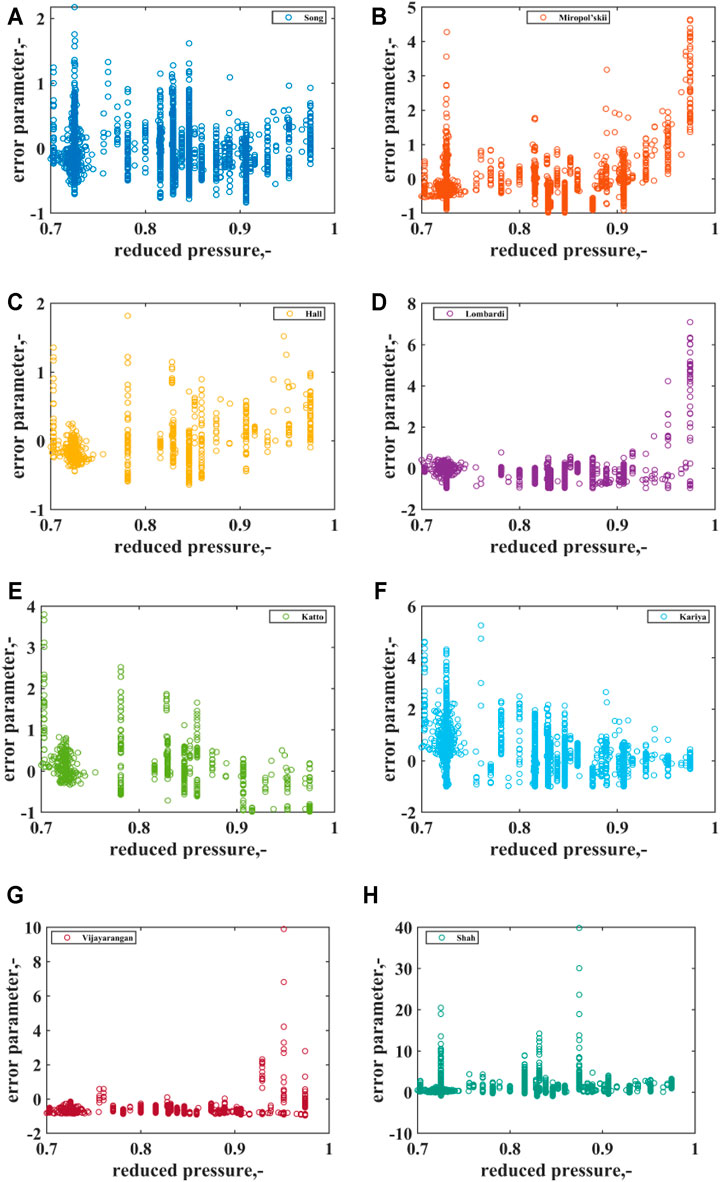
FIGURE 4. Distribution of error parameters versus reduced pressure. (A) Song correlation (Song et al., 2021a). (B) Miropol’skii correlation (Miropol'skii and Shitsman, 1962). (C) Hall correlation (Hall and Mudawar, 2000). (D) Lombardi correlation (Lombardi, 1995). (E) Katto’s sublayer dryout model (Katto, 1992). (F) Kariya correlation Kariya et al., 2013). (G) Vijayarangan correlation (Vijayarangan et al., 2006). (H) Shah correlation (Vijayarangan et al., 2006).
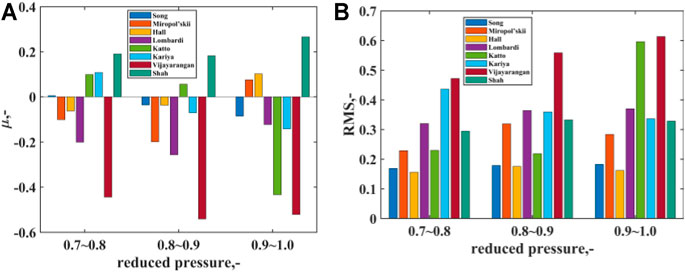
FIGURE 5. Mean error and RMS error in different reduced pressure ranges. (A) Mean error. (B) RMS.
As discussed above, with respect to general prediction accuracy and predictive capability under different pressures, the Song correlation (Song et al., 2021a) will be recommended, since it shows the best prediction accuracy for different fluids and performs good at different pressure conditions even when reduced pressure is up to 0.974.
In addition, since conditions of low mass flux achieves more interest in safety analysis, the performance of Song correlation (Song et al., 2021a) at different mass flux conditions gets evaluated. As Figure 6 shows, it is demonstrated that there is no apparent systematic error at low mass flux conditions. Therefore, the CHF prediction model proposed by Song et al. (2021a) can be applied to safety analysis.

FIGURE 6. Prediction accuracy of Song correlation (Song et al., 2021a) varied with mass flux.
Effect of Pressure on CHF
As shown in Figure 7, the discrete dots are experimental results, while the solid lines stand for the corresponding calculation results with the Song correlation (Song et al., 2021a). Figure 7A is the comparison of CHF for pressure at 16.0 and 20.0 MPa, with mass flux at 1,000 kg/(m2·s) and tube diameter at 10 mm. Figure 7B shows the results with constant mass flux at 1,500 kg/(m2·s) and tube diameter at 10 mm, while the pressures are at 16, 18.5, and 21.5 MPa, respectively. Obviously, the higher pressure results in a lower CHF. As shown by Figure 2, the increase in pressure leads to a reduction in evaporation heat, which promotes the vaporization process. Thereby, the heat flux leading to dryout of liquid sublayer [DNB-type boiling crisis, if considering the sublayer dryout model (Lee and Mudawwar, 1988; Katto, 1990; Celata et al., 1994; Liu et al., 2000)] or liquid film (dryout-type boiling crisis) will decrease. Hence, the value of CHF both for DNB and dryout drops when the pressure increases.
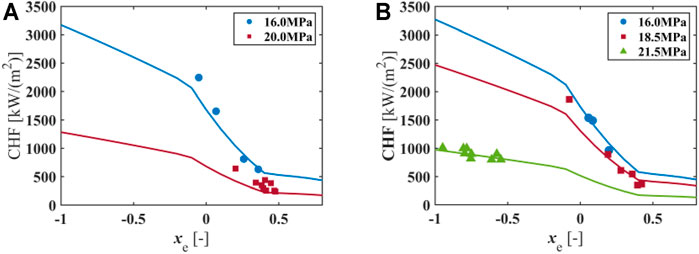
FIGURE 7. Variation in CHF with quality at different pressures for water. (A) G = 1,000 kg/(m2·s), D = 10 mm. (B) G = 1,500 kg/(m2·s), D = 10 mm.
Assessment of Post-CHF Heat Transfer Prediction Methods for High-Pressure Condition
As discussed before, post-CHF heat transfer will be encountered after the occurrence of boiling crisis. In this region, due to loss of cooling through continuous liquid phase, the heated wall may undergo drastic temperature increase.
After the boiling crisis takes place, the post-CHF heat transfer is initiated subsequently. As mentioned in the last section, for flow convection, the DNB-type boiling crisis, associated with subcooled and low-quality condition, leads to the inverted annular flow in the downstream. While for the dryout-type boiling crisis related to higher quality, the dispersed droplet flow is encountered after the dryout of the liquid film. Since different flow patterns would result in different heat transfer characteristics, in addition, post-DNB and post-dryout (PDO) are termed, and their heat transfer will be discussed, respectively.
Post-DNB Heat Transfer
Concerning post-DNB, the heat transfer in the inverted annular flow regime is of interest. Since the heated wall is covered by continuous vapor blanket and the liquid core is in the tube center with dispersed vapor bubbles, the following three significant heat transfer processes are taken into account:
1) convective heat transfer from the wall to the vapor blanket;
2) radiation heat transfer from the wall to the liquid core; and
3) heat transfer from vapor blanket to the liquid core at the vapor–liquid interface.
Post-Dryout Heat Transfer
As Figure 3B shows, after the disappearance of the annular liquid film, in the post-dryout regime, the saturated droplets disperse in the vapor bulk. Among the droplets, the vapor phase and the heating wall, the main heat transfer mechanisms are as follows:
1) convective heat transfer from the wall to the vapor
2) convective heat transfer from the wall to the droplets
3) heat transfer from the vapor to the droplets at the vapor–liquid interface
4) radiation heat transfer from the wall to vapor
As reviewed by Hammouda (1996), Nakla et al. (2011), Groeneveld (1993), etc., due to the high CHF value, the large temperature rise in the inverted annular regime would lead to the burnout of the heated surface easily. Thereby, it is nearly impossible to perform related heat transfer experiments with a heat-flux controlled water–steam system. The invention of the “hot-patch” technique makes it feasible to obtain inverted annular flow heat transfer measurements. However, as a result of the complicated experiment design, the range of available experiments is very limited so far (Groeneveld, 1993). Hence, research about post-DNB heat transfer in inverted annular flow regime is not as common as PDO. As a result, research in this region has focused more on avoiding the occurrence of boiling crisis. As reviewed by Nakla et al. (2011) and Liu and Sun (2020), the existing measurement with water for inverted annular heat transfer is only up to 9 MPa (reduced pressure at 0.4), from the experiment performed by Stewart and Groeneveld (1982). Even though taking scaling fluids (e.g., R12 and R134a) into consideration, the maximum pressure is 2.39 MPa with R134a (13 MPa for water at the same reduced pressure 0.59) from the experiment carried out by Nakla et al. (2011). Due to shortage of experiments, a prediction approach for the high-pressure post-DNB heat transfer is missing. Thereby, further discussion about post-DNB heat transfer in the high-pressure region could not be carried out. The present work will only focus on the evaluation of post-dryout heat transfer models.
Post-Dryout Heat Transfer Databank for High-Pressure Condition
As summarized in Table 5, an experiment databank of post-CHF heat transfer for high-pressure condition (P/Pc > 0.7) is compiled from the literature (Swenson et al., 1962; Bishop et al., 1964; Herkenrath, 1967; Becker, 1983; Eter et al., 2017). These experiments were carried out in uniformly heated round tubes with water or CO2 as coolant. The water database covers the range of reduced pressure from 0.722 to 0.975 and contains 5,391 data points. For the CO2 database, which is made up of 497 data points, the reduced pressure ranges from 0.88 to 0.95.
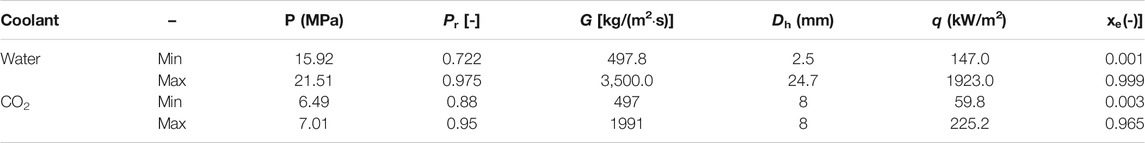
TABLE 5. Parameter ranges of high-pressure post-CHF heat transfer experiments.
Existing Post-Dryout Heat Transfer Model for High-Pressure Condition
Concerning post-dryout heat transfer, some prediction approaches with reduced pressure above 0.7 for water in uniformly heated tubes are collected and summarized in Table 6. These correlations are developed from water experiments carried out in vertical round tubes. The Groeneveld-3 correlation (Groeneveld and Delorme, 1976) developed by Groeneveld and Delorme (1976) includes an extra correlation to calculate the actual quality. The 2003 FB LUT (Groeneveld et al., 2003) is a look-up table giving post-CHF heat transfer coefficient as a function of pressure, mass flux, quality, and wall temperature.

TABLE 6. Prediction models of post-CHF heat transfer for high-pressure condition.
The validity range of these post-dryout heat transfer correlations can be found in Table 7. Some of these correlations are only validated for the high-pressure condition, e.g., the Herkenrath correlation (Herkenrath, 1967) with pressure range from 17 to 21.5 MPa, Bishop-3 correlation (Bishop et al., 1964) with pressure range from 16.8 to 21.9 MPa, and the Swenson correlation (Swenson et al., 1962) only for pressure at 20.68 MPa.
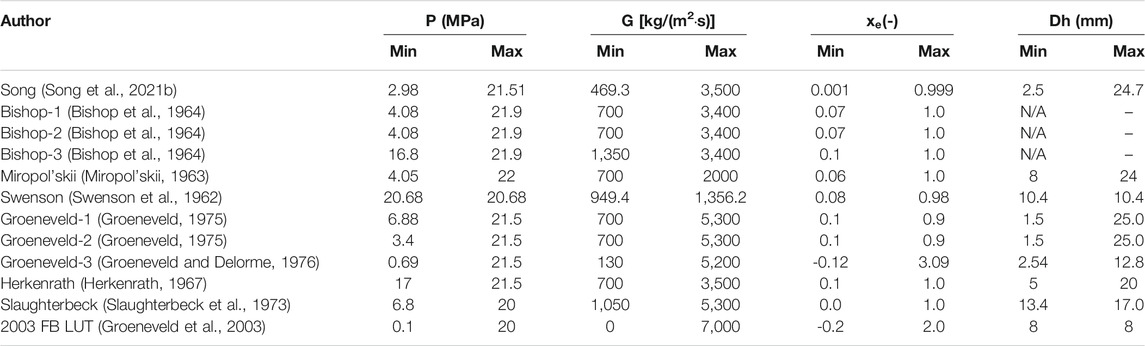
TABLE 7. Validity range of post-CHF heat transfer models.
Assessment of Existing Post-Dryout Heat Transfer Prediction Models
By comparing heat transfer models as shown in Table 6 with the experimental databank listed in Table 5, the error parameter of every data point will be computed by,
Furthermore, the mean error and RMS error of each prediction model could be evaluated with Eqs. 2, 3, respectively.
Accordingly, error information of these post-dryout heat transfer models are exhibited in Table 8. When applied to high-pressure water database, the Song correlation (Song et al., 2021b) obtains mean error of 2.3% and RMS error of 17.6%, respectively. The mean error of Bishop-1 correlation (Bishop et al., 1964) is 1.6%, and the RMS error is 23.8%. Miropol'skii correlation (Miropol'skii, 1963) and Swenson correlation (Swenson et al., 1962) achieve mean error above 40%. Regarding experiments with CO2 as coolant, since Herkenrath correlation (Herkenrath, 1967) and Slaughterbeck correlation (Slaughterbeck et al., 1973) are not dimensionless, and the 2003 FB LUT (Groeneveld et al., 2003) cannot be utilized to nonaqueous fluids without scaling, their error information for CO2 experiments is not displayed in Table 8. Additionally, the mean error and RMS error of Groeneveld-1 correlation (Groeneveld, 1975) is 5.9% and 21.6%, respectively.
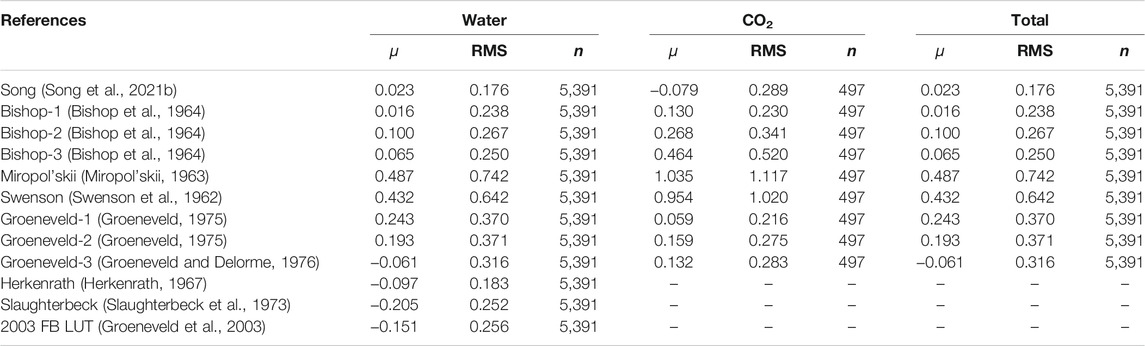
TABLE 8. Predictive capability of post-CHF prediction models.
More details about the distribution of error parameters could be found in Figure 8, which displays prediction results of both water and CO2 experiments together. Generally, extreme prediction deviation is not observed in Song correlation (Song et al., 2021b), Bishop-1 correlation (Bishop et al., 1964), Bishop-2 correlation (Bishop et al., 1964), Bishop-3 correlation (Bishop et al., 1964), and Groeneveld-3 correlation (Groeneveld and Delorme, 1976), of which the error parameters are distributed within −0.5 and 1.0. However, in contrast, for example, the error parameter of the Miropol'skii correlation (Miropol'skii, 1963) could even reach up to nearly 500% at a reduced pressure of approximately 0.95. Besides, the distribution of mean error and RMS error at different pressure ranges is exhibited in Figure 9. It can be seen that mean error and RMS error of the Groeneveld-3 correlation (Groeneveld and Delorme, 1976) become higher while the reduced pressure is above 0.9.
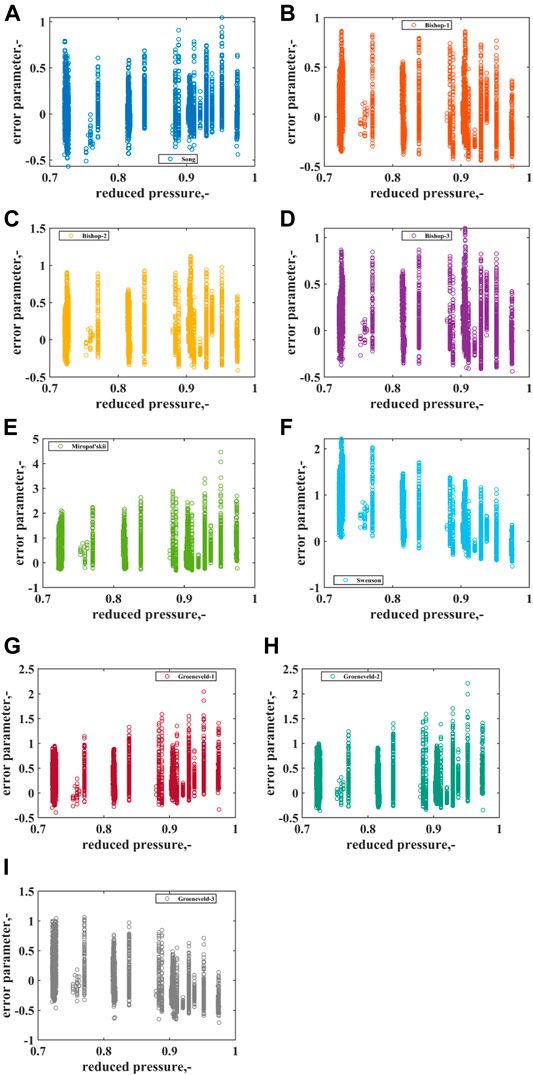
FIGURE 8. Distribution of error parameters versus reduced pressure for different post-dryout correlation. (A) Song correlation (Song et al., 2021b). (B) Bishop-1 correlation (Bishop et al., 1964). (C) Bishop-2 correlation (Bishop et al., 1964). (D) Bishop-3 correlation (Bishop et al., 1964). (E) Miropol'skii correlation (Miropol'skii, 1963). (F) Swenson correlation (Swenson et al., 1962). (G) Groeneveld-1 correlation (Groeneveld, 1975). (H) Groeneveld-2 correlation (Groeneveld, 1975). (I) Groeneveld-3 correlation (Groeneveld and Delorme, 1976).
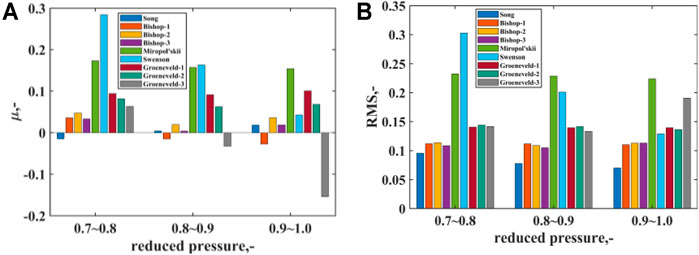
FIGURE 9. Mean error and RMS error at different reduced pressure range. (A) Mean error. (B) RMS error.
Considering the value of mean error and RMS error listed in Table 8 and the distribution of error information shown in Figures 8, 9 together, Song correlation (Song et al., 2021b) and Bishop-1 correlation (Bishop et al., 1964) are the best for the prediction of post-dryout heat transfer in the high-pressure condition. Even when pressure is near to the critical point with reduced pressure at 0.975, both of these two correlations can give good prediction accuracy.
Besides, the error parameter at different mass flux condition is shown in Figure 10. As illustrated, there is no systematic prediction error of Song correlation (Song et al., 2021b). However, the value of error parameter given by Bishop-1 correlation (Bishop et al., 1964) tends to reduce as the mass flux increases. Hence, only Song correlation (Song et al., 2021b) will be recommended for safety analysis.

FIGURE 10. Variation of error parameter with mass flux. (A) Song correlation (Song et al., 2021b). (B) Bishop-1 correlation (Bishop et al., 1964).
Effect of Pressure on PDO Heat Transfer
A comparison of PDO heat transfer under different pressure conditions could be found in Figure 11. The parameters for selected test cases are summarized in Table 9. Figure 11A shows the variation of heat transfer coefficient versus the equilibrium quality, when the pressure increases from 16 to 20 MPa for water experiments. Figure 11B compares the PDO heat transfer for uniformly heated round tubes with CO2 at pressure of 6.49 and 7.0 MPa, respectively. Moreover, the prediction results with Song correlation (Song et al., 2021b) for each test case are plotted in Figure 11 as well. In general, the predicted heat transfer coefficient gets a good agreement with the experiment.
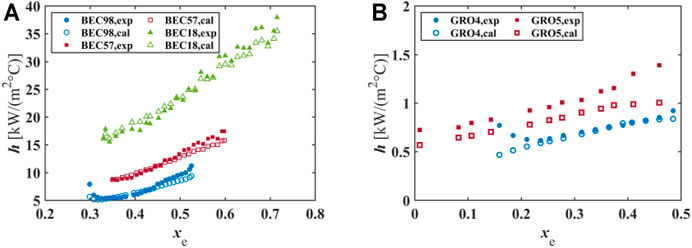
FIGURE 11. Effect of pressure on PDO heat transfer. (A) Water experiments: G = 2000 kg/(m2·s) , q = 600 kW/m2. (B) CO2 experiment: G = 703 kg/(m2 s) , q = 79.9 kW/m2
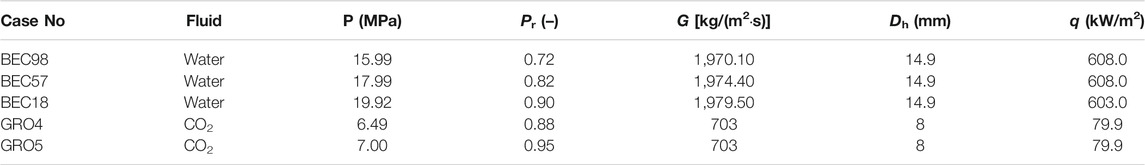
TABLE 9. Test cases for PDO heat transfer under different pressure.
As observed, PDO heat transfer coefficient increases with increasing pressure. As the pressure increases, according to the research of Kataoka et al. (1983), the droplet diameter will be smaller with a lower surface tension; therefore, the number of droplets will increase, and the total interfacial area will be larger at the same equilibrium quality. It facilitates the interfacial heat transfer from the vapor phase to liquid droplets. In consequence, a better total heat transfer could be obtained at a higher pressure.
Summary
Supercritical power cycles may experience subcritical condition during some trans-critical transients. However, it is found that research about heat transfer in the high-pressure subcritical condition is still rare so far. Thereby, two significant heat transfer phenomena, i.e., boiling crisis and post-CHF heat transfer, are discussed in the present work. Existing prediction approaches of CHF and post-dryout heat transfer for high-pressure condition are collected and evaluated. In the present work, prediction models of CHF and post-dryout heat transfer at the high-pressure condition are recommended for safety analysis.
Main achievements can be summarized as follows:
About CHF:
1) A databank of high-pressure CHF experiment with water, R12, CO2, or helium as coolant are established containing 2,695 data points in total.
2) Thirteen prediction models for high-pressure condition are collected and assessed by comparing with the high-pressure CHF experimental databank. It is demonstrated that the CHF correlation developed by Song et al. (2021a) gives good prediction accuracy to different fluids at the high-pressure condition.
3) The value of CHF decreases as the pressure rises, which implies that boiling crisis occurs easier at a higher pressure.
About post-dryout heat transfer:
1) A post-dryout heat transfer experimental databank for high-pressure condition is compiled, including tests for water and CO2 experiments and 5,888 data points.
2) By comparing prediction of 12 post-CHF heat transfer models with the high-pressure post-dryout heat transfer experimental databank, it can be concluded that Song correlation (Song et al., 2021b) obtains the best predictive capability.
3) With the increase in pressure, post-dryout heat transfer becomes better.
Data Availability Statement
The original contributions presented in the study are included in the article/supplementary material. Further inquiries can be directed to the corresponding author.
Author Contributions
MS: Simulation, Original draft; XL: Conceptualization, supervision.
Conflict of Interest
The authors declare that the research was conducted in the absence of any commercial or financial relationships that could be construed as a potential conflict of interest.
Publisher’s Note
All claims expressed in this article are solely those of the authors and do not necessarily represent those of their affiliated organizations, or those of the publisher, the editors and the reviewers. Any product that may be evaluated in this article, or claim that may be made by its manufacturer, is not guaranteed or endorsed by the publisher.
Acknowledgments
The authors would like to thank the German Federal Ministry for Economic Affairs and Energy (BMWi, MOPOW II Project, No. 1501544) for providing the financial support for this study.
References
Ahn, Y., Bae, S. J., Kim, M., Cho, S. K., Baik, S., Lee, J. I., et al. (2015). Review of Supercritical CO2 Power Cycle Technology and Current Status of Research and Development. Nucl. Eng. Tech. 47 (6), 647–661. doi:10.1016/j.net.2015.06.009
Becker, K. M. (1983). An Experimental Investigation of post Dryout Heat Transfer. Stocholm, Sweden: KTH-NEL-33, Department of nuclear reactor engineering, Royal Institute of Technology.
Becker, K. M., Djursing, D., Lindberg, K., Eklind, O., and Österdahl, C. (1972). “Burnout Conditions for Round Tubes at Elevated Pressures,” in Proceedings of the International Symposium on Two-phase Systems. Editors G. Hetsroni, S. Sideman, and J. P. Hartnett (Pergamon), 55–73. doi:10.1016/b978-0-08-017035-0.50009-4
Binotti, M., Astolfi, M., Campanari, S., Manzolini, G., and Silva, P. (2017). Preliminary Assessment of sCO2 Cycles for Power Generation in CSP Solar tower Plants. Appl. Energ. 204, 1007–1017. doi:10.1016/j.apenergy.2017.05.121
Bishop, A. A., Sandberg, R. O., and Tong, L. S. (1964). Forced-convection Heat Transfer to Water at Near-Critical Temperatures and Supercritical pressuresWCAP-5449. United States: Westinghouse Electric Corporation.
Celata, G. P., Cumo, M., Mariani, A., Simoncini, M., and Zummo, G. (1994). Rationalization of Existing Mechanistic Models for the Prediction of Water Subcooled Flow Boiling Critical Heat Flux. Int. J. Heat Mass Transfer 37, 347–360. doi:10.1016/0017-9310(94)90035-3
Chen, Y., Zhao, M., Bi, K., Yang, B., Zhang, D., and Du, K. (2017). Critical Heat Flux of Flowing Water in Tube for Pressure up to Near Critical Point—Experiment and Prediction. J. Nucl. Eng. Radiat. Sci. 4 (1), 011006. doi:10.1115/1.4038215
Cheng, X., Yang, Y. H., and Liu, X. J. (2016). Super-critical Water Cooled Reactor with Mixed Spectrum: Design and Key Technologies. Shanghai: Shanghai Jiao Tong University Press.
Chernobai, V. (1980). Model for Heat-Transfer Crisis for Water Bolling in Pipes. Teplofizika vysokikh temperatur 18 (5), 1046–1050.
Crespi, F., Gavagnin, G., Sánchez, D., and Martínez, G. S. (2017). Supercritical Carbon Dioxide Cycles for Power Generation: A Review. Appl. Energ. 195, 152–183. doi:10.1016/j.apenergy.2017.02.048
Debenedetti, P. G. (1994). “Supercritical Fluids: Fundamentals and Applications,” in Developments in Food Engineering: Proceedings of the 6th International Congress on Engineering and Food. Editors T. Yano, R. Matsuno, and K. Nakamura (Boston, MA: Springer US), 30–35. doi:10.1007/978-1-4615-2674-2_6
Dostal, V., Driscoll, M. J., Hejzlar, P., and Todreas, N. E. (2002). “A Supercritical CO2 Gas Turbine Power Cycle for Next-Generation Nuclear Reactors,” in 10th International Conference on Nuclear Engineering, Arlington, Virginia, USA, April 14–18, 2002 (ASME), 567–574.
Eggers, R. (2012). Industrial High Pressure Applications: Processes, Equipment, and Safety. John Wiley & Sons.
Eter, A., Groeneveld, D., and Tavoularis, S. (2017). Convective Heat Transfer at High Subcritical Pressures in Tubes with and without Flow Obstacles. Nucl. Eng. Des. 318, 1–23. doi:10.1016/j.nucengdes.2017.04.013
Frank, E. D., Sullivan, J. L., and Wang, M. Q. (2012). Life Cycle Analysis of Geothermal Power Generation with Supercritical Carbon Dioxide. Environ. Res. Lett. 7 (3), 034030. doi:10.1088/1748-9326/7/3/034030
Groeneveld, D. C. (1993). A Review of Inverted Annular and Low Quality Film Boiling. Multiphase Sci. Tech. 7 (1-4), 327–365. doi:10.1615/multscientechn.v7.i1-4.60
Groeneveld, D. C., and Delorme, G. G. J. (1976). Prediction of thermal Non-equilibrium in the post-dryout Regime. Nucl. Eng. Des. 36 (1), 17–26. doi:10.1016/0029-5493(76)90138-2
Groeneveld, D. C., Leung, L. K. H., Vasic’, A. Z., Guo, Y. J., and Cheng, S. C. (2003). A Look-Up Table for Fully Developed Film-Boiling Heat Transfer. Nucl. Eng. Des. 225 (1), 83–97. doi:10.1016/s0029-5493(03)00149-3
Groeneveld, D. C. (1975). Post-dryout Heat Transfer: Physical Mechanisms and a Survey of Prediction Methods. Nucl. Eng. Des. 32 (3), 283–294. doi:10.1016/0029-5493(75)90099-0
Groeneveld, D., Shan, J., and Vasić, A. (2007). The 2006 CHF Look-Up Table. Nucl. Eng. Des. 237 (15-17), 1909–1922. doi:10.1016/j.nucengdes.2007.02.014
Hall, D. D., and Mudawar, I. (2000). Critical Heat Flux (CHF) for Water Flow in Tubes-II. Int. J. Heat Mass Transfer 43 (14), 2605–2640. doi:10.1016/s0017-9310(99)00192-1
Hammouda, N. (1996). Subcooled film boiling in non-aqueous fluids. Dissertation, Ottawa-Carleton Institute for Mechanical and Aeronautical Engineering, University of Ottawa.
Hejzlar, P., Dostal, V., and Driscoll, M. J. (2006). Assessment of Gas Cooled Fast Reactor with Indirect Supercritical CO2 Cycle. Nucl. Eng. Tech. 38 (2), 109–118.
Herkenrath, H. (1967). Heat Transfer in Water with Forced Circulation in the 140 to 250 Bar Pressure Range: Results of Investigations. German: No. EUR-3658, Europ. Atomgemeinschaft-Euroatom.
IAEA (2001). Thermohydraulic Relationships for Advanced Water Cooled Reactors. Vienna, Austria: IAEA-TECDOC-1203, International Atomic Energy Agency.
IATF (2019). Unpublished CHF data bank in Institute of Angewandte Thermofluidik (IATF). Karlsruhe, Germany: Institut für Angewandte Thermofluidik (IATF), KIT.
Kariya, K., Yoshizumi, K., and Mori, H., (2013). “Correlation for Critical Heat Flux at Near-Critical Pressure in Tubes,” in The 6th International Symposium on Supercritical Water-Cooled Reactors. Shenzhen, Guangdong, China, March 03-07, 2013, 1–12.
Kataoka, I., Ishii, M., and Mishima, K. (1983). Generation and Size Distribution of Droplet in Annular Two-phase Flow. J. Fluids Eng. 105 (2), 230–238. doi:10.1115/1.3240969
Katto, Y. (1990). A Physical Approach to Critical Heat Flux of Subcooled Flow Boiling in Round Tubes. Int. J. Heat Mass Transfer 33 (4), 611–620. doi:10.1016/0017-9310(90)90160-v
Katto, Y. (1992). A Prediction Model of Subcooled Water Flow Boiling CHF for Pressure in the Range 0.1-20 MPa. Int. J. Heat Mass Transfer 35 (5), 1115–1123. doi:10.1016/0017-9310(92)90172-o
Katto, Y., and Yokoya, S. (1984). Critical Heat Flux of Liquid Helium (I) in Forced Convective Boiling. Int. J. Multiphase Flow 10 (4), 401–413. doi:10.1016/0301-9322(84)90052-1
Lee, C. H., and Mudawwar, I. (1988). A Mechanistic Critical Heat Flux Model for Subcooled Flow Boiling Based on Local Bulk Flow Conditions. Int. J. Multiphase Flow 14 (6), 711–728. doi:10.1016/0301-9322(88)90070-5
Lemmon, E. W., Huber, M. L., and McLinden, M. O. (2007). NIST Standard Reference Database 23: Reference Fluid Thermodynamic and Transport Properties-REFPROP, Version 8.0: Standard Reference Data Program.
Levitan, L., and Lantsman, F. (1975). Investigating Burnout with Flow of a Steam-Wwater Mixture in a Round Tube. Therm. Eng. (Ussr) (Engl. Transl.) 22 (1), 102–105.
Li, M.-J., Zhu, H.-H., Guo, J.-Q., Wang, K., and Tao, W.-Q. (2017). The Development Technology and Applications of Supercritical CO2 Power Cycle in Nuclear Energy, Solar Energy and Other Energy Industries. Appl. Therm. Eng. 126, 255–275. doi:10.1016/j.applthermaleng.2017.07.173
Linares, J. I., Herranz, L. E., Fernández, I., Cantizano, A., and Moratilla, B. Y. (2015). Supercritical CO2 Brayton Power Cycles for DEMO Fusion Reactor Based on Helium Cooled Lithium Lead Blanket. Appl. Therm. Eng. 76, 123–133. doi:10.1016/j.applthermaleng.2014.10.093
Liu, Q., and Sun, X. (2020). Wall Heat Transfer in the Inverted Annular Film Boiling Regime. Nucl. Eng. Des. 363, 110660. doi:10.1016/j.nucengdes.2020.110660
Liu, W., Nariai, H., and Inasaka, F. (2000). Prediction of Critical Heat Flux for Subcooled Flow Boiling. Int. J. Heat Mass Transfer 43 (18), 3371–3390. doi:10.1016/s0017-9310(99)00373-7
Liu, X. J., Sun, C., Wang, Z. D., Chai, X., Xiong, J. B., Yang, Y. H., et al. (2016). Preliminary Study to Improve the Performance of SCWR-M during Loss-Of-Flow Accident. Nucl. Eng. Des. 307, 431–444. doi:10.1016/j.nucengdes.2016.07.030
Lombardi, C. (1995). “A Formal Approach for the Prediction of the Critical Heat Flux in Subcooled Water,” in 7th international topical meeting on nuclear reactor thermal-hydraulics, Saratoga Springs, NY (United States), September, 10-15, 1995.
Marion, J., Kutin, M., McClung, A., Mortzheim, J., and Ames, R. (2019). “The STEP 10 MWe sCO2 Pilot Plant Demonstration,” in Turbo Expo: Power for Land, Sea, and Air, Phoenix, Arizona, USA, June 17–21, 2019 (American Society of Mechanical Engineers (ASME)).
Miropol'skii, Z. L. (1963). Heat Transfer in Film Boiling of a Steam-Water Mixture in Steam-Generator Tubes. Teplonergetika 10, 49–52.
Miropol'skii, Z. L., and Shitsman, M. E. (1962). The Critical Heat Flux for Boiling Water in Tubes. Soviet J. At. Energ. 11 (6), 1166–1173. doi:10.1007/bf01591377
Mohammed Shah, M. (1987). Improved General Correlation for Critical Heat Flux during Upflow in Uniformly Heated Vertical Tubes. Int. J. Heat Fluid Flow 8 (4), 326–335. doi:10.1016/0142-727x(87)90069-5
Musgrove, G., and Wright, S. (2017). “Introduction and Background,” in Fundamentals and Applications of Supercritical Carbon Dioxide (sCO₂) Based Power Cycles. Editors K. Brun, P. Friedman, and R. Dennis (Cambridgeshire, England: Woodhead Publishing), 1–22. doi:10.1016/b978-0-08-100804-1.00001-3
Nakla, M. E., Groeneveld, D. C., and Cheng, S. C. (2011). Experimental Study of Inverted Annular Film Boiling in a Vertical Tube Cooled by R-134a. Int. J. Multiphase Flow 37 (1), 67–75. doi:10.1016/j.ijmultiphaseflow.2010.08.006
Oka, Y., Koshizuka, S., Ishiwatari, Y., and Yamaji, A. (2010). Super Light Water Reactors and Super Fast Reactors: Supercritical-Pressure Light Water Cooled Reactors. Springer Science & Business Media.
Osorio, J. D., Hovsapian, R., and Ordonez, J. C. (2016). Effect of Multi-Tank thermal Energy Storage, Recuperator Effectiveness, and Solar Receiver Conductance on the Performance of a Concentrated Solar Supercritical CO2-based Power Plant Operating under Different Seasonal Conditions. Energy 115, 353–368. doi:10.1016/j.energy.2016.08.074
Pioro, I. L., Duffey, R. B., Kirillov, P. L., and Panchal, R. (2016). “Introduction: A survey of the status of electricity generation in the world,” in Handbook of Generation IV Nuclear Reactors. Editor I. L. Pioro (Cambridge, UK: Woodhead Publishing), 1–34. doi:10.1016/b978-0-08-100149-3.00001-x
Pioro, I. L. (2016). “Introduction,” in Handbook of Generation IV Nuclear Reactors. Editor I. L. Pioro (Cambridge, UK: Woodhead Publishing), 37–54. doi:10.1016/b978-0-08-100149-3.00002-1
Poerner, M., and Rimpel, A. (2017). “Waste Heat Recovery,” in Fundamentals and Applications of Supercritical Carbon Dioxide (sCO₂) Based Power Cycles. Editors K. Brun, P. Friedman, and R. Dennis (Cambridge, UK: Woodhead Publishing), 255–267. doi:10.1016/b978-0-08-100804-1.00010-4
Qi, H., Gui, N., Yang, X., Tu, J., and Jiang, S. (2018). The Application of Supercritical CO2 in Nuclear Engineering: A Review. The J. Comput. Multiphase Flows 10 (4), 149–158. doi:10.1177/1757482x18765377
Sarkar, J. (2015). Review and Future Trends of Supercritical CO2 Rankine Cycle for Low-Grade Heat Conversion. Renew. Sust. Energ. Rev. 48, 434–451. doi:10.1016/j.rser.2015.04.039
Schulenberg, T., and Leung, L. (2016). “Super-critical Water-Cooled Reactors,” in Handbook of Generation IV Nuclear Reactors. Editor I. L. Pioro (Schulenberg: Woodhead Publishing), 189–220. doi:10.1016/b978-0-08-100149-3.00008-2
Sienicki, J. J., Moisseytsev, A., and Krajtl, L. (2014). “Utilization of the Supercritical CO2 Brayton Cycle with Sodium-Cooled Fast Reactors,” in The 4th Internation Symposium-Supercritical CO2 Power Cycles, Pittsburgh, Pennsylvania, USA, September 9-10, 2014 (Pittsburgh, Pennsylvania: Citeseer), 9–10.
Slaughterbeck, D., Ybarrondo, L., and Obenchain, C. (1973). Flow Film Boiling Heat Transfer Correlations: A Parametric Study with Data comparisonsCONF-730803-5. Idaho Falls, Idaho (USA): Aerojet Nuclear Co.
Song, M., Liu, X., and Cheng, X. (2021). Prediction of Critical Heat Flux (CHF) for the High-Pressure Region in Uniformly Heated Vertical Round Tubes. Ann. Nucl. Energ. 158, 108303. doi:10.1016/j.anucene.2021.108303
Song, M. Q., Liu, X. J., and Cheng, X. (2021). A New Correlation of post-dryout Heat Transfer for Upward Vertical Flow in Round Tubes. Under review.
Stewart, J. C., and Groeneveld, D. C. (1982). Low-quality and Subcooled Film Boiling of Water at Elevated Pressures. Nucl. Eng. Des. 67 (2), 259–272. doi:10.1016/0029-5493(82)90145-5
Swenson, H. S., Carver, J. R., and Szoeke, G. (1962). The Effects of Nucleate Boiling versus Film Boiling on Heat Transfer in Power Boiler Tubes. J. Eng. Power 84 (4), 365–371. doi:10.1115/1.3675052
Syblik, J., Vesely, L., Entler, S., Stepanek, J., and Dostal, V. (2019). Analysis of Supercritical CO2 Brayton Power Cycles in Nuclear and Fusion Energy. Fusion Eng. Des. 146, 1520–1523. doi:10.1016/j.fusengdes.2019.02.119
Tong, L. S. (1967). Prediction of Departure from Nucleate Boiling for an Axially Non-uniform Heat Flux Distribution. J. Nucl. Energ. 21 (3), 241–248. doi:10.1016/s0022-3107(67)90054-8
Tong, L. S., and Tang, Y. S. (2018). Boiling Heat Transfer and Two-phase Flow. 2 ed. Oxfordshire, England: Routledge.
U.S. DOE Nuclear Energy Research Advisory Committee, Generation IV International Forum (2002). A Technology Roadmap for Generation IV Nuclear Energy Systems. GIF-002-00. U.S. DOE Nuclear Energy Research Advisory Committee and the Generation IV International Forum.
Vesely, L., Dostal, V., and Entler, S. (2017). Study of the Cooling Systems with S-CO 2 for the DEMO Fusion Power Reactor. Fusion Eng. Des. 124, 244–247. doi:10.1016/j.fusengdes.2017.05.029
Vijayarangan, B. R., Jayanti, S., and Balakrishnan, A. R. (2006). Studies on Critical Heat Flux in Flow Boiling at Near Critical Pressures. Int. J. Heat Mass Transfer 49 (1), 259–268. doi:10.1016/j.ijheatmasstransfer.2005.06.029
Wang, X., Levy, E. K., Pan, C., Romero, C. E., Banerjee, A., Rubio-Maya, C., et al. (2019). Working Fluid Selection for Organic Rankine Cycle Power Generation Using Hot Produced Supercritical CO2 from a Geothermal Reservoir. Appl. Therm. Eng. 149, 1287–1304. doi:10.1016/j.applthermaleng.2018.12.112
Yin, J. M., Zheng, Q. Y., Peng, Z. R., and Zhang, X. R. (2020). Review of Supercritical CO 2 Power Cycles Integrated with CSP. Int. J. Energ. Res 44 (3), 1337–1369. doi:10.1002/er.4909
Nomenclature
General
G mass flux, kg/(m2·s)
h heat transfer coefficient, W/(m2·°C)
HVL evaporation heat, J/kg
L length, m
ME mean value
N number of data point
Nu Nusselt number
P pressure, Pa
Pr reduced pressure
Pr Prandtl number
q heat flux, W/m2
qc critical heat flux, W/m2
Re Reynolds number
RMS root-mean-square value
T temperature, °C
xm mass quality (0 ≤ xm ≤ 1)
xa Actual quality
xe equilibrium quality
z elevation, m
Greek
λ thermal conductivity, W/(m·°C)
μ dynamic viscosity, Pa·s; or mean error
Subscripts
c critical
L liquid phase
V vapor phase
f flim
w wall
s saturated
Abbreviations
BWR boiling water reactor
DNB departure from nucleate boiling
DO dryout
GFR gas cooled fast reactor
GIF generation IV international forum
IATF institute for applied thermofluidics
LOCA loss-of-coolant accident
LUT look-up table
PWR pressurized water reactor
sCO2 supercritical carbon dioxide
SCW supercritical water
SCWR supercritical water-cooled reactor
SCF supercritical fluid
SFR sodium-cooled fast reactor
Keywords: trans-critical transient, high-pressure condition, CHF, post-CHF heat transfer, SCWR
Citation: Song M and Liu X (2021) Assessment of CHF and Post-CHF Heat Transfer Models for High-Pressure Condition. Front. Energy Res. 9:782086. doi: 10.3389/fenrg.2021.782086
Received: 23 September 2021; Accepted: 01 November 2021;
Published: 03 December 2021.
Edited by:
Luteng Zhang, Chongqing University, ChinaReviewed by:
Yuan Yuan, Sichuan University, ChinaHaochun Zhang, Harbin Institute of Technology, China
Copyright © 2021 Song and Liu. This is an open-access article distributed under the terms of the Creative Commons Attribution License (CC BY). The use, distribution or reproduction in other forums is permitted, provided the original author(s) and the copyright owner(s) are credited and that the original publication in this journal is cited, in accordance with accepted academic practice. No use, distribution or reproduction is permitted which does not comply with these terms.
*Correspondence: Xiaojing Liu, eGlhb2ppbmdsaXVAc2p0dS5lZHUuY24=