 Bin Zhang
 Xingjie Peng
 Chen Zhao
 Wenbo Zhao
 Qing Li
94% of researchers rate our articles as excellent or good
Learn more about the work of our research integrity team to safeguard the quality of each article we publish.
Find out more
ORIGINAL RESEARCH article
Front. Energy Res., 24 January 2022
Sec. Nuclear Energy
Volume 9 - 2021 | https://doi.org/10.3389/fenrg.2021.779243
This article is part of the Research TopicReactor Physics: Methods and ApplicationsView all 27 articles
This article presents the verification and validation (V and V) of PWR neutronics code package TORCH V2.0 with nuclear power plant (NPP) measurements. The advanced nuclear power engineering design software, TORCH V2.0, was developed by the Nuclear Power Institute of China (NPIC), China National Nuclear Corporation (CNNC). Based on the two-step calculation scheme, TORCH V2.0 mainly contains lattice physics code for assembly homogenization, link calculation code for few-group constant parameterization, and core simulation code for few-group core calculation. The calculation modules of each code were already verified against various benchmark problems, whereas this article focuses on the V and V of linked code system. The measured values of the reactor startup physics test and NPP operation from six PWR NPPs (Daya Bay NPP, Ling Ao NPP, Fangjiashan NPP, Qinshan NPP, Hainan Changjiang NPP, and Fuqing NPP) were utilized to perform the comparison and analysis of V and V. Compared parameters of the reactor startup physics test include critical boron concentration, control rod integral value, boron differential value, and isothermal temperature coefficient. Compared parameters of the NPP operation contain critical boron concentration, assembly-wise power distribution, hot spot factor, and nuclear enthalpy rise factor. The results show that the software TORCH V2.0 has reliable calculation ability and can be applied in the PWR nuclear power engineering design which is based on square fuel assembly.
A conventional two-step approach of a transport calculation and a nodal diffusion calculation, such as CASMO/SIMULATE, PARAGON (or PHOENIX)/ANC, and APOLLO/SMART (Liu and Meliksetian, 1986; Studsvik of American, 1994; Studsvik of American, 1995; Westinghouse Electric Company, 2005; Adrien, 2014; Vidal et al., 2014; Zhang et al., 2018), has been used in the light water reactor core design for decades. These conventional code systems have been in use for commercial PWR core designs for a long time, and they have been upgraded continuously based on numerous core calculations. However, the conventional code systems usually adopt methodologies developed in the past. A PWR core design software package named TORCH V2.0 has been developed by the Nuclear Power Institute of China (NPIC), CNNC. Many advanced methodologies (Zhang et al., 2019) have been implemented in TORCH V2.0 to enhance the accuracy and performance. TORCH V2.0 has been developed to be a multi-scale, multi-physics analysis code system; thus, it can be a platform in terms of a neutronics code for coupling with thermal/hydraulic code and fuel performance code. TORCH V2.0 is a property code which is mainly used for the PWR nuclear power engineering design with square fuel assembly, and it is developed along with China’s third-generation nuclear power HPR1000.
The results show that the software TORCH V2.0 has reliable calculation ability and can be applied in the PWR nuclear power engineering design which is based on square fuel assembly.
TORCH V2.0 is a PWR core design software package, which mainly includes a lattice physics code named KYLIN V2.0 (Tu et al., 2016; Chai et al., 2017), linking a calculation code named PACFAC and a few-group core simulation code named CORCA-3D (An et al., 2019). KYLIN V2.0 has powerful geometric processing ability, which can perform one-step two-dimensional neutron transport calculation and analysis on various fuel assemblies with complex structures in advanced nuclear reactors, and is mainly used to provide the few-group assembly-homogenized parameters for the three-dimensional core computing software CORCA-3D. PACFAC is a linking code which uses the interpolation/fitting method to parameterize the few-group assembly-homogenized parameters generated by KYLIN V2.0 and provides the polynomial parameters to CORCA-3D to calculate the few-group constants which can be determined by the core state. CORCA-3D software adopts an advanced nodal method to solve the few-group diffusion equation and can perform core depletion calculation, power reconstruction, and physical and thermal coupling calculations.
The reactor cores of six PWR nuclear power plants (Daya Bay NPP, Ling Ao NPP, Fangjiashan NPP, Qinshan NPP, Hainan Changjiang NPP, and Fuqing NPP) have been 85 cycles for 14 NPP units reactor startup physics tests and a total of were simulated by TORCH V2.0. Compared parameters of the reactor startup physics test include critical boron concentration, control rod integral value, boron differential value, and isothermal temperature coefficient. Compared parameters of the nuclear power plant (NPP) operation include critical boron concentration, assembly-wise power distribution, hot spot factor, and nuclear enthalpy rise factor.
TORCH V2.0 adopts a two-step approach to simulate PWR cores. The one-step direct heterogenous calculation code KYLIN V2.0 based on a fine-group structure is used. KYLIN V2.0 is used to generate homogenized parameters, including homogenized cross-section, diffusion coefficients, and discontinuity factors. Considering the fact that a certain state required by the reactor core calculation may be different from the ones provided by KYLIN V2.0, a process is required to provide a table between those neutronics few-group constants and state parameters based on the discrete points provided by lattice calculations. The code named PACFAC is used to provide the table for the core simulator CORCA-3D. The neutron diffusion equation would be calculated for core fuel management in CORCA-3D.
The flow chart of the lattice physics code KYLIN V2.0 is shown in Figure 1; the program is mainly used for neutron simulation calculation and analysis of two-dimensional problems and provides assembly-homogenized parameters for three-dimensional core simulation software. The KYLIN V2.0 program can select the 45-/190-group structure of multi-group cross-section libraries for calculation. It adopts an advanced subgroup method (Nikilaev et al., 1970; Hebert, 2004) to solve the effective resonance cross-section of resonance nuclides, adopts an MOC method (Hong and Cho, 1998; Kosaka and Takeda, 2004) to calculate the neutron transport of complex structure geometry, and adopts a generalized coarse mesh finite difference (GCMFD) acceleration method to accelerate neutron transport calculation. The depletion calculation is carried out based on the improved predictive-corrected critical-fuel consumption iterative method (Yamamoto et al., 2009), and the burnup equation is solved by the Chebyshev method. At the same time, for the convenience of users, the program also has a graphical modeling tool for components with complex structure geometry and a post-processing display tool.
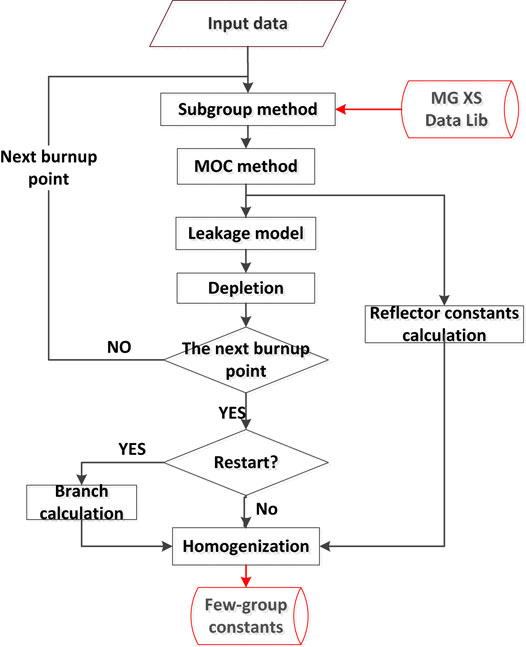
FIGURE 1. Main calculation flow chart of the KYLIN V2.0 program.
Specifically, KYLIN V2.0 software mainly has the following characteristics:
1) It can accurately describe geometric shape, mesh division, material distribution of various grids, or components with different geometric structures (including the bar bundle type and plate type) and provide users with clear and convenient input methods.
2) It can accurately read the input parameters necessary for grid (component) calculation, including multi-group constant library, temperature of each region, and resonance effective temperature of important nuclides.
3) It can accurately deal with complex geometric resonance problems and can also consider the influence of fuel core temperature, multi-resonance nuclide interference, and other influence factors.
4) The fine energy spectrum and homogenized cross-section parameters of various types of grids (assemblies) can be solved by using a fine energy group structure.
5) It can deal with heavy nuclear burnup chains, such as uranium series, plutonium series, and fine fission product chains, and can carry out burnup calculation of important combustible poisons (such as boron and gadolinium).
6) One-step two-dimensional heterogenous multi-assembly calculations can be performed, and restart calculations such as continuous calculation and variable working conditions can be performed.
7) It can output main calculation results, such as infinite multiplication coefficient, relative power distribution, and nuclear density of important nuclides.
The PACFAC code adopts the interpolation/fitting method to parameterize the few-group assembly-homogenized parameters generated by KYLIN V2.0 and provides the polynomial parameters to CORCA-3D to calculate the few-group constants which can be determined by the core state (Li et al., 2016). The main functions of PACFAC contain the few-group constant parameterization model of few-group constants and the inverse calculation model of cross-section parameters. The former provides the polynomial parameters of the interpolation/fitting relationship between the few-group constants (few-group cross-section, shape factor, and so on) and core state parameters. The inverse calculation model is mainly used to determine the few-group constants in the core simulator, which is closely related to polynomial parameters in the interpolation/fitting relation. The parameterization formulation of PACFA is shown in the following equation:
Here,
The main calculation flow chart of CORCA-3D is shown in Figure 2, which is mainly used for the simulation of three-dimensional steady-state core, and is one of the most important calculation software for core fuel management. CORCA-3D can carry out the diffusion calculation based on the few-group constants calculated via the homogenized cross-section parameter library, the burnup calculation of important actinides, fission products, and combustible poisons. CORCA-3D can perform thermal-hydraulic feedback calculation, pin-power reconstruction calculation, and is able to calculate the equilibrium concentration of iodine and xenon. CORCA-3D can read multiple-cycle databases for refueling core modeling calculation. At the same time, it has the basic functions of core design, such as coefficient calculation, variable parameter calculation, boron concentration/control rod position critical search calculation, and control rod differential/integral value calculation.
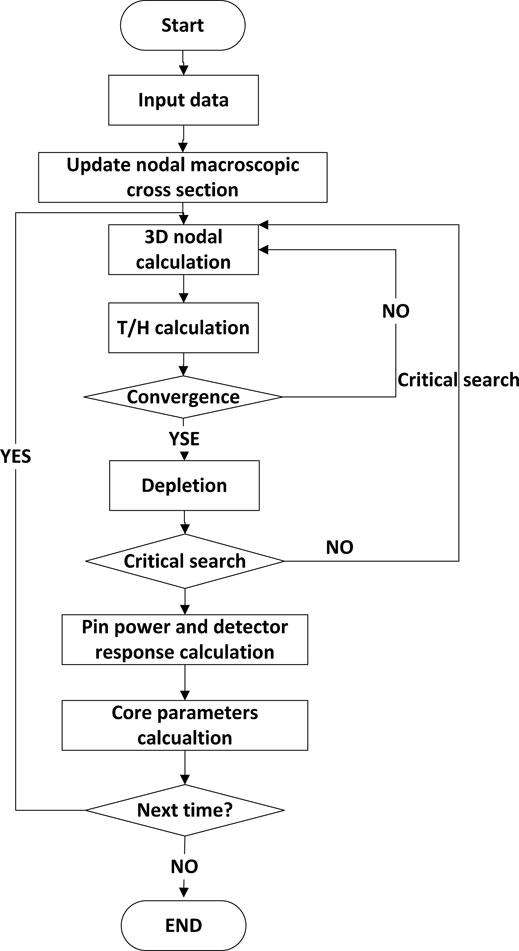
FIGURE 2. Main calculation flow chart of the CORCA-3D code.
The CORCA-3D code mainly has the following characteristics:
1) According to the current core information and historical information of the component (including burnup depth, boron concentration, effective fuel temperature, moderator density, xenon concentration, and control rod status), the few-group cross-section parameters of each segment in the core can be calculated from the multi-parameter cross-section library provided by the linking code PACFAC.
2) It can quickly and accurately solve the diffusion equation of few groups (two groups and four groups) in the core.
3) The power reconstruction calculation of rectangular geometry can be carried out, and the pin-power distribution and the detector response can be obtained.
4) It can solve the single-channel thermal hydraulic equation of the reactor core and calculate the enthalpy field distribution of the coolant in the reactor;
5) It can accurately solve the burnup equation of important nuclides in the reactor core and calculate the accumulation and consumption process of important nuclides (such as actinides and combustible poisons) in the reactor.
6) It can calculate the equilibrium concentration of xenon.
7) It is can search boron concentration or rod position of the control rod group to make the core eigenvalue reach the target value;
8) Parameters such as boron concentration, relative power, and control rod position can be changed at any burning time for calculation.
The reactor cores of six PWR NPPs are simulated. The analyzed NPPs shown in Table 1 are Daya Bay NPP (DYBU1C9-WRS-410100-BG1 Rev. 0, 2010), Ling Ao NPP (LAU1C5-WRS-410100-BG1 Rev. 0, 2009), Fangjiashan NPP (FJSU1C1-WRS-410100-BG1 Rev. 0, 2016), Qinshan NPP (QSU1C1-WRS-410100-BG1 Rev. 0, 2005), Hainan Changjiang NPP (CJU1C1-WRS-410100-BG1 Rev. 0, 2016), and Fuqing NPP (FQU1C1-WRS-410100-BG1 Rev. 0, 2016). Part of reactor startup physics tests and a total of 85 cycles of 14 NPP units were simulated by TORCH V2.0. However, the content of the reactor startup physics tests varies in different cycles.
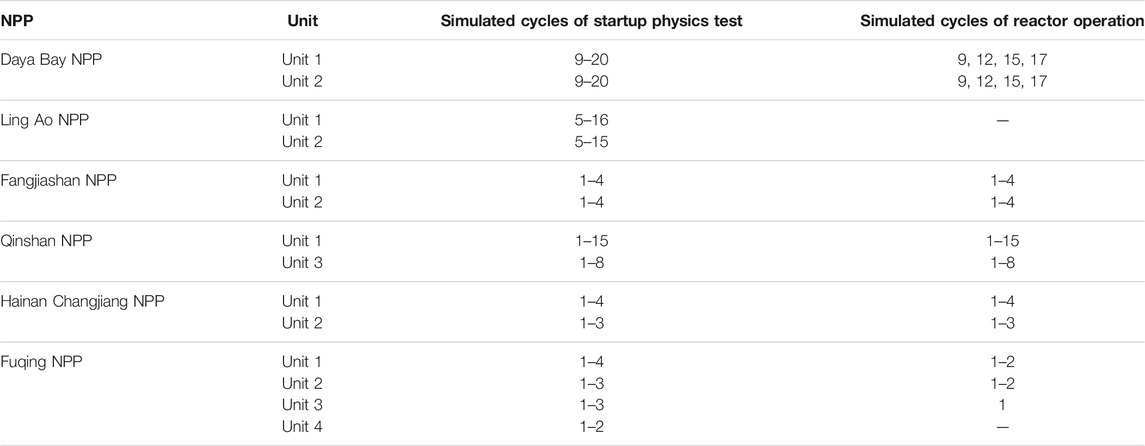
TABLE 1. The details information of simulated six PWR NPPs.
Compared parameters of the reactor startup physics test include critical boron concentration (CBC), control rod integral value, boron differential value, and isothermal temperature coefficient.
The results of critical boron concentration are shown in Figure 3. The absolute errors of the critical boron concentration in the all-rod-out (ARO) state are within ±50 ppm and those of the rod-inserted state agreed with the rod-inserted criterion. The formula of the rod-inserted criterion is as follows:
where M means the measured value, P means the predicted value, R0/R means the initial/final rod position at the time of measurement, and f is the value of the uncertainty of the measurement, including chemical analysis uncertainty.
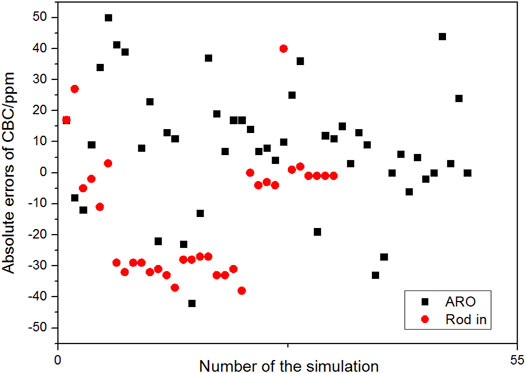
FIGURE 3. Results of critical boron concentration.
The results indicate that the accuracy of ARO calculation is better than that of rod-inserted calculation with the exception of a very few calculations. It is because when the control rods are inside the core, the effect and shadow effect would increase the difficulty for the core simulation.
The results of control rod integral value, boron differential value, and isothermal temperature coefficient are shown in Figure 4, Figure 5, and Figure 6, respectively. The relative errors of control rod integral value are within 10%, the absolute errors of boron differential value are within 1.0 pcm/ppm, and the absolute errors of isothermal temperature coefficient are within 3.6 pcm/°C. The large errors appearing in the results belong to the subsequent cycles. It is caused by the core historical effect. In CORCA-3D, the micro burnup method is applied to handle this problem. The models which are based on the two-step calculation scheme adopted in the software cannot fully account for the historical processes. Anyway, all of them agreed with the acceptance criteria. It is indicated that TORCH V2.0 software has enough accuracy in predicting the reactor startup physics test parameters.
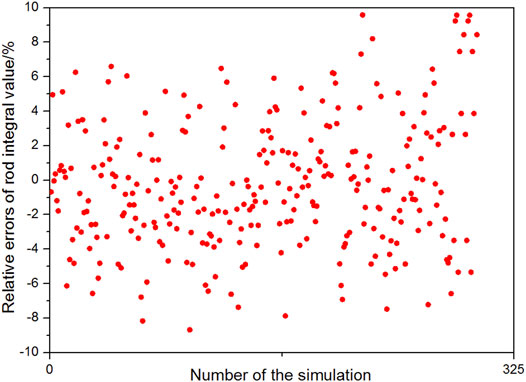
FIGURE 4. Results of the control rod integral value.
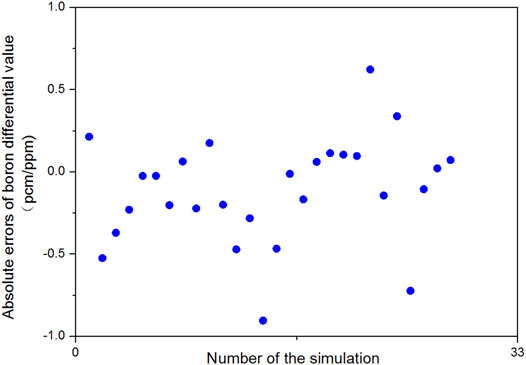
FIGURE 5. Results of the boron differential value.
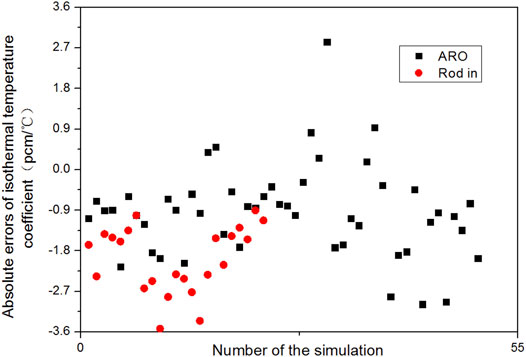
FIGURE 6. Results of the isothermal temperature coefficient.
Compared parameters of the NPP operation include critical boron concentration, assembly-wise power distribution, hot spot factor, and nuclear enthalpy rise factor. The partial results of critical boron concentration are shown in Figure 7. The absolute errors of critical boron concentration of all the measured points shown in Figure 8 are within ±50 ppm except for very few points. At the beginning and end of the core cycle life, the absolute errors are almost worse than those of other times. The changes in xenon concentration and distribution at the beginning of the core cycle life and the core historical effect enhanced with depletion lead to increased errors.
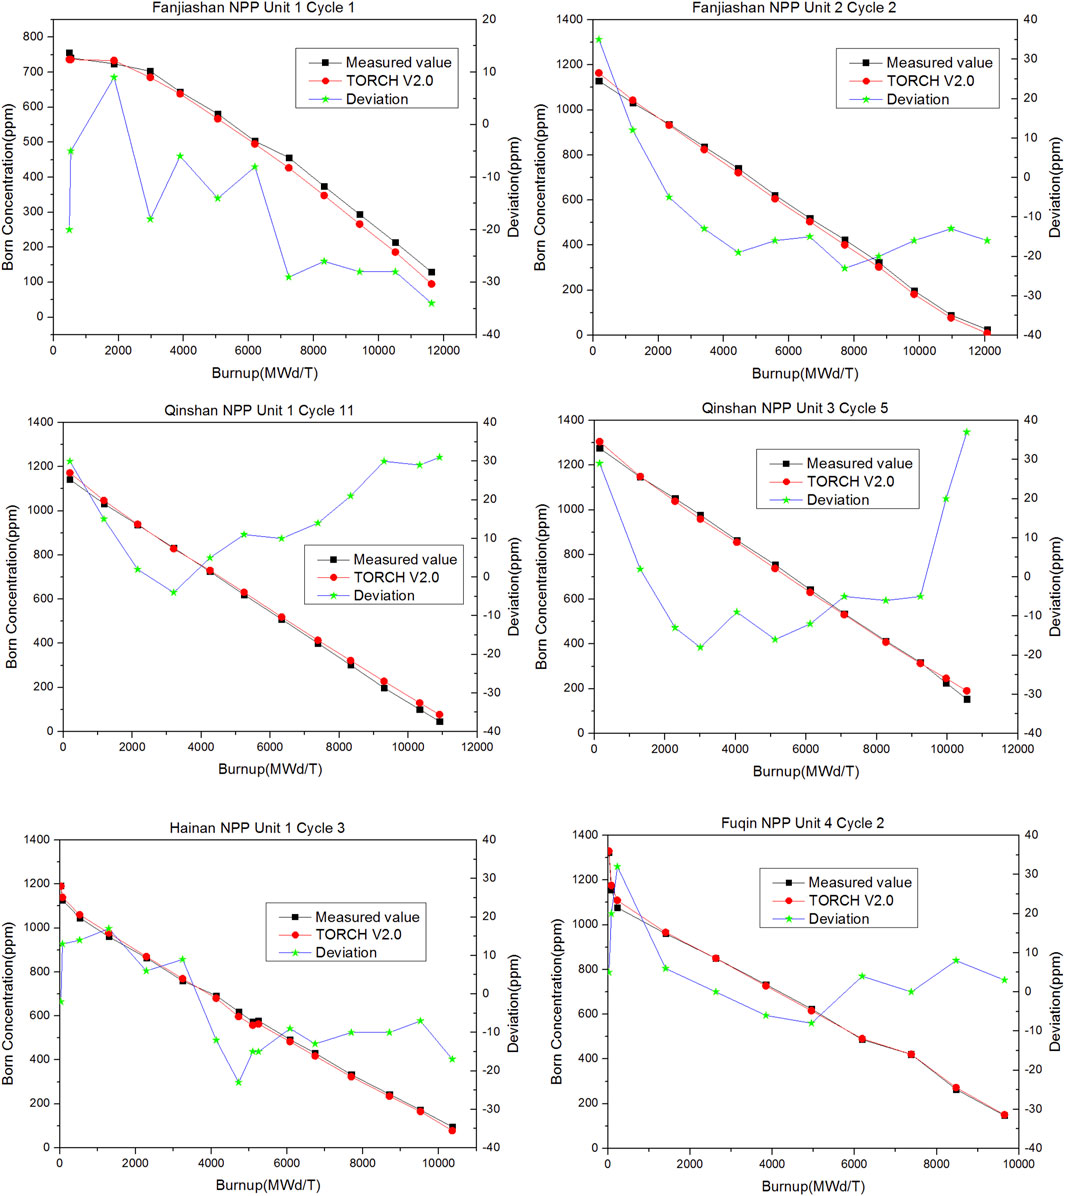
FIGURE 7. Partial results of critical boron concentration.
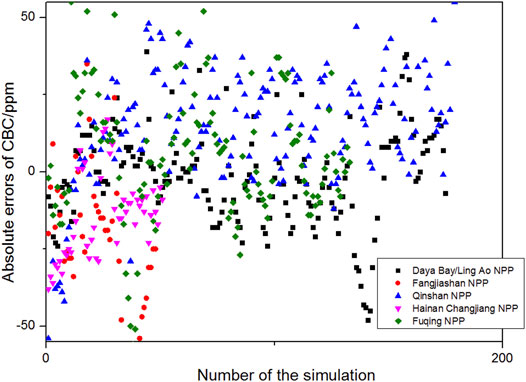
FIGURE 8. Results of critical boron concentration.
The partial results of maximum assembly-wise power relative error are shown in Tables 2–4, summary of the maximum assembly-wise power relative errors of all burnup steps is shown in Figure 9 and Figure 10, and the maximum relative errors are within 5% when the relative assembly power is greater than 0.9 and within 8% when it is less than 0.9, except for very few points. The assembly-wise power distributions of Daya Bay NPP (Unit 1 Cycle 11) at the beginning, middle, and end of the core life are shown in Figures 11–13 respectively. It can be found that the calculation accuracy does not get worse with the increase in depletion.
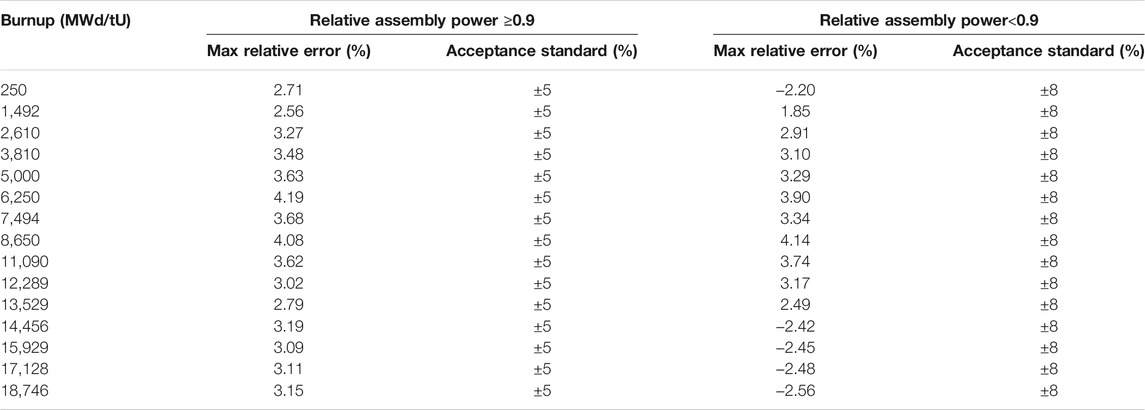
TABLE 2. Results of Daya Bay NPP (Unit 1 Cycle 11) assembly-wise power.

TABLE 3. Results of Ling Ao NPP (Unit 2 Cycle 7) assembly-wise power.
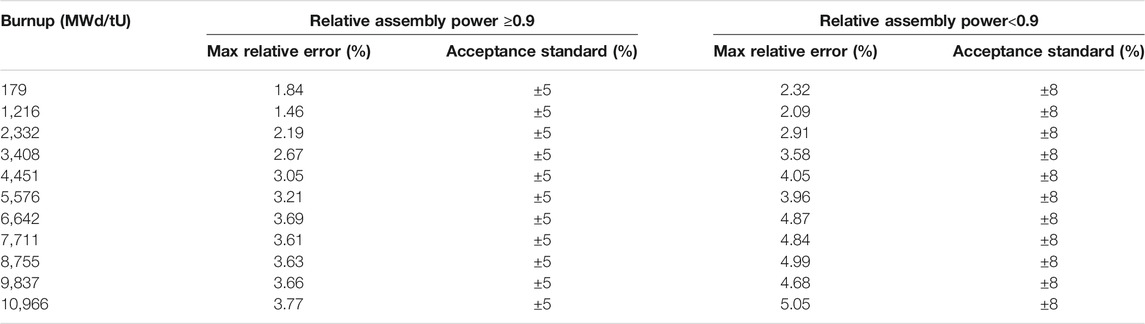
TABLE 4. Results of Fangjiashan NPP (Unit 2 Cycle 4) assembly-wise power.
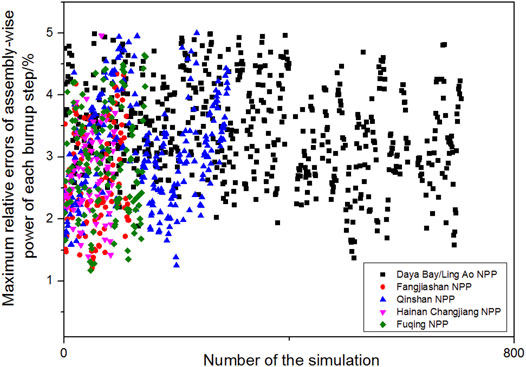
FIGURE 9. Results of assembly-wise power (greater than 0.9).

FIGURE 10. Results of assembly-wise power (less than 0.9).
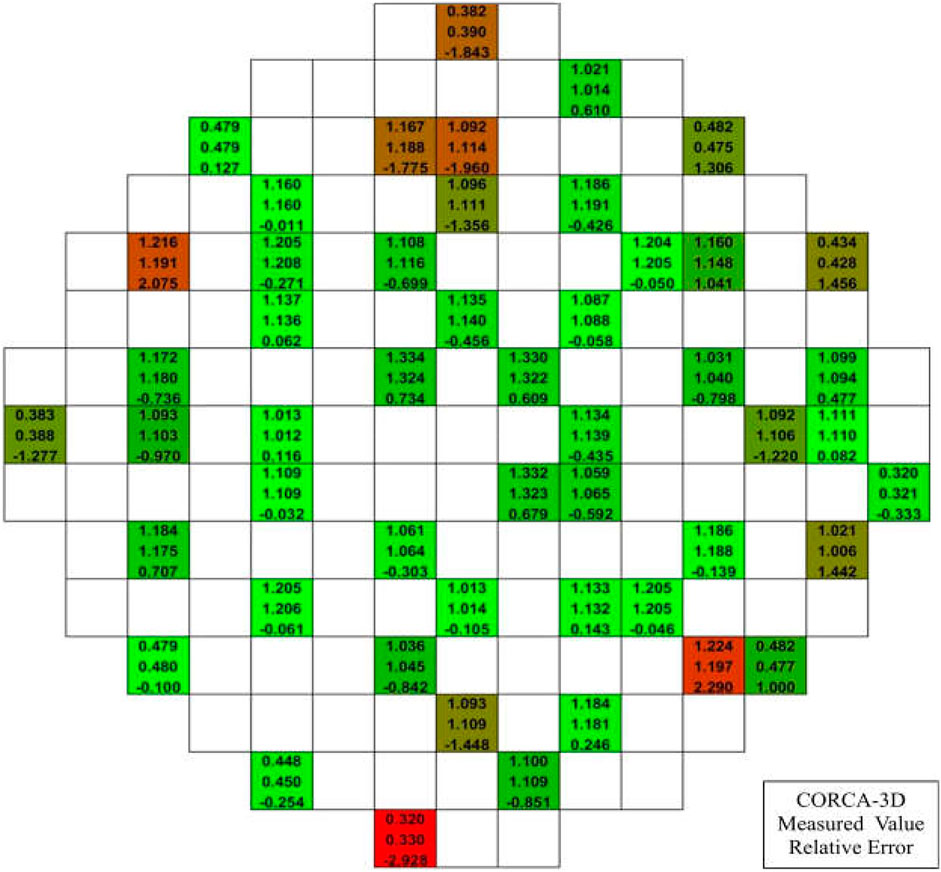
FIGURE 11. Assembly-power distribution of Daya Bay NPP (Unit 1 Cycle 11) 250MWd/tU.
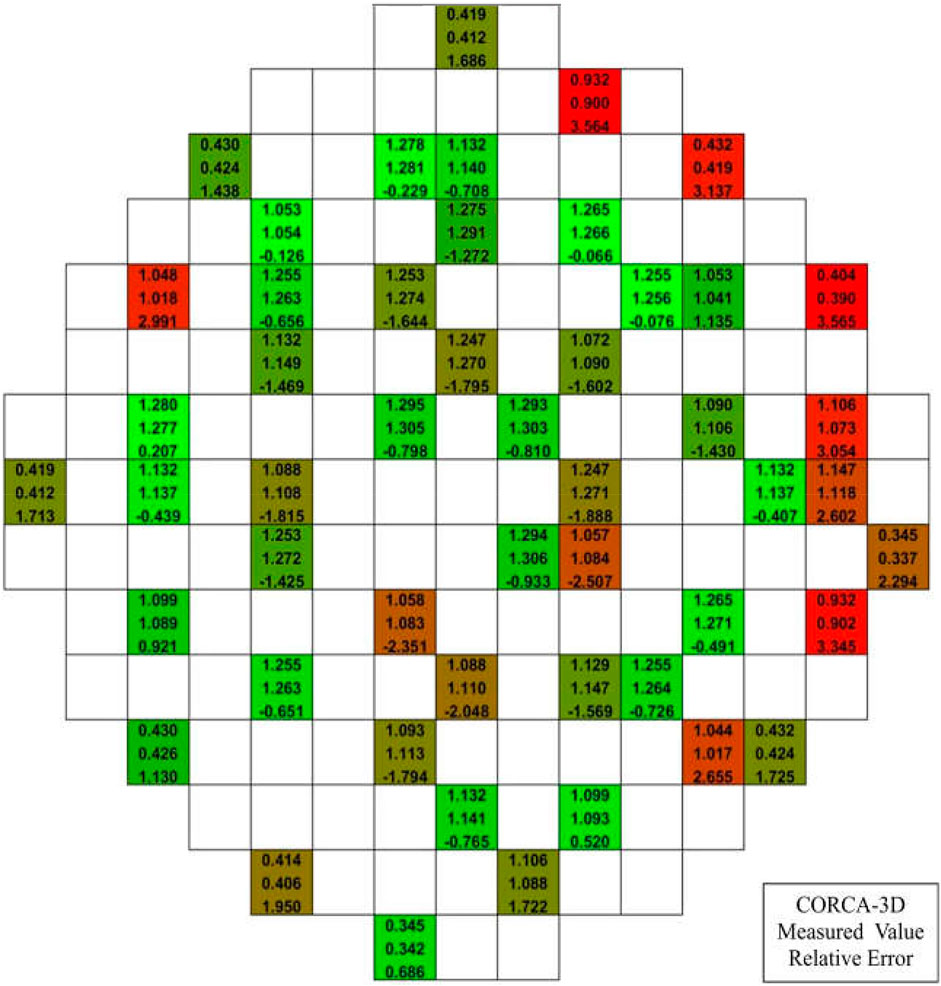
FIGURE 12. Assembly-power distribution of Daya Bay NPP (Unit 1 Cycle 11) 860MWd/tU.
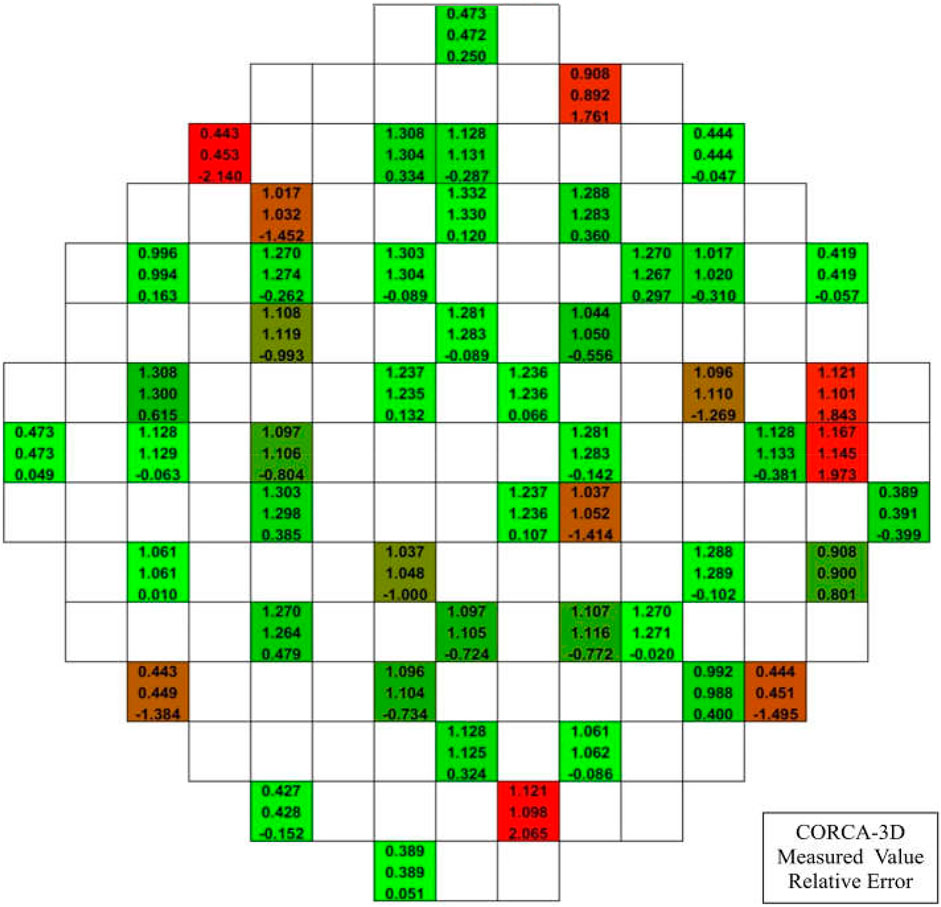
FIGURE 13. Assembly-power distribution of Daya Bay NPP (Unit 1 Cycle 11) 18746MWd/tU.
The hot spot factors of Daya Bay NPP (Unit 1 Cycle 11) are shown in Figure 14. The relative errors of hot spot factors of all cycles are shown in Figure 15; the relative errors of hot spot factor are within 8%. The nuclear enthalpy rise factors of Daya Bay NPP (Unit 1 Cycle 11) are shown in Figure 16. All the relative error results of nuclear enthalpy rise factor are shown in Figure 17; the relative errors are within 5%.
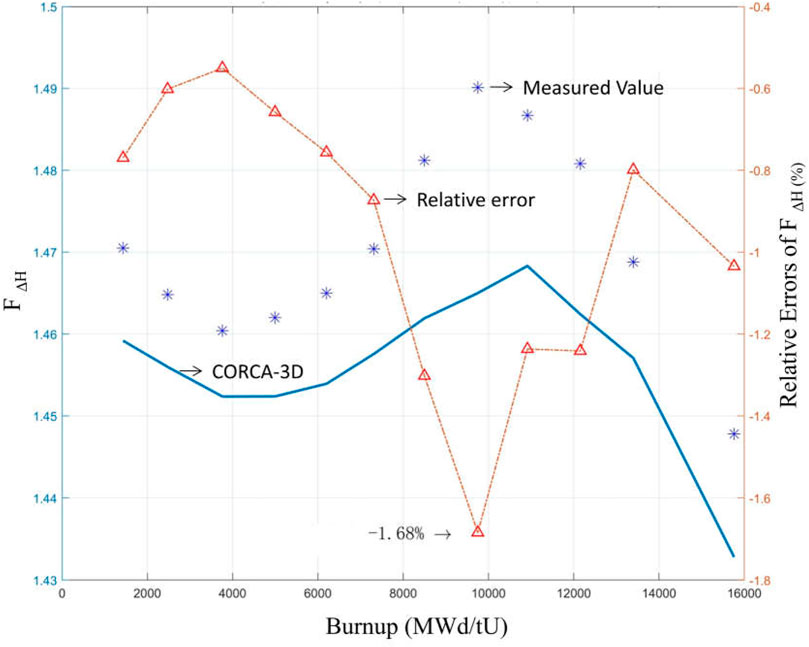
FIGURE 14. Hot spot factors of Daya Bay NPP (Unit 1 Cycle 11).
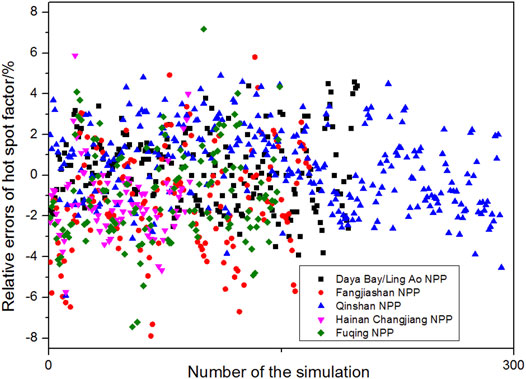
FIGURE 15. Results of the hot spot factor.
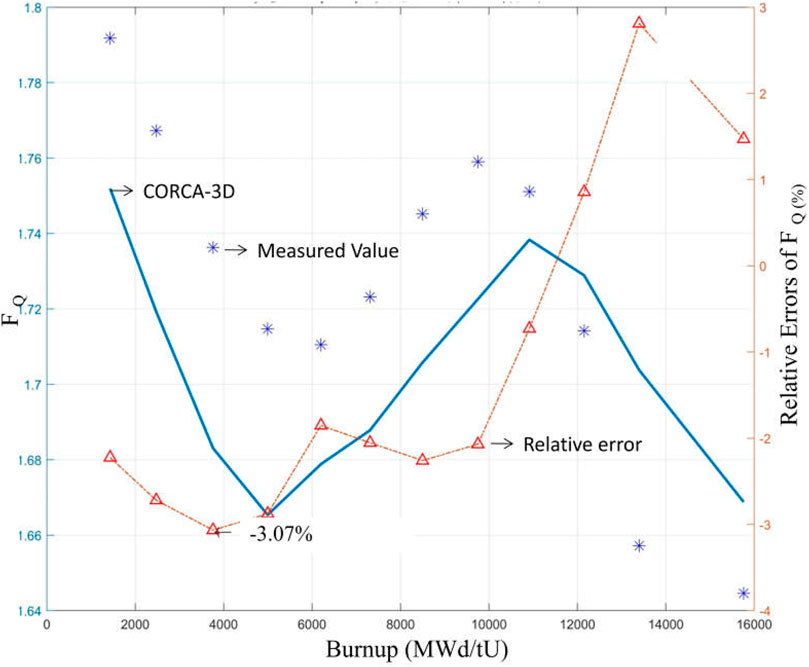
FIGURE 16. Nuclear enthalpy rise factors of Daya Bay NPP (Unit 1 Cycle 11).
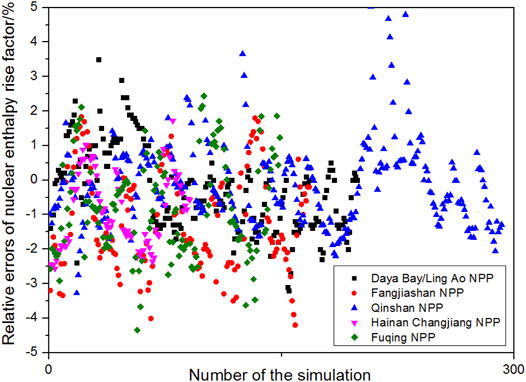
FIGURE 17. Results of the nuclear enthalpy rise factor.
All the calculated parameters are in good accordance with the measured values, which are in agreement with the acceptance criteria. For each core cycle of the NPP used to perform the validation, the average computer processing time of calculations is several minutes. Before the core simulation, the assembly-homogenized few-group constants and the databank of core front-order loops should be ready. The results show that TORCH V2.0 software has high calculation accuracy and efficiency for each cycle operation data of each power plant.
In this article, the main components of the PWR core design software package TORCH V2.0 and the main theoretical models and program features adopted in different codes are briefly introduced, and TORCH V2.0 software is verified by using the data of the reactor startup physics test and NPP operation of each power plant. With the exception of very few results of critical boron concentration for some deep operation cycles, all the results of the compared parameters are in good accordance with the measured values, which are in agreement with the industrial acceptance criteria. The results show that the software TORCH V2.0 has reliable calculation ability and can be applied in the PWR nuclear power engineering design which is based on square fuel assembly. In the future, the uncertainty analysis of TORCH V2.0 would be carried out for the comprehensive verification and validation.
The raw data supporting the conclusions of this article will be made available by the authors, without undue reservation.
XP contributed significantly to analysis and manuscript preparation; CZ performed the data analysis; WZ contributed to analysis and manuscript preparation; QL performed the data analyses and wrote the manuscript. All authors contributed to the article and approved the submitted version.
This study is supported by the National Natural Science Foundation of China (Grant No. 11905214, 12005215) and China Association for Science and Technology (Young Elite Scientists Sponsorship Program 2019QNRC001).
The authors declare that the research was conducted in the absence of any commercial or financial relationships that could be construed as a potential conflict of interest.
All claims expressed in this article are solely those of the authors and do not necessarily represent those of their affiliated organizations, or those of the publisher, the editors, and the reviewers. Any product that may be evaluated in this article, or claim that may be made by its manufacturer, is not guaranteed or endorsed by the publisher.
Adrien, M. (2014). Applicability of SCIENCE V2 Physical Validation to FA3 EPRTM Reactor Rouen, Normandie: Framatome.
An, P., Ma, Y. Q., and Guo, F. C. (2019). Development and Validation of Critical Boron Concentration and Burnup Calculation of Software CORCA-3D[J]. Nucl. Power Eng. 40 (4), 161–165. doi:10.13832/j.jnpe.2019.04.0161
Chai, X. M., Tu, X. L., and Guo, F. C. (2017). Development and Preliminary Verification of Advanced Neutronics Grid Program KYIN-2[J]. High Power Laser Part. Beams 29 (1), 1–7. doi:10.11884/HPLPB201729.160306
CJU1C1-WRS-410100-BG1 Rev. 0 (2016). The Nuclear Design Report for Hainan Changjiang Nuclear Power Plant Unite 1 Cycle 1. Chengdu: China Nuclear Power Research and Design Institute.
DYBU1C9-WRS-410100-BG1 Rev. 0 (2010). The Nuclear Design Report for Daya Bay Nuclear Power Plant Unite 1 Cycle 9. Chengdu: China Nuclear Power Research and Design Institute.
FJSU1C1-WRS-410100-BG1 Rev. 0 (2016). The Nuclear Design Report for Fangjiashan Nuclear Power Plant Unite 1 Cycle 1. Chengdu: China Nuclear Power Research and Design Institute.
FQU1C1-WRS-410100-BG1 Rev. 0 (2016). The Nuclear Design Report for Hainan Fuqing Nuclear Power Plant Unite 1 Cycle 1. Chengdu: China Nuclear Power Research and Design Institute.
Hebert, A. (2004). A Mutual Resonance Shielding Model Consistent with Ribon Subgroup equations[C]. Chicago: PHYSOR 2004.
Hong, S. G., and Cho, N. Z. (1998). CRX: A Code for Rectangular and Hexagonal Lattices Based on the Method of Characteristics. Ann. Nucl. Energ. 25 (8), 547–565. doi:10.1016/s0306-4549(97)00113-8
Kosaka, S., and Takeda, T. (2004). Verification of 3D Heterogeneous Core Transport Calculation Utilizing Non-linear Iteration Technique. J. Nucl. Sci. Tech. 41 (6), 645–654. doi:10.1080/18811248.2004.9715529
LAU1C5-WRS-410100-BG1 Rev. 0 (2009). The Nuclear Design Report for Ling Ao Nuclear Power Plant Unite 1 Cycle 5. Chengdu: China Nuclear Power Research and Design Institute.
Li, Y., Gao, S., Wu, H., Cao, L., and Shen, W. (2016). PWR Few-Group Constants Parameterization Analysis. Prog. Nucl. Energ. 88, 104–117. doi:10.1016/j.pnucene.2015.12.011
Liu, Y. S., and Meliksetian, A. (1986). ANC – A Multi-Dimensional Neutronic Advanced Nodal Code[R]. USA: Westinghouse Electric Company.
Nikilaev, M., Ignatcv, A., and Isaev, N. (1970). The Method of Subgroups for Considering the Resonance Structure of Cross Sections in Neutron Calculations [J]. Atomnaya Energiya 29, 11–16. doi:10.1007/BF01408755
QSU1C1-WRS-410100-BG1 Rev. 0 (2005). The Nuclear Design Report for Qinshan Nuclear Power Plant Unite 1 Cycle 1. Chengdu: China Nuclear Power Research and Design Institute.
Tu, X. L., Chai, X. M., and Lu, K. (2016). “Development and Preliminary Verification of Characteristic Line Method Module in Advanced Neutronics Grid Program KYLIN-2[C],” in China Annual Conference on Reactor Physics, Beijing, China Beijing, China: China Nuclear Society (CNS).
Vidal, J. F., Bay, C., and Archier, P. (2014). Transport Core Solver Validation for the Astride Conceptual Design Study with APOLLO3[C]. PHYSOR2014. Japan: Kyoto.
Yamamoto, A., Tatsumi, M., and Sugimura, N. (2009). Projected Predictor-Corrector Method for Lattice Physics Burnup Calculations. Nucl. Sci. Eng. 163 (2), 144–151. doi:10.13182/nse08-80
Zhang, T. F., Wu, H. C., Cao, L. Z., and Li, Y. Z. (2018). An Improved Variational Nodal Method for the Solution of the Three Dimensional Steady-State Multi-Group Neutron Transport Equation. Nucl. Eng. Des. 337, 419–427. doi:10.1016/j.nucengdes.2018.07.009
Keywords: validation and verification, TORCH V2.0, nuclear power plant operation data, measurements, startup physics test
Citation: Zhang B, Peng X, Zhao C, Zhao W and Li Q (2022) Validation of PWR Neutronics Code Package TORCH V2.0 With Nuclear Power Plant Measurements. Front. Energy Res. 9:779243. doi: 10.3389/fenrg.2021.779243
Received: 18 September 2021; Accepted: 27 December 2021;
Published: 24 January 2022.
Edited by:
Jun Wang, University of Wisconsin-Madison, United StatesReviewed by:
A. Abdelghafar Galahom, Higher Technological Institute, EgyptCopyright © 2022 Zhang, Peng, Zhao, Zhao and Li. This is an open-access article distributed under the terms of the Creative Commons Attribution License (CC BY). The use, distribution or reproduction in other forums is permitted, provided the original author(s) and the copyright owner(s) are credited and that the original publication in this journal is cited, in accordance with accepted academic practice. No use, distribution or reproduction is permitted which does not comply with these terms.
*Correspondence: Xingjie Peng, cGVuZ3hpbmdqaWV0c0AxMjYuY29t
Disclaimer: All claims expressed in this article are solely those of the authors and do not necessarily represent those of their affiliated organizations, or those of the publisher, the editors and the reviewers. Any product that may be evaluated in this article or claim that may be made by its manufacturer is not guaranteed or endorsed by the publisher.
Research integrity at Frontiers
Learn more about the work of our research integrity team to safeguard the quality of each article we publish.