 Ya Wu
Ya Wu Yitong Zhou
95% of researchers rate our articles as excellent or good
Learn more about the work of our research integrity team to safeguard the quality of each article we publish.
Find out more
ORIGINAL RESEARCH article
Front. Energy Res. , 18 February 2022
Sec. Sustainable Energy Systems
Volume 9 - 2021 | https://doi.org/10.3389/fenrg.2021.778757
This article is part of the Research Topic Technologies and Policies for Decarbonisation of the Industrial and Transport Sectors View all 7 articles
Promoting carbon emissions of the transportation industry to reach the peak as soon as possible is an effective way to control carbon emissions in China. Combined with the logarithmic mean Divisia index (LMDI) model and the Tapio decoupling model, this paper tries to predict and analyze the time, path, and quality of carbon peaking in the transportation industry in China and its eastern, central, and western regions. The research shows the following: 1) Under the “benchmark scenario,” the transportation industry in China and its three regions will not achieve the international commitment of achieving peak carbon emissions by 2030. 2) Under the “radical scenario,” the peak time of China’s transportation industry can be reached in 2027, which is 5 years earlier, 10% peak value lower than that in the “benchmark scenario.” In that scenario, in transportation industry, the eastern region will reach the carbon peak in 2025 and the central and western regions will both reach the carbon peak in 2028. By then, the peak quality of carbon emissions will be better than that under the “benchmark scenario” in transportation industry. This paper can provide theoretical support for promoting carbon emission reductions and carbon peaking in China’s transportation industry.
To combat climate change, greenhouse gases need to be reduced mainly from CO2 emissions in China (Sun et al., 2021). As the world’s largest economy emitting greenhouse gases (Chen et al., 2020; Zhao et al., 2021), China has set a two-stage goal of peaking the carbon emissions by 2030 and achieving carbon neutrality by 2060 to actively shoulder the international responsibility for carbon emission reductions (CPG, 2020a). In recent years, the transportation industry’s carbon emissions accounted for an increasing proportion of the total national carbon emissions, from 9% in 2003 to 13% in 2019 (CESY, 2021). As the foundation of national economic and social development, the transportation industry’s carbon emissions have maintained a rapid growth trend, with an average annual growth rate of as high as 8%. As of 2019, carbon emissions have still not reached the peak or exhibited a slowing trend (IEA, 2021). The growth trend of carbon emissions in the transportation industry may slow down the overall process of China’s carbon peak. Therefore, research on carbon emission reductions and carbon peaking in the transportation industry is of great significance for China to achieve the 2030 goal.
Due to China’s vast territory, there are great differences in economic development, population distribution, and geographical conditions in the eastern, central, and western regions, resulting in different energy consumption structures and carbon emission efficiency of the transportation industry in its eastern, central, and western regions. This represents the overall peak of the transportation industry does not mean that the eastern, central, and western regions can reach the peak at the same time. Therefore, to promote China’s transportation industry to achieve the carbon peak “quickly and well” and follow the strategic deployment of places with conditions to reach the peak first, it is necessary to conduct an in-depth analysis of the peak time and quality of the eastern, central, and western regions based on predicting the carbon peak of China’s transportation industry.
Based on the above realistic background, this paper intends to study the following issues: first, analyzing the relationship between transportation industry carbon emissions and economic growth and exploring the socio-economic factors of carbon emissions from the transportation industry in China and its eastern, central, and western regions; second, predicting the peak time and peak value of the transportation industry in China and its three regions; and, third, evaluating the carbon peak quality.
Reaching the carbon emission peak does not mean an improvement in carbon emission efficiency. If the carbon peak is achieved at a higher total carbon emission, it will not be conducive to the total control of carbon emissions and will directly affect the time and difficulty of achieving carbon neutrality. Based on the prediction of the peak time and the peak value of the transportation industry, this paper puts forward the judgment criteria of the carbon peak quality and development quality of the transportation industry. This method of judgment is not only scientific and reasonable but also convenient for policy-makers to understand and operate, which is the main innovation of this paper.
The contributions of this paper are as follows: First, different from only studying carbon peak values and time (Liu J. et al., 2018; Chen et al., 2020; Zhao et al., 2021), this paper focuses on peak quality and puts forward the judgment criteria of peak quality. Second, different from the study of individual countries and regions (Fan et al., 2017; Zhang et al., 2020; Zhang and Su, 2020), from a regional perspective, the differences of the peak time, the peak value, and the peak quality in China and its eastern, central, and western regions are compared, which is conducive to the Chinese government to set the carbon peak goal at the regional level, so as to help China realize its carbon peak commitment in 2030 on time.
With the increasing prominence of climate change caused by excessive greenhouse gas emission, in recent years, the influencing factors of carbon emission and its future evolution trend have gradually attracted wide attention in academic circles. Experts and scholars used different models to study the peak time and the peak value of carbon emissions in China. This paper made a comparative analysis of existing prediction models, as shown in Table 1.
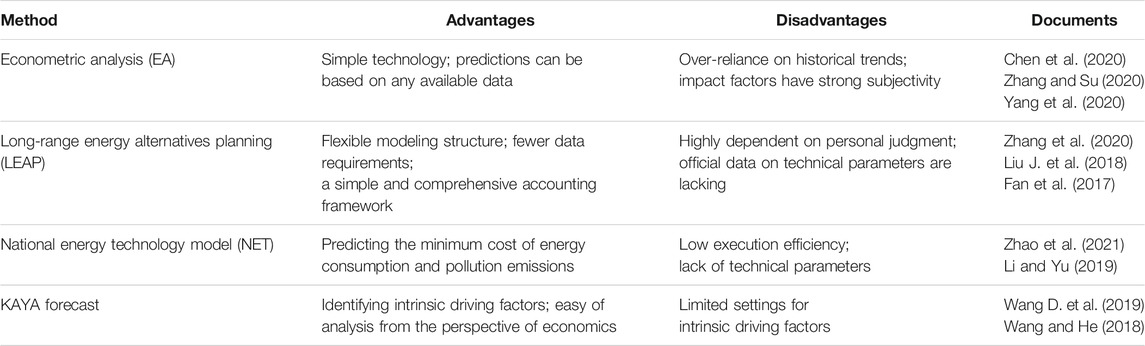
TABLE 1. Comparison of CO2 emission prediction models in the transportation industry.
At present, many experts and scholars study the peaking of carbon emissions from the macro level and the meso level based on different models and scenarios. Regarding the macro-level carbon peak research, the focus of scholars’ research is whether China can fulfill its promise of peaking before 2030. It is expected that China will reach the carbon peak in 2030, which has a greater sense of responsibility for independent contribution than the United States, Japan, and the EU countries (Pan et al., 2017). Wang and He (2018) compared with the United States, Japan and EU countries in predicting the carbon peak of China’s transportation industry, they believe that Chinese peak path is much better than that of developed countries. Similarly, Fragkos and Kouvaritakis (2018) predicted that China will reach the peak in 2030, later than OECD developed economies and earlier than other developing countries such as India. However, the volume of CO2 emissions in the selected economies will continue to increase in the long run if the economic productivity of the OECD panel continues to grow (Sun et al., 2020b), which means that it is difficult to achieve the carbon peak, and the energy structure and energy efficiency are particularly important for emission reduction. In China, some scholars think it will reach the carbon peak in 2030 (Liu and Xiao, 2018; Mi et al., 2017) by optimizing the energy structure, adjusting the industrial structure (Yu et al., 2018), and improving the energy efficiency (Xu et al., 2021; Ding et al., 2019). On the contrary, other scholars believe that it is difficult to realize the adjustment of energy consumption structure in the process of economic development (Duan et al., 2018), such that China’s commitment to the international community cannot be fulfilled (Cui et al., 2019; Wang Z. et al., 2019; Chen et al., 2020). In addition, due to the vast region in China, the national carbon peak target should be divided into regional and provincial levels in accordance with the principles of efficiency and equity (Li et al., 2020), and some scholars focus on the peak time and value of carbon emissions of the area (Cheng et al., 2021) and provinces (Fang et al., 2019; Weng et al., 2019).
For the research on CO2 emission reduction potential at the middle level, domestic and foreign scholars mainly focus on high energy consumption industries such as power transportation. Some scholars believe that the carbon emissions of China’s power industry (Tang et al., 2018; Zhao et al., 2020), construction industry (Li et al., 2021), and heavy chemical industry (Lu et al., 2020) may reach the carbon peak by 2030. However, the economic and social development will lead to more traffic demand and boost the growth of traffic energy consumption (Sun et al., 2020a; Yu et al., 2020). Different scholars consider that the transportation industry may peak carbon emissions before 2030 (Liu J. et al., 2018; Liu L. et al., 2018; Liu et al., 2021; Zhao et al., 2021) and 2050 (Gambhir et al., 2015; Pan et al., 2018; Wang and He, 2018; Zhou et al., 2019; Chen et al., 2020) and after 2050 (Yang et al., 2020; Zhang et al., 2020) in China. Due to differences in the research design of different scholars, such as databases, methods, basic assumptions, and policy objectives, there will be greater flexibility in the forecast peak and time of carbon emission peak in the transportation industry (Fang et al., 2019; Wang D. et al., 2019). In order to analyze the fundamental source of carbon emissions from the perspective of economics (Zhang et al., 2020; Wang et al., 2021), this paper intends to use the LMDI model based on the Kaya model to predict the carbon peak of transportation industry in China.
To sum up, the academia about whether China can achieve commitment on time has not yet reached agreement on carbon emissions to peak, and the industry level of carbon emissions and its peak forecasting are still inadequate; especially, the transportation industry in our country’s carbon emissions still lacks systematic analysis and forecasting of peak values and the corresponding peak policy analysis and recommendations. As a major emitter, it is of global significance to achieve a high-quality carbon peak for China. Therefore, this paper attempts to put forward the standard to evaluate the quality of carbon peak and discuss the peak time and how to achieve a high-quality peak in transportation industry in China.
To measure the carbon emissions of the transportation industry in eastern, central, and western regions of China, this paper adopts the inventory method introduced in the 2006 IPCC Guidelines for National Greenhouse Gas Inventories (IPCC, 2006). The specific calculations are as follows:
where
To study the relationship between carbon emissions in the transportation industry and economic development, this paper introduces a decoupling model. Decoupling models include the OECD decoupling index, Velma decoupling index, and Tapio decoupling index (Wu et al., 2019). The Tapio decoupling model further subdivides the decoupling state, and its results are more accurate than those of the previous two methods. Therefore, this study chooses the Tapio decoupling model for research. The calculations are as follows:
where ε is the decoupling index,
In order to measure the peak quality of carbon emissions in the transportation industry, based on the Tapio decoupling model, this paper puts forward the quality evaluation criteria of carbon peak in the transportation industry: take the peak (historical highest value) to 1 year after the peak as the research period to measure the peak quality. If the decoupling index is smaller, then the peak quality is higher. Similarly, the development quality of the transportation sector is also measured by the annual decoupling index. The reasons for that approach are as follows: if the decline is faster within 1 year, it proves that the pollution prevention and control measures taken are more effective, and the relationship between carbon emissions and economic growth is weaker, which implies that the peak quality is higher.
To measure the main socio-economic factors that affect the transportation industry’s carbon emissions, this paper selects the logarithmic mean Divisia index (LMDI) model, which has no residuals after decomposition, and can deal with zero-value problems to quantitatively evaluate the action mechanism and contribution efficiency of each factor. The formula is as follows:
where
According to model calculations, the change in carbon emissions from the transportation industry from the base year
Considering that if the technology does not change, under normal circumstances, the carbon emission coefficient of each energy will remain constant, and the effect of the emission coefficient on carbon emissions
where
This paper studies the transportation industry in China and the eastern, central, and western regions from 2003 to 2019. Energy consumption by each region is extracted from the China Energy Statistical Yearbook; other data come from China’s National Bureau of Statistics (http://www.stats.gov.cn/tjsj/). To offset the effects of inflation, GDP in each region was adjusted to 2010 price levels. Due to the unavailability of data, this paper excludes Tibet, Taiwan, Hong Kong, and Macau. According to the classification of the National Bureau of Statistics of China, this paper divides the remaining 30 provinces into the eastern, central, and western regions (Supplementary Appendix SB).
In the national analysis, the carbon emission of China’s transportation industry has not yet peaked from 2003 to 2019, and it is showing a rapid growth trend, with an average annual growth rate of 8% (Figure 1). In regional analysis, carbon emissions in the eastern, central, and western regions have not peaked, and the average annual growth rate in the central and western regions is about 8.5%, which is higher than that in the eastern region (7.4%).
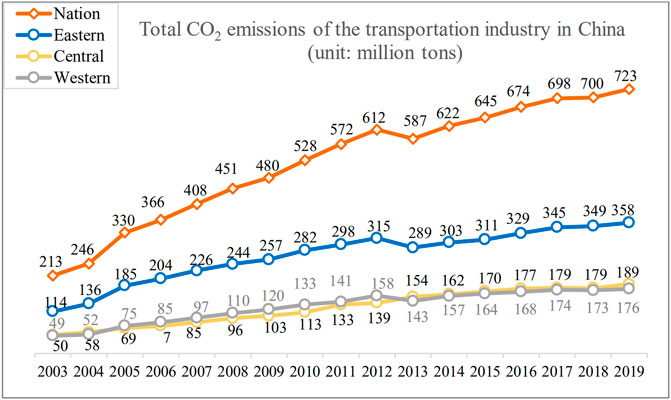
FIGURE 1. Total CO2 emissions of the transportation industry in China (unit: million tons).
Through Tapio elastic analysis, this paper measures the decoupling indicators between carbon emissions and economic growth in the transportation industry from 2003 to 2018. And the historical decoupling status is studied in the medium term (5 years). This period is stable and can intuitively reflect the trend of change. The decoupling indicators in the range of 0–0.8 mean weak decoupling, and those lower than 0 refer to strong decoupling. The lower the value is, the better the decoupling state is. As shown in Figure 2, the decoupling relationship between carbon emissions and economic growth in the transportation industry showed an overall trend of optimization in recent decades.
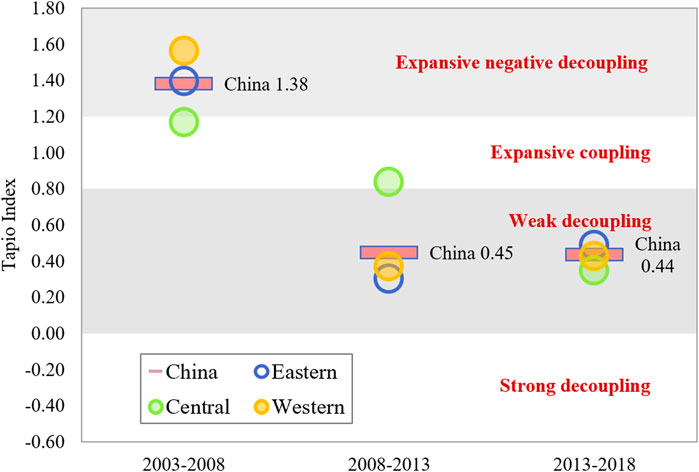
FIGURE 2. Decoupling relationships between carbon emissions and economic growth.
At the national level, from 2003 to 2008, the decoupling index was 1.38, indicating that the growth rate of carbon emissions from the transportation industry was significantly higher than the growth rate of economic development, that is, the development of the transportation industry at the expense of the environment. From 2008 to 2013, the decoupling index decreased to 0.45, indicating a slowdown in the growth of CO2 emissions while GDP grew. The decoupling index from 2013 to 2018 was basically the same as that from 2008 to 2013, which shows that the quality of carbon emissions in the transportation industry has stagnated recently.
At the regional level, from 2003 to 2013, the decoupling index of carbon emissions and economic growth in the central region has been in a state of expansive coupling, indicating that the decline in carbon emissions in the central region is not obvious; the eastern and western regions have changed from an expansive negative decoupling state to a weak decoupling state. From 2013 to 2018, the three major regions all showed a weak decoupling state.
Although the decoupling status of China and its three regions is weak decoupling, it is still a long way from strong decoupling. This means that, with the economic growth, the CO2 of China’s transportation industry is still growing slowly, and the trend of emission inflection point is not obvious. It can be seen that exploring the emergence of emission inflection point has become an important topic.
To predict the trend of carbon emissions reasonably, this paper employs the LMDI model to analyze the main socio-economic factors that lead to the growth of carbon emissions.
From 2003 to 2019, the total CO2 emissions of China’s transportation industry increased by 510 million tons (Mt). Among them, economic growth and population size have a positive effect on carbon emissions, while the energy structure and energy intensity have a negative effect on carbon emissions (Figure 3). The energy intensity reduces carbon emissions by 100 Mt, and the contribution rate to the growth of CO2 emissions is −20%. The energy intensity of the transportation industry can be improved via developing and utilizing the energy-saving and emission reduction technologies, and the carbon emissions will be suppressed effectively.
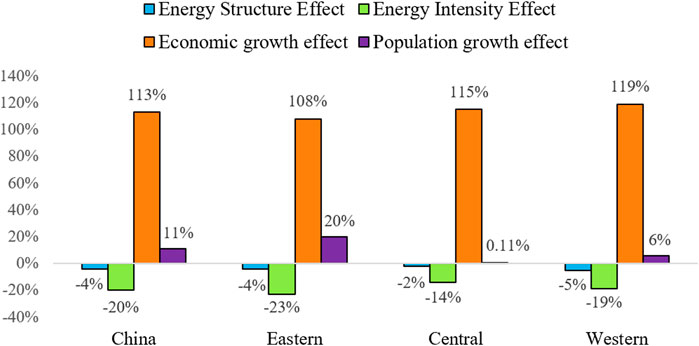
FIGURE 3. Contribution rate of four effects on carbon emissions’ growth. Note:
The eastern region is the most developed region with high-quality human capital. The energy-saving and emission reduction technologies in the eastern region are better than those in the central and western regions because of more investment, and the negative contribution rate of energy intensity to the growth of carbon emissions is −23%. The central region is under great economic growth pressure and has undertaken some high-energy industries transferred from the eastern region. Therefore, the contribution rate of energy intensity effect is only −14%, while that of the western region is −19%.
The energy structure resulted in a 19.45 Mt reduction in transportation carbon emissions, with a contribution rate of −4%. The improvement of the energy structure is attributed to the increase in the proportion of clean energy due to the implementation of energy conservation and emission reduction policies. The contribution of energy structure in the eastern, central, and western regions was −4%, −2%, and −5%, respectively.
The economic growth effect and population growth effect are the main drivers of carbon emissions’ growth. From 2003 to 2019, CO2 emissions increased by 574.79 Mt due to economic growth, and the contribution rate is 113%; CO2 emissions increased by 55.34 Mt due to population growth, and the contribution rate is 11%.
From the LMDI model, optimizing the energy structure and reducing the energy intensity are the primary ways to reduce carbon emissions in the transportation industry. Therefore, according to Eq. 4, the predicted CO2 emission of the transportation sector can be described as
where
Combined with the important speech of General Secretary Xi Jinping at the Climate Ambition Summit and China’s policies or objectives in 2030 and 2035 (CPG, 2020a; CPG, 2020b; CF40, 2020), the benchmark scenario will be designed to predict the carbon peak time and peak value of the transportation industry. In Table 2, the benchmark targets for 2030 and 2035 are listed.
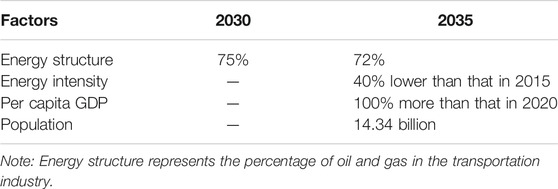
TABLE 2. Benchmark scenario of the transportation industry’s development in 2030 and 2035.
Based on the benchmark scenario, according to the changes in the two major factors of energy structure and energy intensity, three scenarios are set in Table 3. In scenario 1 (mild scenario A), it is assumed that the energy structure is cleaner than that in the benchmark scenario in 2030 and 2035, i.e., the oil and gas proportion will be reduced to 70% in 2030 and 65% in 2035. In scenario 2 (mild scenario B), it is assumed that the energy intensity will be lower than that in the benchmark scenario by 2035, i.e., the energy intensity will decrease by 5%. In scenario 3 (radical scenario), it is assumed that, in 2030, the energy structure and energy intensity are improved at the same time, i.e., scenario 1 and scenario 2 are combined. It should be specifically noted that although GDP growth and population growth are the main factors affecting carbon emissions, we do not consider sacrificing economic interests and demographic dividends to achieve carbon emission reduction. Therefore, the scenario changes of economic growth and population growth are not considered in the prediction of this paper. The economic growth rate and population growth rate of mild scenario and radical scenario are consistent with those in the benchmark scenario, and the energy structure and energy efficiency will change at a constant rate.
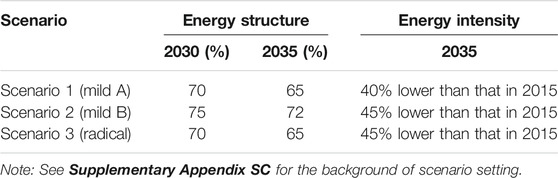
TABLE 3. Mild and radical scenarios of the transportation industry’s development.
At the national level, under the benchmark scenario, the transportation industry will achieve the carbon peak in the year 2032 with 880.86 Mt carbon emissions (Figure 4). In mild scenario A, the peak time is 2029, 3 years earlier than that in the benchmark scenario, and the peak value is 821.95 Mt. In mild scenario B, the peak time is the same as that of mild scenario A, but the peak value increases by 14.53 Mt compared with that in mild scenario A. In the radical scenario, the carbon peak of the transportation industry will be advanced to the year 2027, reaching a peak of 792.31 Mt, which is 88.55 Mt less than that in the benchmark scenario.
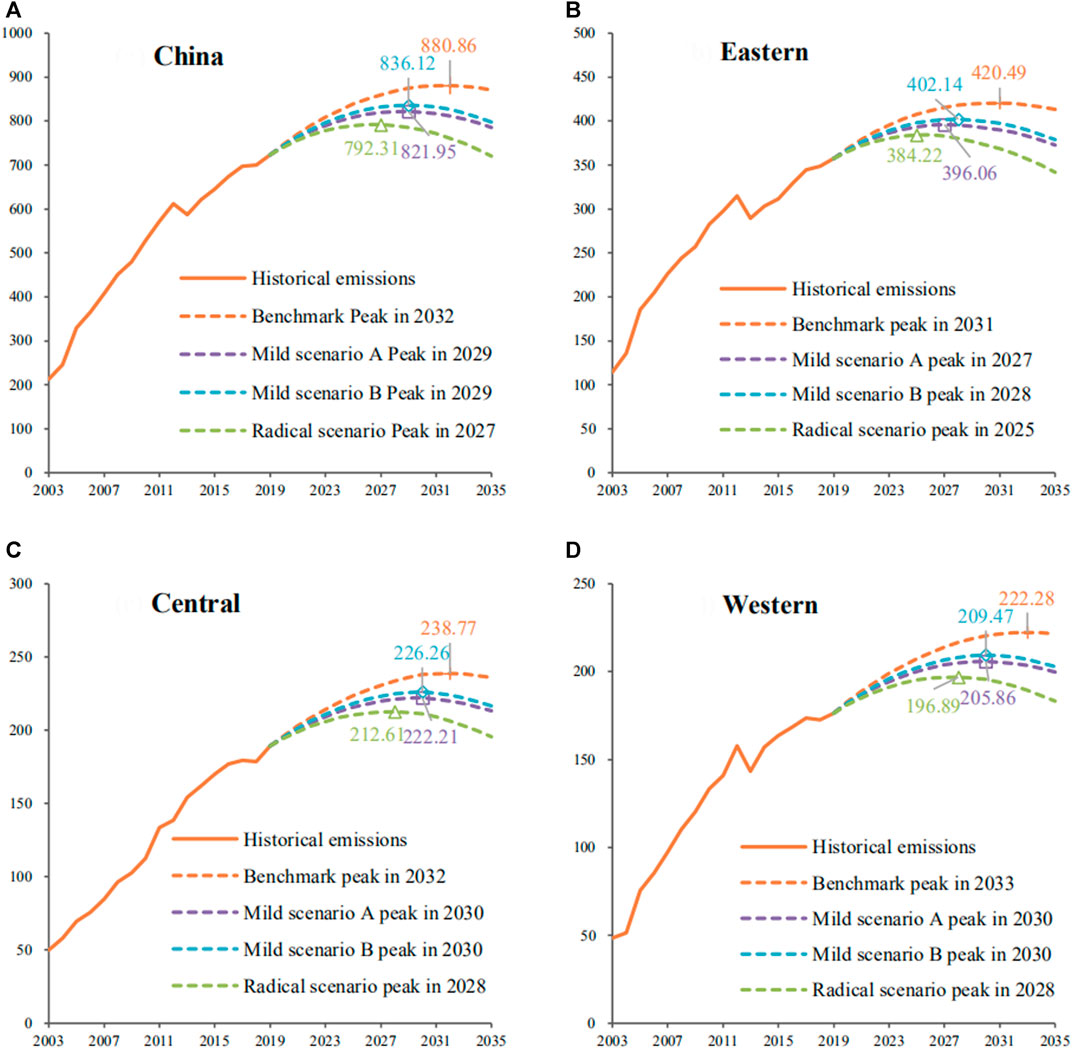
FIGURE 4. (A–D) Trend of CO2 emissions in the transportation industry in China and its eastern, central, and western regions (unit: million tons).
At the regional level, in the benchmark scenario, the eastern region will reach the peak in the year 2031, with 420.49 Mt carbon emissions, and the central region and western region will peak in the years 2032 and 2033, respectively, with carbon emissions of 238.77 Mt and 222.28 Mt, respectively. Reasons for these results are that the eastern region pays more attention to the quality of economic development and considers environmental constraints at the same time, while the central and western regions focus on the speed of economic growth, and the rapid economic growth effect offsets the energy structure effect and energy intensity effect, resulting in the increase of carbon emissions year by year, and the peak time is relatively late.
In mild scenario A, the eastern region is expected to reach the peak in the year 2027, 2 years earlier than the country, indicating that the eastern region’s emission peak will help drive China’s transportation carbon emissions to peak. The central region and the western region will reach the peak simultaneously in the year 2031. In mild scenario B, the eastern region will peak in the year 2029, and the central region and the western region will reach the peak simultaneously in the year 2030. Comparing the results of mild scenarios A and B, it can be found that optimizing the energy structure is more conducive to the transportation industry in the eastern region to achieve the carbon peak and reducing the energy intensity is more conducive to the transportation industry in the central and western regions to achieve the carbon peak. In the radical scenario, the eastern region will reach the carbon peak at 384.22 Mt in 2025, while the central region and western region will reach the carbon peak at 212.61 Mt and 196.89 Mt in the year 2028.
To sum up, China’s transportation industry cannot reach the carbon peak by 2030 under the current policy. With a small improvement in the energy structure or energy intensity, the peak time can be reached in the year 2029 under the mild scenario and in the year 2027 under the radical scenario. However, reaching the peak does not mean a high carbon peak quality. Under various policy scenarios, the carbon peak quality will be analyzed in combination with the Tapio decoupling index.
First, the decoupling index between carbon emissions and economic growth is used to reflect the quality of carbon peak when reaching the peak (Table 4).
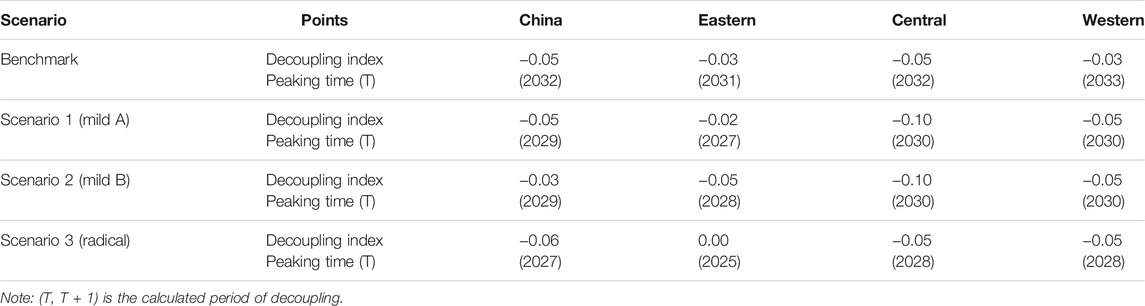
TABLE 4. Comparison of the peak quality in four scenarios.
The smaller decoupling index means the weaker correlation between carbon emissions and economic growth and the better quality of carbon peak. From a regional perspective, mild scenario B is a better scenario. When the carbon emission reaches the peak, under mild scenario B, the decoupling index is −0.05 in the eastern region, the decoupling index is −0.1 in the central region, and the decoupling index is −0.05 in the western region, which is better than that in the other three scenarios. Unfortunately, the peak year in this scenario is later than that in the radical scenario, which is mainly influenced by eastern China. In eastern China, reaching the peak in advance will not obtain higher peak quality because of the rapid economic development and adjusting the energy structure and reducing the energy intensity cannot effectively offset the carbon emissions caused by the economy. Therefore, sometimes, reaching the peak in advance does not mean high quality.
From a national perspective, the radical scenario is a better scenario. When carbon reaches the peak, the decoupling index of the radical scenario is −0.06, which is better than that of the benchmark scenario (−0.05) and mild scenarios A (−0.05) and B (−0.03), indicating that the “two-pronged” approach of optimizing the energy structure and improving the energy efficiency can not only shorten the peaking time and reduce the peak value effectively but also achieve a better peaking quality.
Then, the decoupling index is used to reflect the quality of transportation industry development in 2030 (Table 5). In each policy scenario, the peak time is discrete. The decoupling index of different peak time lacks a uniform benchmark to compare with. China has a commitment to reach the peak in the year 2030 to the international community. By examining the relationship between carbon emissions and economic growth in 2030, we can compare the development quality under different policy scenarios in a unified time dimension. In 2030, the benchmark scenario has the worst decoupling state, that is, weak decoupling; both mild and radical scenarios achieve strong decoupling. The decoupling index of radical scenario is the best, and mild scenarios are second only to the radical scenario. This means that the development quality of China’s transportation industry will be relatively good in the mild scenario and radical scenario in 2030. Overall, this paper believes that both mild scenario B and radical scenario will be excellent scenarios to promote carbon emissions to peak.
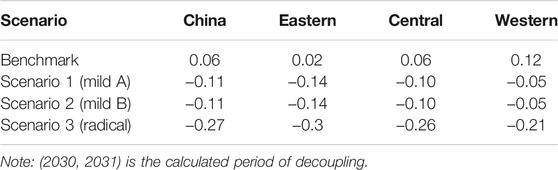
TABLE 5. Decoupling indices in 2030.
This paper analyzes the relationship between transportation industry carbon emissions and economic growth and explores the socio-economic factors of carbon emissions. On this basis, it predicts the peak time, peak value, and peak quality of carbon emissions in China and the eastern region, central region, and western region. The main conclusions are as follows.
From a regional perspective, mild scenario B may be the best scenario for carbon emission reduction. In the benchmark scenario, the transportation industry in eastern, central, and western China cannot achieve the goal of reaching the carbon peak by 2030. In mild scenario B, carbon emissions will reach the peak by 2028 in the eastern region, carbon emissions will reach the carbon peak by 2030 in the central and western regions, and the peak quality is better than that in the benchmark scenario. Therefore, mild scenario B is considered to be one of the best scenarios.
From a national perspective, the radical scenario is the best scenario for carbon emission reduction. Under the benchmark scenario, the transportation industry is expected to peak in 2032. Under the radical scenario, the peak time of China’s transportation industry may be in 2027. And the peak quality of carbon emissions will be better than that under the benchmark scenario in transportation industry. Therefore, the radical scheme is considered to be one of the best choices to advance the peak time and ensure the peak quality.
To sum up, to promote the transportation industry to achieve the carbon peak “quickly and well,” the carbon emission quality can be improved from the following two aspects:
First, the transportation energy structure should be improved and transportation energy should be transformed to green energy. For example, through cutting tax, adding subsidies, and publishing policies to increase support for new energy vehicles, the promotion of new energy vehicles is accelerated to replace traditional fuel vehicles.
Second, technical progress should be promoted in the transportation industry. Reduction in energy intensity is a key factor in peaking. The government should provide policy support to encourage enterprises to actively reduce automobile energy consumption by optimizing automobile engine technology and other transportation energy-saving technologies.
At the regional level, the eastern region should pay attention to the optimization of transportation energy structure due to its high traffic density. And the central region and western region should concentrate on improving the transportation energy efficiency due to having the potential for technological progress.
The original contributions presented in the study are included in the article/Supplementary Material, and further inquiries can be directed to the corresponding author.
YW conceptualized the research idea and was involved in formal analysis and funding acquisition. YW and YZ performed the methodology. YZ ran the software. YW and YL were involved in data validation. YZ and JL curated the data. YL and JL visualized the data. YW, YZ, and YL wrote and edited the paper. All authors contributed to the article and approved the submitted version.
This work was supported by the National Natural Science Foundation of China (Funding No. 71703060) and Humanities and Social Sciences Youth Foundation, Ministry of Education of the People’s Republic of China (17YJC790170).
The authors declare that the research was conducted in the absence of any commercial or financial relationships that could be construed as a potential conflict of interest.
All claims expressed in this article are solely those of the authors and do not necessarily represent those of their affiliated organizations, or those of the publisher, the editors, and the reviewers. Any product that may be evaluated in this article, or claim that may be made by its manufacturer, is not guaranteed or endorsed by the publisher.
The Supplementary Material for this article can be found online at: https://www.frontiersin.org/articles/10.3389/fenrg.2021.778757/full#supplementary-material
CESY (2021). China Energy Statistical Yearbook. Available at: https://data.cnki.net/Yearbook/Single/N2021050066 (Accessed May 20, 2021).
CF40 (2020). China Finance 40 Forum. Scientific Calculation and Setting: Economic Growth Targets for 2035 and the 14th Five Year Plan. Available at: http://www.cf40.org.cn/news_detail/11402.html (Accessed May 21, 2021).
Chen, X., Shuai, C., Wu, Y., and Zhang, Y. (2020). Analysis on the Carbon Emission Peaks of China's Industrial, Building, Transport, and Agricultural Sectors. Sci. Total Environ. 709, 135768. doi:10.1016/j.scitotenv.2019.135768
Cheng, Y., Dong, H., Geng, J., and He, J. (2021). Energy Demand and Carbon Emission Peak Paths for the Rise of Central China. Chin. J. Eng. Sci. 23 (1), 68. doi:10.15302/j-sscae-2021.01.014
CPG (2020a). The Central People's Government of the People's Republic of China. Carry Forward the Past and Forge Ahead into the Future and Start a New Journey in the Global Response to Climate Change - Speech at the Climate Ambition Summit. Available at: http://www.gov.cn/gongbao/content/2020/content_5570055.htm (Accessed May 20, 2021).
CPG (2020b). The Central People's Government of the People's Republic of China. Suggestions of the CPC Central Committee on Formulating the 14th Five Year Plan for National Economic and Social Development and Long-Term Objectives for 2035. Available at: http://www.gov.cn/xinwen/2020-11/03/content_5556997.htm (Accessed May 20, 2021).
Cui, L., Li, R., Song, M., and Zhu, L. (2019). Can China Achieve its 2030 Energy Development Targets by Fulfilling Carbon Intensity Reduction Commitments? Energ. Econ. 83, 61–73. doi:10.1016/j.eneco.2019.06.016
Ding, S., Zhang, M., and Song, Y. (2019). Exploring China's Carbon Emissions Peak for Different Carbon Tax Scenarios. Energy Policy 129, 1245–1252. doi:10.1016/j.enpol.2019.03.037
Duan, H., Mo, J., Fan, Y., and Wang, S. (2018). Achieving China's Energy and Climate Policy Targets in 2030 under Multiple Uncertainties. Energ. Econ. 70, 45–60. doi:10.1016/j.eneco.2017.12.022
Fan, J.-L., Wang, J.-X., Li, F., Yu, H., and Zhang, X. (2017). Energy Demand and Greenhouse Gas Emissions of Urban Passenger Transport in the Internet Era: A Case Study of Beijing. J. Clean. Prod. 165, 177–189. doi:10.1016/j.jclepro.2017.07.106
Fang, K., Tang, Y., Zhang, Q., Song, J., Wen, Q., Sun, H., et al. (2019). Will China Peak its Energy-Related Carbon Emissions by 2030? Lessons from 30 Chinese Provinces. Appl. Energ. 255, 113852. doi:10.1016/j.apenergy.2019.113852
Fragkos, P., and Kouvaritakis, N. (2018). Model-based Analysis of Intended Nationally Determined Contributions and 2 °C Pathways for Major Economies. Energy 160, 965–978. doi:10.1016/j.energy.2018.07.030
Gambhir, A., Tse, L. K. C., Tong, D., and Martinez-Botas, R. (2015). Reducing China's Road Transport Sector CO2 Emissions to 2050: Technologies, Costs and Decomposition Analysis. Appl. Energ. 157, 905–917. doi:10.1016/j.apenergy.2015.01.018
IEA (2021). International Energy Agency. Available at: https://www.iea.org/data-and-statistics/data-browser?country=CHINAREG&fuel=CO2%20emissions&indicator=TotCO2 (Accessed June 21, 2021).
IPCC (2006). IPCC Guidelines for National Greenhouse Gas Inventories. Available at: https://www.ipcc-nggip.iges.or.jp/public/2006gl/index.html (Accessed May 11, 2021).
Li, D., Huang, G., Zhu, S., Chen, L., and Wang, J. (2021). How to Peak Carbon Emissions of Provincial Construction Industry? Scenario Analysis of Jiangsu Province. Renew. Sust. Energ. Rev. 144, 110953. doi:10.1016/j.rser.2021.110953
Li, X., and Yu, B. (2019). Peaking CO2 Emissions for China's Urban Passenger Transport Sector. Energy Policy 133, 110913. doi:10.1016/j.enpol.2019.110913
Li, Y., Wei, Y., Zhang, X., and Tao, Y. (2020). Regional and Provincial CO2 Emission Reduction Task Decomposition of China's 2030 Carbon Emission Peak Based on the Efficiency, Equity and Synthesizing Principles. Struct. Change Econ. Dyn. 53, 237–256. doi:10.1016/j.strueco.2020.02.007
Liu, D., and Xiao, B. (2018). Can China Achieve its Carbon Emission Peaking? A Scenario Analysis Based on STIRPAT and System Dynamics Model. Ecol. Indicators 93, 647–657. doi:10.1016/j.ecolind.2018.05.049
Liu, J., Sun, Y., Wang, K., Zou, J., and Kong, Y. (2018). Research on Medium and Long-Term Low-Carbon Development Path of China's Transportation Sector. Res. Prog. Clim. Chang. 14 (05), 513–521. doi:10.12006/j.issn.1673-1719.2018.052
Liu, J., Yin, M., Xia-Hou, Q., Wang, K., and Zou, J. (2021). Comparison of Sectoral Low-Carbon Transition Pathways in China under the Nationally Determined Contribution and 2 °C Targets. Renew. Sust. Energ. Rev. 149, 111336. doi:10.1016/j.rser.2021.111336
Liu, L., Wang, K., Wang, S., Zhang, R., and Tang, X. (2018). Assessing Energy Consumption, CO2 and Pollutant Emissions and Health Benefits from China's Transport Sector through 2050. Energy Policy 116, 382–396. doi:10.1016/j.enpol.2018.02.019
Lu, C., Li, W., and Gao, S. (2020). Driving Determinants and Prospective Prediction Simulations on Carbon Emissions Peak for China's Heavy Chemical Industry. J. Clean. Prod. 251, 119642. doi:10.1016/j.jclepro.2019.119642
Mi, Z., Wei, Y.-M., Wang, B., Meng, J., Liu, Z., Shan, Y., et al. (2017). Socioeconomic Impact Assessment of China's CO2 Emissions Peak Prior to 2030. J. Clean. Prod. 142 (142), 2227–2236. doi:10.1016/j.jclepro.2016.11.055
Pan, X., Elzen, M. d., Höhne, N., Teng, F., and Wang, L. (2017). Exploring Fair and Ambitious Mitigation Contributions under the Paris Agreement Goals. Environ. Sci. Pol. 74, 49–56. doi:10.1016/j.envsci.2017.04.020
Pan, X., Wang, H., Wang, L., and Chen, W. (2018). Decarbonization of China's Transportation Sector: In Light of National Mitigation toward the Paris Agreement Goals. Energy 155, 853–864. doi:10.1016/j.energy.2018.04.144
Sun, H., Edziah, B. K., Kporsu, A. K., Sarkodie, S. A., and Taghizadeh-Hesary, F. (2021). Energy Efficiency: The Role of Technological Innovation and Knowledge Spillover. Technol. Forecast. Soc. Change 167, 120659. doi:10.1016/j.techfore.2021.120659
Sun, H., Hu, L., Geng, Y., and Yang, G. (2020a). Uncovering Impact Factors of Carbon Emissions from Transportation Sector: Evidence from China's Yangtze River Delta Area. Mitig Adapt Strateg. Glob. Change 25, 1423–1437. doi:10.1007/s11027-020-09934-1
Sun, H., Samuel, C. A., Kofi Amissah, J. C., Taghizadeh-Hesary, F., and Mensah, I. A. (2020b). Non-linear Nexus between CO2 Emissions and Economic Growth: A Comparison of OECD and B&R Countries. Energy 212, 118637. doi:10.1016/j.energy.2020.118637
Tang, B., Li, R., Yu, B., An, R., and Wei, Y.-M. (2018). How to Peak Carbon Emissions in China's Power Sector: A Regional Perspective. Energy Policy 120, 365–381. doi:10.1016/j.enpol.2018.04.067
Tapio, P. (2005). Towards a Theory of Decoupling: Degrees of Decoupling in the EU and the Case of Road Traffic in Finland between 1970 and 2001. Transport Policy 12 (2), 137–151. doi:10.1016/j.tranpol.2005.01.001
Wang, D., He, W., and Shi, R. (2019). How to Achieve the Dual-Control Targets of China's CO2 Emission Reduction in 2030? Future Trends and Prospective Decomposition. J. Clean. Prod. 213, 1251–1263. doi:10.1016/j.jclepro.2018.12.178
Wang, D., Liu, X., Yang, X., Zhang, Z., Wen, X., and Zhao, Y. (2021). China's Energy Transition Policy Expectation and its CO2 Emission Reduction Effect Assessment. Front. Energ. Res. 8, 627096. doi:10.3389/fenrg.2020.627096
Wang, H., and He, J. (2018). Peaking Rule of CO2 Emissions, Energy Consumption and Transport Volume in Transportation Sector. China Popul. Resour. Environ. 28 (2), 59–65. doi:10.12062/cpre.20171001
Wang, Z., Huang, W., and Chen, Z. (2019). The Peak of CO2 Emissions in China: A New Approach Using Survival Models. Energ. Econ. 81, 1099–1108. doi:10.1016/j.eneco.2019.05.027
Weng, Z., Ma, Z., Ge, C., Cai, S., Chen, C., and Chun, D. (2019). Projection on Energy Demand and Carbon Emission in Various Economic Developing Pathways——A case study in Hebei province. China Environ. Sci. 39 (8), 3508–3517. doi:10.19674/j.cnki.issn1000-6923.2019.0417
Wu, Y., Zhu, Q., Zhong, L., and Zhang, T. (2019). Energy consumption in the transportation sectors in China and the United States: A longitudinal comparative study. Struct. Change Econ. Dyn. 51, 349–360. doi:10.1016/j.strueco.2018.12.003
Xu, H., Pan, X., Guo, S., and Lu, Y. (2021). Forecasting Chinese CO2 emission using a non-linear multi-agent intertemporal optimization model and scenario analysis. Energy 228, 120514. doi:10.1016/j.energy.2021.120514
Yang, L., Wang, Y., Lian, Y., and Han, S. (2020). Factors and scenario analysis of transport carbon dioxide emissions in rapidly-developing cities. Transportation Res. D: Transport Environ. 80, 102252. doi:10.1016/j.trd.2020.102252
Yu, J., Shao, C., Xue, C., and Hu, H. (2020). China's aircraft-related CO2 emissions: Decomposition analysis, decoupling status, and future trends. Energy Policy 138, 111215. doi:10.1016/j.enpol.2019.111215
Yu, S., Zheng, S., and Li, X. (2018). The achievement of the carbon emissions peak in China: The role of energy consumption structure optimization. Energ. Econ. 74, 693–707. doi:10.1016/j.eneco.2018.07.017
Zhang, G., and Su, Z. (2020). Decomposition of influencing factors and scenario prediction of transportation carbon emission in the Yellow River Basin. Manag. Rev. 32 (12), 283–294. doi:10.14120/j.cnki.cn11-5057/f.2020.12.022
Zhang, X., Chen, Y., Jiang, P., Liu, L., Xu, X., and Xu, Y. (2020). Sectoral peak CO2 emission measurements and a long-term alternative CO2 mitigation roadmap: A case study of Yunnan, China. J. Clean. Prod. 247, 119171. doi:10.1016/j.jclepro.2019.119171
Zhao, G., Yu, B., An, R., Wu, Y., and Zhao, Z. (2021). Energy system transformations and carbon emission mitigation for China to achieve global 2 °C climate target. J. Environ. Manage. 292, 112721. doi:10.1016/j.jenvman.2021.112721
Zhao, Y., Cao, Y., Shi, X., Li, H., Shi, Q., and Zhang, Z. (2020). How China's electricity generation sector can achieve its carbon intensity reduction targets? Sci. Total Environ. 706, 135689. doi:10.1016/j.scitotenv.2019.135689
Keywords: transportation industry, carbon emissions, Tapio decoupling, LMDI, peak quality, peak time
Citation: Wu Y, Zhou Y, Liu Y and Liu J (2022) A Race Between Economic Growth and Carbon Emissions: How Will the CO2 Emission Reach the Peak in Transportation Industry?. Front. Energy Res. 9:778757. doi: 10.3389/fenrg.2021.778757
Received: 17 September 2021; Accepted: 30 December 2021;
Published: 18 February 2022.
Edited by:
Jordi De La Hoz Casas, Universitat Politecnica de Catalunya, SpainReviewed by:
Yong Jun Baek, Tokyo Institute of Technology, JapanCopyright © 2022 Wu, Zhou, Liu and Liu. This is an open-access article distributed under the terms of the Creative Commons Attribution License (CC BY). The use, distribution or reproduction in other forums is permitted, provided the original author(s) and the copyright owner(s) are credited and that the original publication in this journal is cited, in accordance with accepted academic practice. No use, distribution or reproduction is permitted which does not comply with these terms.
*Correspondence: Ya Wu, am53eTIwMTJAMTI2LmNvbQ==
Disclaimer: All claims expressed in this article are solely those of the authors and do not necessarily represent those of their affiliated organizations, or those of the publisher, the editors and the reviewers. Any product that may be evaluated in this article or claim that may be made by its manufacturer is not guaranteed or endorsed by the publisher.
Research integrity at Frontiers
Learn more about the work of our research integrity team to safeguard the quality of each article we publish.