 Xiahui Che
 Minxing Jiang2
- 1School of Management Science and Engineering, Nanjing University of Information Science and Technology, Nanjing, China
- 2Business School, Nanjing University of Information Science and Technology, Nanjing, China
There are increasing concerns that energy poverty across nations is weakening the global efforts toward achieving Sustainable Development Goals (SDGs). A systematic assessment of energy poverty is, therefore, essential to track the spatiotemporal pattern of SDG 7 and monitor the global efforts in alleviating energy poverty. This article develops the first Multidimensional Energy Poverty Assessment Index (MEAI), incorporating energy availability, affordability, and efficiency applicable to quantify the spatiotemporal dynamics of energy poverty development at global, regional, and national scales. Our analyses indicate that the overall MEAI and indices in all dimensions decreased from 2001 to 2016 at a global level with energy affordability experiencing the highest decline. The MEAI at the national level declines within the same period, showing significant regional heterogeneity in terms of the sub-index. Energy efficiency in developed and less-developed regions is characterized by high carbon emissions and low energy modernization, respectively. The energy availability indices are lower in developed nations and in nations with abundant energy resources. Overall, our results highlight a sudden increase in MEAI for Central America in 2014 and a gradual decline in MEAI for East Asia during 2014–2016. A call for regional actions is critically needed to solve energy poverty from different facets.
Introduction
Energy poverty has received growing attention worldwide in both academic communities and political agendas in recent years. The United Nation’s Sustainable Development Goal 7 (SDG 7) refers specifically to energy poverty and aims to achieve universal access to affordable, reliable, sustainable, and modern energy services by 2030. However, there is no internationally consistent definition of energy poverty. It is usually considered a situation where households are unable to adequately meet their energy needs at an affordable cost (Dobbins et al., 2019),thus thwarting efforts to achieve Sustainable Development Goals (SDGs). A lack of access to modern energy causes severe health problems, including cardiovascular, cerebrovascular, and respiratory disorders (SDG 3: Good Health and Well-Being), blunts future generation’s opportunity to reach satisfactory lifestyles (SDG 10: Reduced Inequalities), results in global deforestation and climate change (SDG 13: Climate Action), and affects many of the SDGs (Chapman et al., 2019). To fight energy poverty with sound policies and measures, a systematic and comprehensive assessment of energy poverty is of necessity for human sustainability.
Energy poverty is considered a multidimensional concept, including socioeconomic challenges, environment climate concerns, and so on. Multidimensional energy poverty measurement attempts to capture various dimensions and results of energy poverty and has become the prevailing method of assessing energy poverty. Jayasinghe et al. (2021) examine the incidence, intensity, inequality, and determinants of energy poverty in Sri Lanka by constructing the Multidimensional Energy Poverty Index (MEPI). Gafa and Egbendewe (2021) proposed a new multidimensional measure to evaluate the levels and determinants of energy poverty in rural West Africa. Halkos and Gkampoura (2021) examined energy poverty for 28 selected European countries, using a composite measurement. We found that previous studies are limited to a particular country or region, and rarely studies are found to assess global energy poverty by using multidimensional energy poverty measurement. The study by Che et al. (2021) is an attempt to assess global energy poverty with an integrated approach. However, the score for a sample country is relative closeness that is better suited to national ranking and the calculation process of this integrated approach is complicated.
Hence, based on the study by Che et al. (2021), we construct a Multidimensional Energy Poverty Assessment Index (MEAI) that not only reflects the reality of energy poverty but also is relatively simple to calculate. The MEAI takes into a set of multiple dimensions to represent the overall performance toward alleviating energy poverty. It is an aggregate index with fixed weights for sub-dimensions/indicators by their importance. With such a universal index, it makes the comparison of energy poverty possible at the national level (Xu et al., 2020).
Methodology
Indicator Selection and Data Sources
To get a full picture of energy poverty at national, regional, and global levels, the MEAI is designed and composed of three dimensions: energy availability, energy affordability, and energy efficiency, as shown in Table 1. Households lack access to modern energy due to unreliable energy supply, inadequate energy infrastructure, and tenure status or structural fabric of the building (Bouzarovski and Petrova, 2015). Low incomes keep households from affording basic levels of energy needed to attain a socially and materially necessitated level of energy services (Buzar, 2007). In addition, the inefficient use of an appliance contributes to indoor air pollution, and the combustion process of solid energy exacerbates climate change (Casillas and Kammen, 2010; Liu et al., 2016).
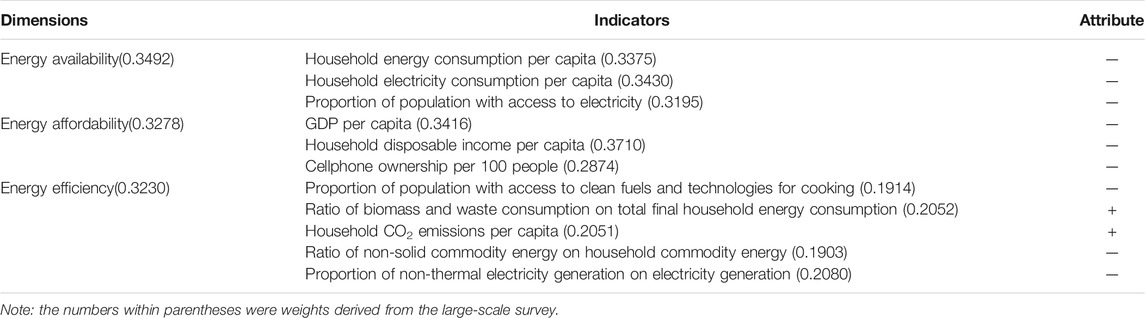
TABLE 1. Indicators selected for each of the dimensions.
For each dimension, we chose as many corresponding indicators as deemed feasible from previous studies, based on data availability at the national, regional, and global levels and temporal scales. 1) Energy availability refers to a lack of access to modern energy. Household energy consumption per capita was used to measure the energy consumption. For household energy consumption, electricity is found superior to other energies because it is more efficient and could serve all energy-end uses. Therefore, household electricity consumption per capita was used to describe the access to modern clean fuels. Adequate energy supply is a precondition to access energy services. As a result, the proportion of population with access to electricity was selected as an indicator for the reliability of energy supply. 2) Energy affordability means that the energy cost is too high for householders to pay. According to the energy ladder hypothesis, GDP per capita and household disposable income per capita were used to measure the burden of energy costs. The number of household appliances reflected a household’s ability to pay for modern energy and efficient equipment. Communication equipment played a key role in social life, and cellphone ownership per 100 people, therefore, was taken into account. 3) Energy efficiency considers the quality of household energy consumption from low-carbon development and modernization of energy consumption structure. The proportion of population with access to clean fuels and technologies for cooking and ratio of biomass and waste consumption on total final household energy consumption was used to explain the modernization of energy consumption structures. Household CO2 emissions per capita, ratio of non-solid commodity energy to household commodity energy, and the proportion of non-thermal power generation on electricity generation were used to evaluate low-carbon development.
Data for “household energy consumption” were obtained from the following authoritative sources: the World Energy Balances, the Energy Balances of OECD Countries, and the Energy Balances of Non-OECD Countries. Data for “household CO2 emissions” were from the CO2 Emissions from Fuel Combustion. Data for “proportion of population with access to electricity,” “gross domestic product” (GDP),” “household final consumption expenditure,” “cellphone ownership per 100 people,” “proportion of population with access to clean fuels and technologies for cooking,” “proportion of non-thermal electricity generation on electricity generation,” and “national population” were from the World Bank Open Data. GDP and “household final consumption expenditure” were adjusted with purchasing power parity (PPP) dollars in 2011 to remove the effect of exchange rate volatility and inflation.
Normalization of Indicator Values
The indicator values for each dimension were normalized in order to ensure comparability across dimensions. Traditional normalized approaches used annual values for the mean and standard deviation of each indicator as the criterion of normalization, which varied over time. The normalized indicator values were incomparable across time scales, and the MEAI only reflected the spatial distribution of energy poverty. However, the fixed base difference method chose the values of benchmark year indicators as the unified criterion of the annual values for 2001–2016 for the selected indicator metrics of each dimension, which objectively reflected the spatiotemporal dynamics of progress toward alleviating energy poverty at the global, regional, and national levels.
We converted negative indicators into positive indicators by using the equation
where
Weight of Indicator
The weights of indicators had a significant impact on the MEAI. Our study period was 16 years. The indicator weights were differentiated annually by using the objective weighting approaches, which were not suitable to conduct dynamic research. Hence, we weighted all dimensions and indicators within each dimension, respectively, by using a large-scale survey. Corresponding scores were based on the Likert scale, where (4,5]—very important; (3,4]—important; (2,3]—fair; (1,2]—unimportant; and (0,1]—very unimportant.
The survey began in August 2019 and lasted for 2 months. Thousand questionnaires were sent out by E-mail all over the world, and 581 valid questionnaires were collected. In the valid sample, the respondents were from China, the United States, the United Kingdom, and other countries, respectively. Authoritative experts, such as Yin Jinyue (KTH Royal Institute of Technology) and Wang Zhaohua (Beijing Institute of Technology), accounted for 4.0%; teachers and researchers from internationally renowned universities, such as the Chinese Academy of Sciences and the National University of Singapore, accounted for 51.1%; and Master’s and doctoral students accounted for 32.5%. Most of the respondents were familiar with energy poverty and could score the indicators objectively. Hence, the weights of the indicators were convincing.
According to the theory of random error, the extreme scores had negative impacts on the reliability of the results. The Pauta Criterion (3δ) was used to remove extreme scores in order to minimize the potential effects of skewed data distribution on the weights of indicators. According to the actual calculation results, K was defined as 2.
where
Calculation of the Multidimensional Energy Poverty Assessment Index and Individual Dimension Index Over Time
We calculated the MEAI at the global, regional, and national levels by using arithmetic means. The MEAI was an aggregate index that consisted of individual indices for all three dimensions and represented global, regional, or national overall progress in alleviating all dimensions over time. The individual dimension index was yielded by multiplying the indicator values within each dimension with the assigned weights.
where
We aggregated all three dimensions into one global/regional/national MEAI for each year from 2001 to 2016, which was defined as follows:
where Z was what the study called the MEAI ,and
Results and Discussions
Characteristics of Global Energy Poverty
We compiled annual time series data relevant to energy poverty from 2001 to 2016 for 125 countries. In total, 11 indicators were used in this assessment. These indicators allow us to calculate the three dimensions of energy poverty (including energy availability, energy affordability, and energy efficiency) and the MEAI at global, regional, and national levels. Figure 1 shows that the MEAI at the global level decreased gradually over time, which was mainly attributed to the improvement of the energy affordability. The global MEAI decreased by approximately 27.4% from 55.3 in 2001 to 43.4 in 2016. Specifically, we found a clear distinction before and after the year 2008. The average annual decrease rate of the global MEAI after 2008 was 1.13% compared to that of 1.71% before 2008. This reveals that although global energy poverty was alleviated gradually, the financial crisis in 2008 may have had a permanent and negative impact on energy poverty alleviation. This may be because that the crisis increases unemployment and reduces household disposable income.
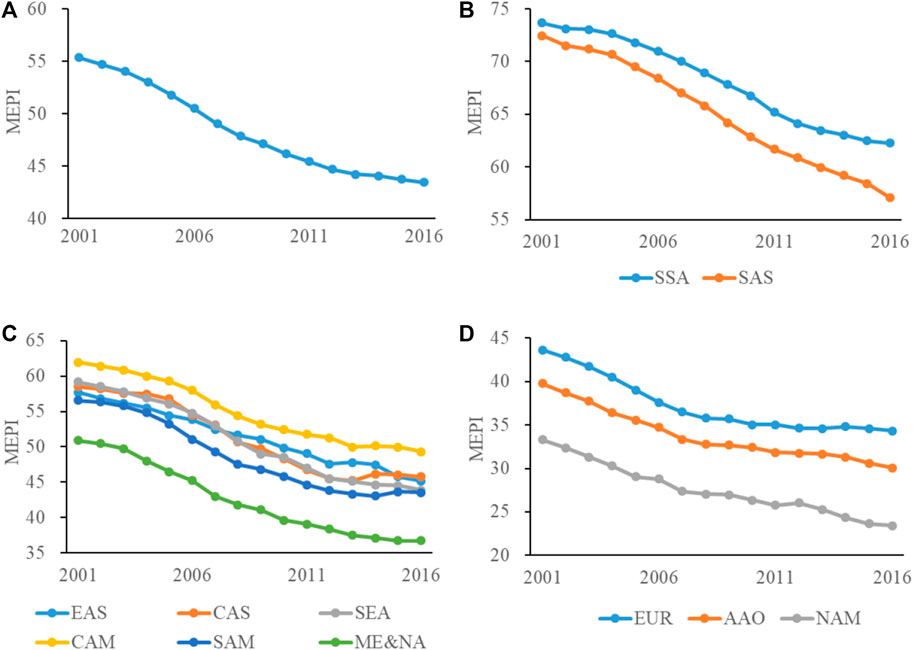
FIGURE 1. Change in the MEAI from 2001 to 2016. (A) At the global level. (B–D) At the regional level. North America is the abbreviation for NAM, Central America for CAM, South America for SAM, Middle East and North Africa for ME&NA, sub-Saharan Africa for SSA, Europe for EUR, Central Asia for CAS, East Asia for EAS, Southeast Asia for SEA, South Asia for SAS, and Australia and Oceania for AAO.
Figure 1 also presents the changes in the MEAI from 2001 to 2016 at the regional level. The mean value of the MEAI at the regional level declined by 22.3% between 2001 and 2016. In 2001, the MEAI ranged from 33.3 to 73.7 with a mean value of 55.2. The mean value decreased to 42.9 from 2016. East Asia’s MEAI experienced a continuous decline with that of China as the largest contributor in this region. China reached full electrification in 2015, which has a significant effect in reducing the MEAI in East Asia. It is worth noticing that the MEAI in Central America suddenly increased by 2.08% from 45.2 in 2013 to 46.2 in 2014, respectively, suggesting that substantial changes in alleviating energy poverty occurred across different regions.
The mean value of the MEAI for all 125 nations is 48.5, as we can see from Figure 2. The national average MEAI of 66 countries is higher than the mean (48.5), accounting for 52.8% of our sample (Figure 2). The world is still suffering from energy poverty and, over time, all nations decreased their MEAI from 2001 to 2016 with significant spatial heterogeneity, ranging from 15.1 in Norway to 77.9 in Congo (10).
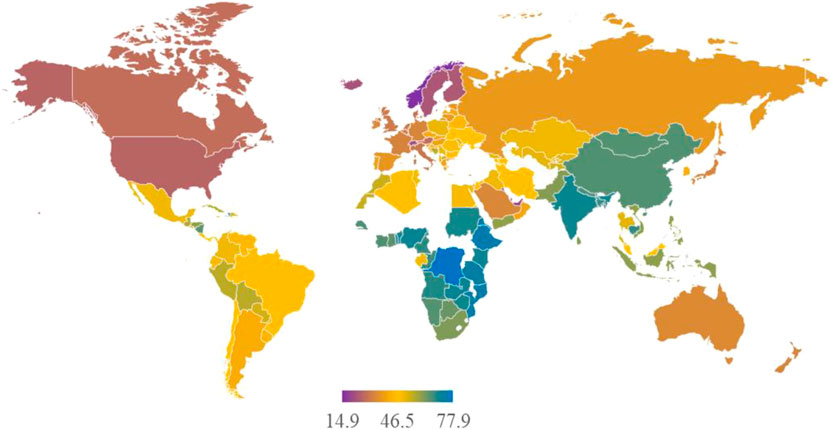
FIGURE 2. Average MEAI between 2001 and 2016 for 125 global nations.
Figure 3 illustrates the changes in dimension indices: energy availability, energy affordability, and energy efficiency. At the global level, all dimension indices decreased over time. Energy availability and energy affordability were the key drivers for the MEAI. The three dimensions, in order of the greatest to least decline, were energy affordability, energy availability, and energy efficiency, and the decline in energy affordability was substantially higher than the others. At the regional level, the changes in energy availability from 2001 to 2016 were greater than zero for North America, Europe, and Australia and Oceania, and the change in energy efficiency was also greater than zero for Central Asia, implying a deterioration in energy availability and energy efficiency in these regions. The most obvious indicator responsible for such deterioration in North America, Europe, and Australia and Oceania is “household energy consumption per capita” (Sovacool and Brown, 2012; Thomson and Snell, 2013). Generally, the changes in dimension indices at the national level showed similar dynamics as those at the global and regional levels.
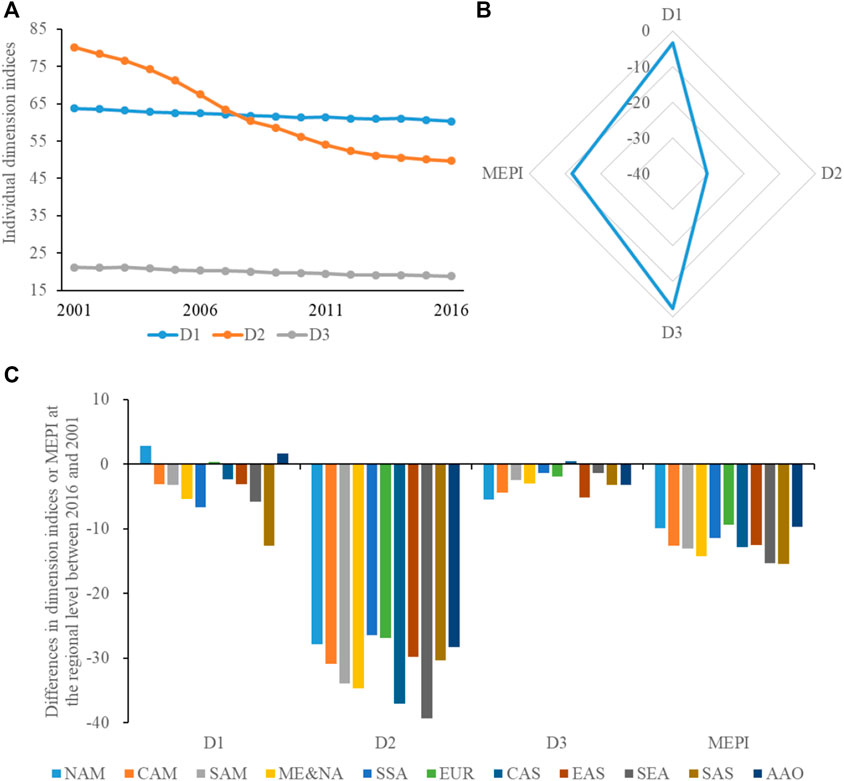
FIGURE 3. Change in dimension indices or the MEAI. (A) Changes in dimension indices from 2001 to 2016 at the global level. (B) Differences in dimension indices between 2016 and 2001 at the global level. (C) Differences in dimension indices and the MEAI between 2016 and 2001 at the regional level. D1 is the abbreviation for energy availability, D2 for energy affordability, and D3 for energy efficiency. A positive value indicates an increase in the index from 2001 to 2016, whereas a negative value indicates a decrease in the index from 2001 to 2016.
Mechanisms for Energy Poverty
The spatiotemporal patterns of the MEAI are the combined outcome of a number of factors, including domestic energy conditions, income level, and policy implementation. In the following section, we provide key insights on the three dimensions of the MEAI at global, regional, and national levels.
Energy availability is defined by the International Energy Agency as a lack of access to modern energy. A lower value for the energy availability index shows its contribution to the alleviation of energy poverty. At the national level, 32 of the top 40 nations, in order of the least to greatest increase for energy availability, belong to developed nations. The remaining eight nations were high-/upper-/ middle–income nations with abundant natural resources such as Kuwait, Bahrain, the United Arab Emirates, Qatar, Russia, Iran, Saudi Arabia, and Brunei. The bottom 40 nations were low-/lower- middle-income nations in Central America, South Asia, and sub-Saharan Africa. The top 40 nations have established perfect infrastructures of energy service to improve household’s energy consumption levels and have gained an overall access to modern energy (Bednar and Reames, 2020). In contrary, the bottom 40 nations lack the access to adequate amounts of modern energy and rely mainly on traditional cooking fuels due to unfavorable conditions, including high energy prices, energy shortages, and inadequate energy infrastructure (Mendoza et al., 2019). At the regional level, the improvement on “household electricity consumption per capita” and “household energy consumption per capita” will have significant and positive impacts on reducing the energy availability index (see the Figure 4).
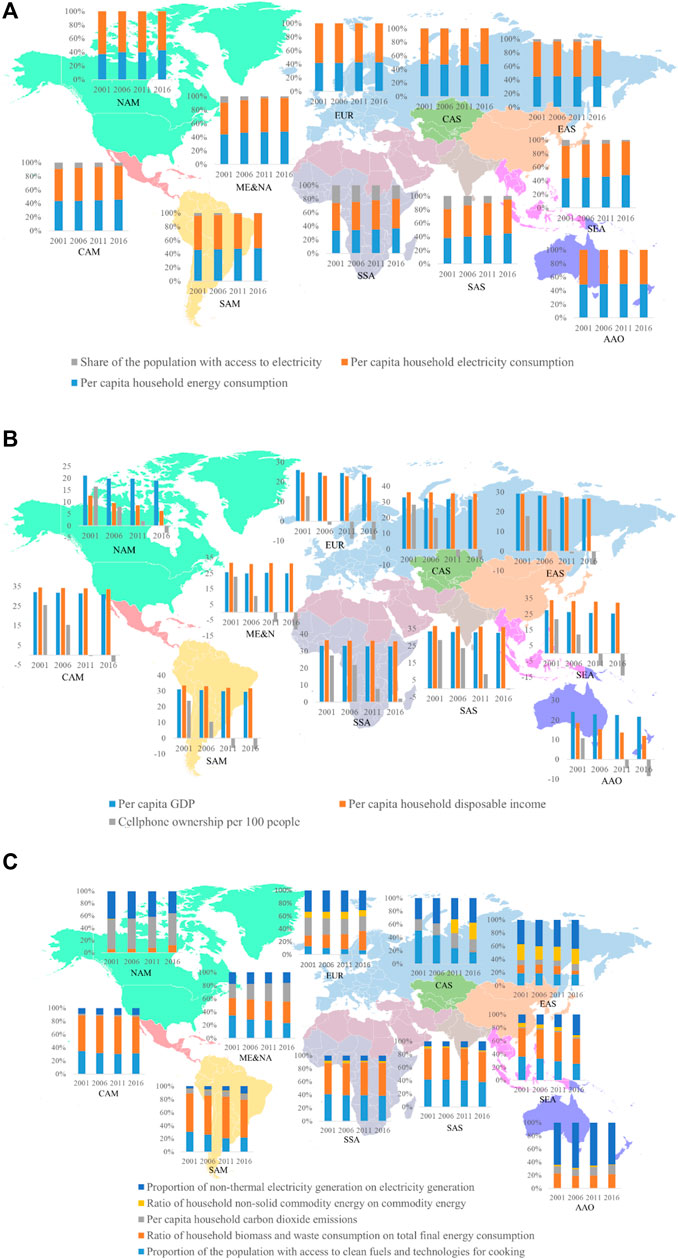
FIGURE 4. Structure of dimension indices at the regional level in 2001, 2006, 2011, and 2016. (A) D1 (energy availability). (B) D2 (energy affordability). (C) D3 (energy efficiency).
The energy affordability index shows to what extent households cannot afford basic levels of energy needed to attain a socially and materially necessitated level of energy services (González-Eguino, 2015). A higher value of energy affordability indicates increased difficulty in affording basic energy needs. The average index of energy affordability among nations between 2001 and 2016 ranged from −1.4 in Kuwait to 97.8 in Congo, with large variations across nations. One of the indicators for energy affordability is “cellphone ownership per 100 people,” which reflects the situation of modern energy consumption and household appliance utilization (Nussbaumer et al., 2012). It has a significant positive influence on reducing the index of energy affordability, as households tend to spend more money on the modern energy consumption and efficient household appliance utilization with the increase in income. We find the change in the index values for “cellphone ownership per 100 people” among regions from 2001 to 2016 ranging from a 1.79 % decrease (Australia and Oceania) to a 93.1% decrease (sub-Saharan Africa), which plays a significant role in energy affordability improvement compared to the survey conducted in 2001 (Figure 4).
A higher energy efficiency level has a positive effect on reducing the final energy consumption, whereas a lower energy efficiency level poses challenges to alleviate energy poverty for all nations (Bonatz et al., 2019). In this study, energy efficiency is divided into two categories: low-carbon development and energy modernization. Low-carbon development measured by “household CO2 emissions per capita” represent low-carbon development, “ratio of non-solid commodity energy on household commodity energy,” and “proportion of non-thermal electricity generation on electricity generation.” The three indicators account for over 60% of the index values of energy efficiency in North America, Europe, and Australia and Oceania. This implies that the energy efficiency issue in the three regions is related more to carbon emissions than modernization (see Figure 4). The three regions are dominated by developed nations. Although these nations have reached an overall access to energy services, they still heavily depend on traditional fossil fuels to meet household energy consumption demand and lack access to adequate amounts of modern energy. In contrary, two indicators including “proportion of population with access to clean fuels and technologies for cooking” and “ratio of biomass and waste consumption on total final household energy consumption,” contribute to more than 55% of the energy efficiency index value in Central America, South America, Middle East, North Africa, sub-Saharan Africa, Southeast Asia, and South Asia. Therefore, energy efficiency in these six regions concerns more on modernization (Figure 4). A large number of less-developed nations are clustered in the six regions, for which it is the priority to meet household basic energy requirements without considering the energy consumption structure. In East Asia, two categories of indicators, low-carbon development and energy modernization, play equal roles in constituting the energy efficiency index, implying that both carbon emissions and energy modernization are equally important for this region (Figure 4). This is because most nations (except Korea, Republic of China, and Japan) in East Asia are less-developed nations, and households mainly rely on energy-intensive and inefficient appliances to meet their basic energy requirements, which have a negative effect on energy modernization. Meanwhile, coal is abundant in this region, and thus final energy consumption is dominated by coal. Reducing the carbon emissions is a great challenge in this region, which is affecting the overall MEAI.
Although our results show that energy poverty has been alleviated to a large extent, evidenced by the reduction in the MEAI at global, regional, and national levels in general, the major driver for such improvement is attributed to energy affordability as the results of fast economic growth and international cooperation. The dimensional sub-index provides additional information for further action. From the perspective of energy availability, energy shortage and inadequate energy infrastructure hold back improvements on global energy consumption (Sovacool, 2012). The expansion of renewable energy technologies and the related distribution options, such as small-scale photovoltaics, diesel generators, and improved cooking stoves, provide a chance to improve the access to modern energy for rural households (Yan et al., 2019). From an energy-efficient perspective, high-carbon emissions, and low-energy modernization have made energy poverty difficult to alleviate (Cameron et al., 2016). Burning solid fuels such as dung, firewood, and coal in traditional stoves for heating and cooking contributes to global deforestation and climate change. Improving energy efficiency helps to enforce sustainable energy development, speed up the exploration of efficient household appliances, and mitigate climate change. National policymakers could consider strategies to improve energy efficiency in sub-Saharan African and South Asian nations in order to narrow the energy poverty gap between developed regions and less-developed regions.
Sensitivity analysis
We considered three scenarios to assess the sensitivity of national ranks to changes in weights of indicators in 2001. Equal weights were assigned to relative indicators, respectively, (Nussbaumer et al., 2012) and the other weights were kept constant. Altogether three scenarios were presented in the study: Scenario 1 (the equal weights of indicators within energy availability), Scenario 2 (the equal weights of indicators within energy affordability), and Scenario 3 (the equal weights of indicators within energy efficiency). We recalculated the national ranks in 2001 in three scenarios, as shown in Table 2. The ranks of 11 countries changed in Scenario 1, the ranks of 29 countries changed in Scenario 2, and the ranks of 77 countries changed in Scenario 3. The results show that national ranks were relatively sensitive to changes in weights of indicators, and it is important to note that the weights to indicators should be cautiously assigned.
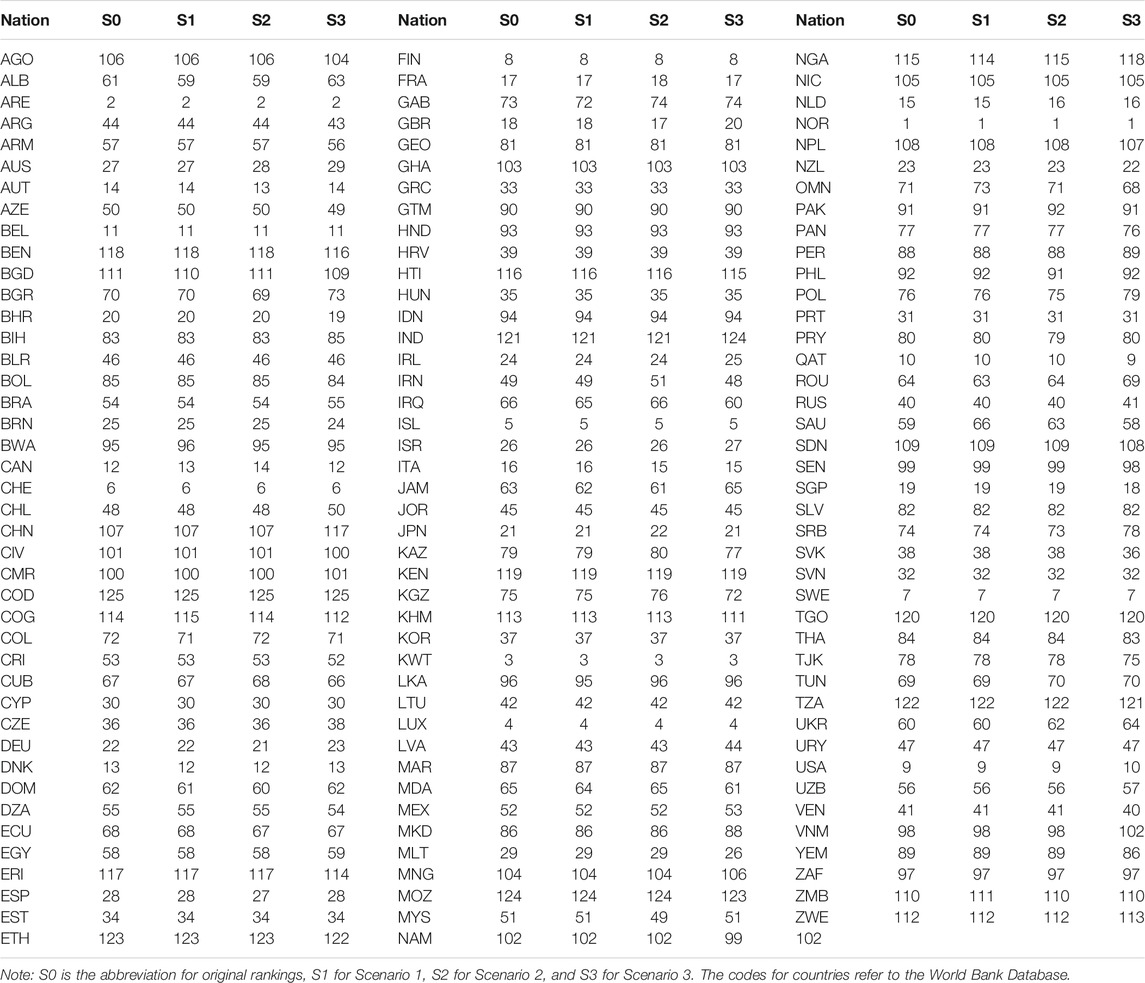
TABLE 2. Sensitivity of national ranks in 2001 in weights of indicators.
Conclusion
The empirical results indicate that the overall MEAI and indices in all dimensions decreased from 2001 to 2016 at a global level with energy affordability experiencing the highest decline. The MEAI at the national level declines within the same period, showing significant regional heterogeneity in terms of the sub-index. Energy efficiency in developed and less-developed regions is characterized by high-carbon emissions and low-energy modernization, respectively. The energy availability indices are lower in developed nations and in nations with abundant energy resources. Overall, our results highlight a sudden increase in the MEAI for Central America in 2014 and a gradual decline in MEAI for East Asia during 2014–2016.
Data availability is an important criterion for selecting the dimension indicators. The lack of available data hinders researchers exploring the spatiotemporal dynamics of progress toward alleviating energy poverty. This article constructed a unique micro-level dataset from national statistical departments and international databases, providing a solid basis for developing a set of standard indicators to better evaluate the progress toward energy poverty across space and time. Policymakers continuously track and monitor energy poverty by a periodical updating of the data.
This article developed a systematic and comprehensive evaluation method of SDG 7 at global, regional, and national levels. The method outlined in our article enables us to track the spatiotemporal pattern of SDG 7 and monitor national efforts toward energy poverty alleviation. It will not only help to guide policy development and implementation but also provide reference for the next action. One direction for further research is to include qualitative indicators obtained through a participatory survey method, to reflect household’s subjective feelings on energy poverty. An investigation of non-economic factors, such as educational level, cultural preferences, and dietary habits on household’s energy alternatives may be helpful to reveal the complex mechanisms and consequences of energy poverty alleviation. In addition, investigations on the trade-offs and synergies between SDG 7 and the other SDGs will enrich our path toward sustainability.
Data Availability Statement
The original contributions presented in the study are included in the article/Supplementary Material; further inquiries can be directed to the corresponding author.
Author Contributions
XC conducted all data compilation, processing, and calculations and wrote the first draft.
Conflict of Interest
The authors declare that the research was conducted in the absence of any commercial or financial relationships that could be construed as a potential conflict of interest.
Publisher’s Note
All claims expressed in this article are solely those of the authors and do not necessarily represent those of their affiliated organizations, or those of the publisher, the editors, and the reviewers. Any product that may be evaluated in this article, or claim that may be made by its manufacturer, is not guaranteed or endorsed by the publisher.
Acknowledgments
Our heartfelt thanks should be given to the National Natural Science Foundation of China (71903099), the General Foundation of Philosophy and Social Science Research in Colleges and Universities in Jiangsu Province (2019SJA0165), and the Natural Science Foundation of the Jiangsu Higher Education Institutions of China (19KJB610019) for funding supports.
References
Bednar, D. J., and Reames, T. G. (2020). Recognition of and Response to Energy Poverty in the United States. Nat. Energ. 5 (6), 432–439. doi:10.1038/s41560-020-0582-0
Bonatz, N., Guo, R., Wu, W., and Liu, L. (2019). A Comparative Study of the Interlinkages between Energy Poverty and Low Carbon Development in China and Germany by Developing an Energy Poverty index. Energy and Buildings 183, 817–831. doi:10.1016/j.enbuild.2018.09.042
Bouzarovski, S., and Petrova, S. (2015). A Global Perspective on Domestic Energy Deprivation: Overcoming the Energy Poverty-Fuel Poverty Binary. Energ. Res. Soc. Sci. 10, 31–40. doi:10.1016/j.erss.2015.06.007
Buzar, S. (2007). The ‘hidden' Geographies of Energy Poverty in post-socialism: Between Institutions and Households. Geoforum 38 (2), 224–240. doi:10.1016/j.geoforum.2006.02.007
Cameron, C., Pachauri, S., Rao, N. D., McCollum, D., Rogelj, J., and Riahi, K. (2016). Policy Trade-Offs between Climate Mitigation and Clean cook-stove Access in South Asia. Nat. Energ. 1 (1), 1–5. doi:10.1038/nenergy.2015.10
Casillas, C. E., and Kammen, D. M. (2010). The Energy-Poverty-Climate Nexus. Science 330 (6008), 1181–1182. doi:10.1126/science.1197412
Chapman, A., Fujii, H., and Managi, S. (2019). Multinational Life Satisfaction, Perceived Inequality and Energy Affordability. Nat. Sustain. 2 (6), 508–514. doi:10.1038/s41893-019-0303-5
Che, X., Zhu, B., and Wang, P. (2021). Assessing Global Energy Poverty: an Integrated Approach. Energy Policy 149, 112099. doi:10.1016/j.enpol.2020.112099
Dobbins, A., Fuso Nerini, F., Deane, P., and Pye, S. (2019). Strengthening the EU Response to Energy Poverty. Nat. Energ. 4 (1), 2–5. doi:10.1038/s41560-018-0316-8
Gafa, D. W., and Egbendewe, A. Y. G. (2021). Energy Poverty in Rural West Africa and its Determinants: Evidence from Senegal and Togo. Energy Policy 156, 112476. doi:10.1016/j.enpol.2021.112476
González-Eguino, M. (2015). Energy Poverty: An Overview. Renew. Sustain. Energ. Rev. 47, 377–385. doi:10.1016/j.rser.2015.03.013
Halkos, G. E., and Gkampoura, E.-C. (2021). Evaluating the Effect of Economic Crisis on Energy Poverty in Europe. Renew. Sust. Energ. Rev. 144, 110981. doi:10.1016/j.rser.2021.110981
Jayasinghe, M., Selvanathan, E. A., and Selvanathan, S. (2021). Energy Poverty in Sri Lanka. Energ. Econ. 101, 105450. doi:10.1016/j.eneco.2021.105450
Liu, J., Mauzerall, D. L., Chen, Q., Zhang, Q., Song, Y., Peng, W., et al. (2016). Air Pollutant Emissions from Chinese Households: A Major and Underappreciated Ambient Pollution Source. Proc. Natl. Acad. Sci. USA 113 (28), 7756–7761. doi:10.1073/pnas.1604537113
Mendoza, C. B., Cayonte, D. D. D., Leabres, M. S., and Manaligod, L. R. A. (2019). Understanding Multidimensional Energy Poverty in the Philippines. Energy Policy 133, 110886. doi:10.1016/j.enpol.2019.110886
Nussbaumer, P., Bazilian, M., and Modi, V. (2012). Measuring Energy Poverty: Focusing on what Matters. Renew. Sust. Energ. Rev. 16 (1), 231–243. doi:10.1016/j.rser.2011.07.150
Sovacool, B. K., and Brown, M. A. (2010). Competing Dimensions of Energy Security: an International Perspective. Annu. Rev. Environ. Resour. 35, 77–108. doi:10.1146/annurev-environ-042509-143035
Sovacool, B. K. (2012). Deploying Off-Grid Technology to Eradicate Energy Poverty. Science 338 (6103), 47–48. doi:10.1126/science.1222307
Thomson, H., and Snell, C. (2013). Quantifying the Prevalence of Fuel Poverty across the European Union. Energy Policy 52, 563–572. doi:10.1016/j.enpol.2012.10.009
Xu, Z., Chau, S. N., Chen, X., Zhang, J., Li, Y., Dietz, T., et al. (2020). Assessing Progress towards Sustainable Development over Space and Time. Nature 577 (7788), 74–78. doi:10.1038/s41586-021-03479-2
Keywords: energy poverty, multidimensional energy poverty assessment index (MEAI), energy availability, energy affordability, energy efficiency
Citation: Che X, Jiang M and Fan C (2021) Multidimensional Assessment and Alleviation of Global Energy Poverty Aligned With UN SDG 7. Front. Energy Res. 9:777244. doi: 10.3389/fenrg.2021.777244
Received: 15 September 2021; Accepted: 27 September 2021;
Published: 17 December 2021.
Edited by:
Yong-cong Yang, Guangdong University of Foreign Studies, ChinaReviewed by:
Di Zhou, Guangdong University of Foreign Studies, ChinaDong-xiao Yang, Hunan University of Technology and Business, China
Copyright © 2021 Che, Jiang and Fan. This is an open-access article distributed under the terms of the Creative Commons Attribution License (CC BY). The use, distribution or reproduction in other forums is permitted, provided the original author(s) and the copyright owner(s) are credited and that the original publication in this journal is cited, in accordance with accepted academic practice. No use, distribution or reproduction is permitted which does not comply with these terms.
*Correspondence: Xiahui Che, Y2hleGlhaHVpQHllYWgubmV0