
95% of researchers rate our articles as excellent or good
Learn more about the work of our research integrity team to safeguard the quality of each article we publish.
Find out more
ORIGINAL RESEARCH article
Front. Energy Res. , 10 December 2021
Sec. Bioenergy and Biofuels
Volume 9 - 2021 | https://doi.org/10.3389/fenrg.2021.773717
This article is part of the Research Topic Electricity-bioenergy Hybrids: Solutions for Improving the Resource Efficiency of Biomass Conversion View all 12 articles
A correction has been applied to this article in:
Corrigendum: A circular approach for making Fischer–Tropsch e-fuels and e-chemicals from biogas plants in Europe
In a mature circular economy model of carbon material, no fossil compound is extracted from the underground. Hence, the C1 molecule from non-fossil sources such as biogas, biomass, or carbon dioxide captured from the air represents the raw material to produce various value-added products through carbon capture and utilization routes. Accordingly, the present work investigates the utilization of the full potential of biogas and digestate waste streams derived from anaerobic digestion processes available at the European level to generate synthetic Fischer–Tropsch products focusing on the wax fraction. This study estimates a total amount of available carbon dioxide of 33.9 MtCO2/y from the two above-mentioned sources. Of this potential, 10.95 MtCO2/y is ready-to-use as separated CO2 from operating biogas-upgrading plants. Similarly, the total amount of ready-to-use wet digestate corresponds to 29.1 Mtdig/y. Moreover, the potential out-take of Fischer–Tropsch feedstock was evaluated based on process model results. Utilizing the full biogas plants’ carbon potential available in Europe, a total of 10.1 Mt/h of Fischer–Tropsch fuels and 3.86 Mt/h of Fischer–Tropsch waxes can be produced, covering up to 79% of the global wax demand. Utilizing only the streams derived from biomethane plants (installed in Europe), 136 ton/h of FT liquids and 48 ton/h of FT wax can be generated, corresponding to about 8% of the global wax demand. Finally, optimal locations for cost-effective Fischer–Tropsch wax production were also identified.
Carbon capture and utilization (CCU) routes allow converting waste CO2 and carbon compounds into marketable products (Pérez-Fortes et al., 2014). Within CCU, the paradigm of circularity of carbon material is currently being promoted as a forecasted solution to reduce fossil fuel consumption (Lehtonen et al., 2019). This applies especially in the European Union, where circularity becomes a prerequisite in achieving carbon neutrality and enhancing the penetration of renewable electricity in sectors other than the energy one (EC, 2020). This concept allows shifting from the business-as-usual linear production model to a self-sustained circular pattern where waste is upgraded to a commodity status. In the case of linear production, new resources are incessantly utilized for the manufacture of consumer goods. Concerning carbon-based materials, this means extracting fossil hydrocarbons from the ground for one-time use before turning them into wastes. This production model has been referred to as unsustainable from an economic, ecological, and social point of view, with extensive depletion of limited resources (Korhonen et al., 2018). Contrariwise, the circular economy promotes the reuse of carbon material, turning a waste stream into a resource with market potential for producing higher value-added products (Song et al., 2020). In a fully established circularity of carbon material, it is paramount that the C1 molecule comes from biomass, biogas, or directly capturing CO2 from the air (Sutter et al., 2019). For this to happen, a period of carbon transition where fossil hydrocarbons are subsequently substituted by renewable hydrocarbon is vital (IEA, 2020).
Among the several products that can be synthesized through CCU, Fischer–Tropsch (FT) liquid fuels and paraffin waxes are one. As such, the FT technology allows for the parallel production of fuels such as naphtha and middle distillates destined to the transport sector and wax chemicals employed in the chemical sector (Krylova, 2014). The latter compounds are employed as platform chemicals to manufacture several consumer products such as candles, additives, adhesives, and coatings (Wei, 2012; Bekker et al., 2013). Data on the exact demand for paraffin waxes worldwide are scarce. Nevertheless, considering the need for waxes, Suaria et al. (2018) reported a global production in 2018 of 4.79 million tons, with a market value of 6.7 billion $. Similarly, a rise in the global paraffin wax market was forecasted from 5.1 billion € in 2018 to 7.4 billion € in 2025, with the wax price ranging from 0.5 to 2.5 €/kg depending on the carbon number (Grand View Research 1, 2019). Currently, there is no global production of waxes coming from CO2 at the commercial level. In this regard, one of the biggest wax suppliers is Sasol. This South African chemical company manufactures Fischer–Tropsch paraffin waxes from coal gasification with a market coverage of 252 kton of waxes every quarter year (Sasol, 2018). Hence, the potential for non-fossil carbon uptake into FT paraffin wax is quite relevant for CCU routes. Lastly, when the production of CCU and FT fuels and chemicals is done exploiting electricity of renewable source, e-fuels and e-chemicals are provided, with the storage of electricity in chemical forms to penetrate different industrial sectors (Hombach et al., 2019; Marchese et al., 2021a) (also called solar-products when the only energy input comes from solar power (Rahbari et al., 2019)). E-fuels (also called electrofuels) are synthetic fuels, resulting from the combination of green hydrogen produced by electrolysis of water with renewable electricity and CO2. E-chemicals are chemical products originated from the same sources (water, renewable electricity, and CO2). Both the streams, because of the origin, are carbon-neutral products.
Moreover, as reported by the European Biogas Association (2020) and the International Energy Agency (2020), the total number of biogas plants installed in Europe corresponded to 18,966 in 2019. Additionally, a rising trend in biogas-upgrading plant installations to separate biomethane from carbon dioxide (187 plants in 2011, 742 plants in 2019) is reported, resulting in a rise of CO2 emissions toward the environment. In this regard, CCU applications can benefit from the surge in available ready-to-use CO2 derived from the upgrading processes. Similarly, the AD process generates a by-product known as digestate, rich in stabilized carbon in different concentrations depending on the input substrate. Generally, such a material is sent to landfill disposal or is utilized as a fertilizer for agricultural applications (Corden et al., 2019). However, using digestate as carbon feedstock for CCU pathways favors carbon circularity and avoids land eutrophication (Antoniou et al., 2019). In this context, Rodin et al. (2020) stated that carbon dioxide coming from biogenic sources could be used as feedstock for large-scale production of alternatives to fossil hydrocarbons such as methane, methanol, and ethanol. Similarly, Cuéllar-Franca et al. (2019) suggested preferential routes and end-products destined to the transportation sector to effectively utilize carbon dioxide from either point sources (including biogas) or distributed sources. Sechi et al. (2021) investigated the potentiality of engaging the installed biogas capacity from wastewater treatment plants in Europe to generate electricity with fuel cell systems. However, to the best of the authors’ knowledge, the open literature does not investigate the potential demand coverage of paraffin waxes through non-fossil feedstocks. Likewise, no studies on the production of digestate and its latter upgrade to non-fossil products were reported.
The present work estimates the potential for the utilization of carbon dioxide and digestate feedstocks derived from the AD process to make Fischer–Tropsch compounds with market value. CO2 and digestate from either biogas or biomethane plants (where the latter are biogas plants with upgrading technologies already installed) are the carbon sources. Moreover, the present appraisal identifies locations throughout Europe where it is possible to synthesize Fischer–Tropsch waxes at a competitive price compared to traditional fossil route costs (upper boundary at 2.5 €/kgwax). As such, the analysis provides novel insights into the possibility of turning waste carbon streams into commercial assets and suggests preferential AD locations to produce paraffin waxes.
Following the Introduction, this paper includes a description of the anaerobic digestion process (with feedstock characteristics and biogas production costs) and biogas-upgrading technologies to separate biomethane from CO2 and leave digestate as a by-product. Moreover, Methodology analyzes the total biogas and biomethane plants and provides a description of plant layouts utilized as a reference for investigation. Results and Discussion gives techno-economic considerations about the several locations in Europe to generate FT fuels and chemicals, with sensitivities to the economic parameters. Lastly, Conclusion is provided.
Biogas is a gaseous compound mainly composed of CH4, CO2, and impurities in lower concentrations. Biogas can be produced from the anaerobic digestion of different types of waste biomass. According to the European Biogas Association (2020) and International Energy Agency (2020), three main biogas plant categories can be found:
- Biodigesters, where organic materials are decomposed thanks to bacteria (psychrophilic, mesophilic, or thermophilic depending on the fermentation temperature) in anaerobic tanks.
- Landfill gas, which is recovered (through a pipe extraction system equipped with a compressor) from landfill sites and is generated from the decomposition of municipal solid waste (MSW). Looking at future scenarios, landfill gas is expected to decrease over time thanks to the increasing rate of separated collection. MSW, in this scenario, can be converted into biogas by using dedicated biodigesters.
- Wastewater treatment plants (WWTPs) where biogas is produced from sludge, a by-product of the water treatment line (Gandiglio et al., 2017).
The as-produced biogas needs to undergo dehumidification and cleaning steps before exploitation, to remove condensation and harmful contaminants, with the purity level depending on the downstream technology chosen for biogas use.
Biogas from biodigester application can be further classified depending on the feedstock type (i.e., substrate) (European Biogas Association, 2020):
- Agricultural sub-products like animals’ manure, crops’ residues, straw, and similar biomasses.
- Energy crops are dedicated primary crops and are generally the only substrate that cannot be considered a waste.
- MSW, which can be treated in a biodigester if collected aside from the other household waste.
- Industrial waste, especially the ones from the food and beverage industry.
Among such feedstocks, the most diffused at the EU level are the agricultural biogas plants (more than 60% of the installed electrical capacity comes from agriculture), running on a mix of residues and animal manure. This category has the highest share in the EU and most single countries, except particular cases like Switzerland, where sewage biogas (from WWTPs) is predominant, or Norway, where the highest share comes from landfill applications.
Landfill gas is the second largest group, together with industrial wastes and WWTPs.
Energy crops are still highly diffuse as feedstock type in Europe: these plants were usually installed in the first decade of the 2000s, when high incentives were not linked with the feedstock typology. In Germany, for example, around 50% of feedstocks used for biogas production are crops, according to the European Biogas Association (2020). Currently available incentives mainly focus on the use of biowaste material as a source for bioproducts from biogas (electricity or biomethane).
Shifting from the current scenario to production potential, manure and crops’ residuals are still the higher share even in the overall potential analysis (International Energy Agency, 2020), followed by MSW and woody biomass, which are currently not fully exploited. The most significant potential is found to be in the Asia Pacific and North America (between 150 and 200 Mtoe), followed by Central and South America and Europe.
Differences are also available among the different feedstocks in terms of biogas production yield (efficiency of the biodigesters) and cost of the biogas produced (Table 1). Industrial waste, for example, has one of the highest biogas conversion yields but is currently economically competitive only in medium and large scale. The lowest biogas yield is the one of manure and sewage biogas, which anyway has a strong potential and can be economically feasible in the same sizes as industrial plants.

TABLE 1. Biogas production yield from different feedstocks and biogas production costs depending on the plant layout. Adapted from (International Energy Agency, 2020; Gandiglio and Lanzini, 2021).
Lastly, the International Energy Agency (IEA) pointed out that the sustainable potential for biogas in 2040 is 50% higher than available today, based on the increased availability of the various feedstocks in a larger global economy.
Within biogas applications, the separation of CO2 from CH4 using upgrading technologies is often employed for further injection of biomethane into the gas grid and carbon dioxide recovery. Table 2 lists the preferential capture technologies (and their mean capture efficiency (Teir et al., 2014; Huang et al., 2015; Riboldi and Bolland, 2015; Awe et al., 2017; Pellegrini et al., 2020)) utilized in the biomethane plants throughout Europe.
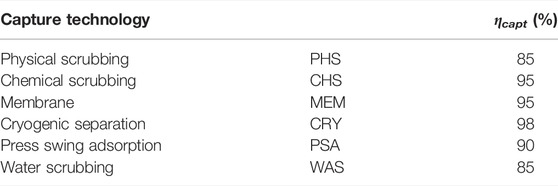
TABLE 2. Mean carbon dioxide capture efficiency value of upgrading technologies utilized for the biogas plants in Europe (Teir et al., 2014; Huang et al., 2015; Awe et al., 2017; Pellegrini et al., 2020; Riboldi and Bolland, 2015).
In this context, the total number of biomethane plants installed in Europe amounted to 742 at the end of 2019 (European Biogas Association, 2020). With respect to the share of capture technologies, membranes and water scrubbing represented the leading upgrading technologies, followed by chemical scrubbing, pressure swing adsorption, physical scrubbing, and cryogenic separation (Figure 1). Accounting for the different substrates, energy crops and agricultural wastes are the main ones utilized for the anaerobic digestion process (33 and 29% of the biomethane plants, respectively). Only 2% of the plants (i.e., 14 biomethane plants) utilize landfill as the preferential substrate.
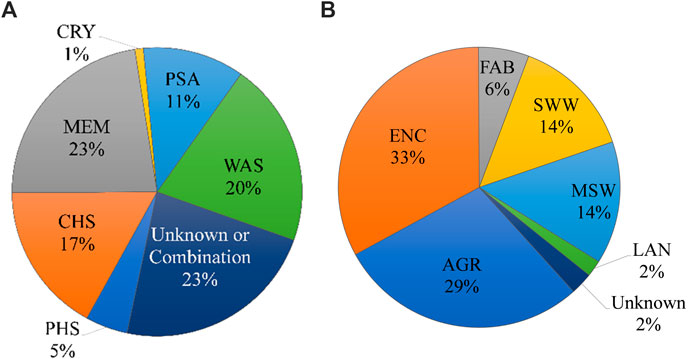
FIGURE 1. Share of capture technologies (A) and anaerobic digestion substrates (B) utilized in biomethane plants installed in Europe at the end of 2019 (European Biogas Association, 2020).
The data employed in this analysis were sourced from both the European Biogas Association (2020) and the International Energy Agency (2020) regarding the total installed biogas plants throughout Europe. Additionally, the data listed in the European Biomethane Map were considered for all the biomethane plants connected to the EU gas grid (European Biogas Association, 2020), where biomethane plants were considered biogas plants with an upgrading technology installed to separate CH4 and CO2. Consequently, the availability of carbon dioxide and digestate was accounted for.
Operating biogas plants in Europe were 6,227 in 2009, and the number increased to 18,966 in 2019 (Figure 2). Moreover, the installation of biogas-upgrading plants has constantly risen, from 187 in 2011 to 742 in 2019. Considering the different EU countries with operating plants as of 2019, Germany was the country with the highest number of biogas plants (11,084), followed by Italy (1,655), France (837), and the United Kingdom (715). Considering the existing biomethane plants (Figure 3), Germany was still the country with the highest number, followed by France, the United Kingdom, and Sweden. As seen from Figure 2, the installation of biogas plants is reaching a plateau condition. Contrariwise, there is a rising trend in the available ready-to-use carbon dioxide derived from upgrading the biogas streams into biomethane and CO2.
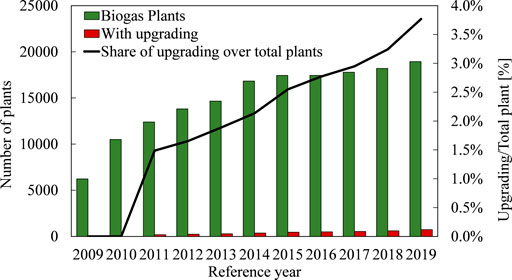
FIGURE 2. Installed biogas plants in European evolution. Adapted from (European Biogas Association, 2020; International Energy Agency, 2020).
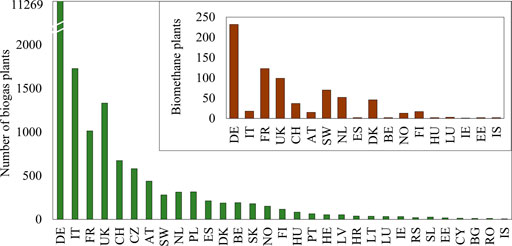
FIGURE 3. Biogas and biomethane plants installed in Europe at the end of 2019. Adapted from (European Biogas Association, 2020; International Energy Agency, 2020).
Additionally, the data available regarding biomethane plants (i.e., biogas plants with an upgrading unit, connected to the gas grid) presented by the European Biomethane Map (European Biogas Association, 2020) provide details about the type of substrate utilized in the anaerobic digestion process, the employed technology for carbon dioxide recovery, and the amount of biomethane supplied by each plant.
For biogas plants, the open literature provided clustered information on the total number of operating plants, the total biogas installed capacity (expressed in MWel), the total production of biomethane (GWh/y), and the average size of the plants (MWel) for each of the assessed European countries (European Biogas Association, 2020; Association EB, 2018). Consequently, the total amount of captured CO2 (ton/h) was evaluated for these plants according to Eqs 1, 2. The generated carbon dioxide from the eventual combustion of methane was omitted, assuming CH4 injection into the gas grid:
Here, Pbiog is the installed capacity of biogas in each country, ηel is the electric efficiency assumed to be 38% (EBA, 2020), the lower heating value of biogas was considered 20 MJ/m3 (International Energy Agency, 2020), and the mean concentration of CO2 in the biogas was 40% (Marchese et al., 2020). The CO2 capture efficiency (biogas-to-CO2) ηcapt was taken as 95%, evaluated as the mean value of capture efficiency for the different technologies engaged in biogas upgrading (Bauer et al., 2013).
Regarding biomethane plants, Data Availability provides details on the amount of CH4 supplied by every plant to the gas grid. Accordingly, the amount of available carbon dioxide was estimated based on the technology employed for upgrading at each of the 742 sites. In this regard, the efficiencies presented in Table 2 were used, assuming a biogas composition of 60:40 of CH4:CO2.
Additionally, for both biogas and biomethane plants, the potential amount of digestate available was evaluated according to the methodology presented by Marchese et al. (2021b), starting from the amount of CO2 derived from biogas and assuming a substrate-to-digestate mass conversion of 65% (Blank and Hoffmann, 2011). The landfill substrate was accounted for only in the production of CO2. Digestate derived from landfill applications was excluded from evaluating the production potential, being considered a discharged material disposed of in dedicated disposal areas.
From the total amount of carbon dioxide and digestate streams from both biogas and biomethane plants, the evaluation of the potential production of Fischer–Tropsch fuels and chemicals was carried out taking into account results from techno-economic feasibility investigations (Marchese et al., 2020; Marchese et al., 2021b; Marchese, 2021). In a previous study, we analyzed the conversion of CO2 captured from biogas via chemical scrubbing into FT hydrocarbons from an energy analysis point of view (Marchese et al., 2020). The syngas required by the FT reactor was produced in a reverse water–gas shift reactor coupled with an alkaline electrolyzer or in a solid oxide co-electrolyzer. Based on previous results, operating the RWGS or SOEC devices at low pressure is preferential for high FT product synthesis. Finally, using an SOEC solution is beneficial for energy integration purposes, better matching the thermal demands of the biogas-upgrading unit based on chemical scrubbing. The model exploited 1,000 kg/h of CO2 as carbon feedstock. In a second investigation, we analyzed the gasification of digestate into FT compounds (Marchese et al., 2021b). The FT off-gas was either used as a fuel for electric generation or recycled into the gasifier for enhanced generation of synthetic FT waxes. A solution internally recirculating the FT off-gases was preferential for a higher production of FT compounds. The model employed 881 kg/h of dry digestate material (979 kg/h as received). For both biogas-derived CO2 and digestate, economic considerations were accounted for the production of FT waxes (Marchese, 2021). For all the analyzed processes, the production of FT compounds is described by a mechanistic kinetic model validated with experimental results (Marchese et al., 2019). Figure 4 provides the schematics of the process models taken into consideration for the evaluation of the FT production potential throughout Europe. The electric input for both processes (i.e., 195 kWel and 6,005 kWel for the digestate and biogas routes, respectively) was assumed to be of renewable source, allowing for its storage into FT compounds for e-fuels and e-chemicals (naphtha and middle distillates and waxes). A detailed description of the process routes, as well as energy integration solutions, can be found in the studies of Marchese et al. (2020), Marchese et al. (2021b), and Marchese (2021).
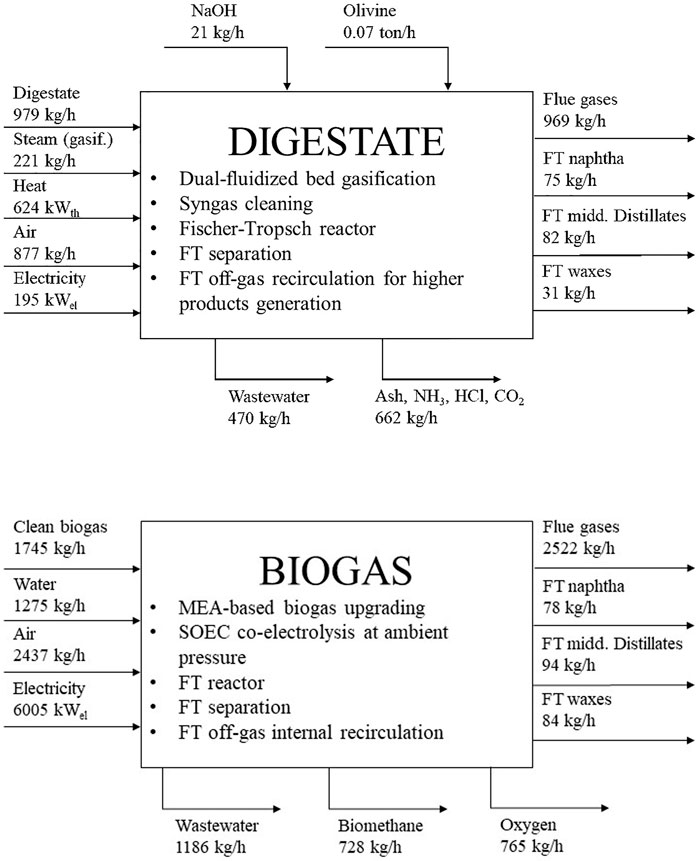
FIGURE 4. Schematics of the process routes taken as a baseline reference for the evaluation of the Fischer–Tropsch production potential, with information about the main process technologies involved in the route. Adapted from (Marchese et al., 2020; Marchese et al., 2021b; Marchese, 2021).
In the process of evaluating the potential production of FT compounds, techno-economic considerations were takin into account considering the cost of production of paraffin FT waxes. Accordingly, results from techno-economic considerations for the baseline configurations were considered, including both CAPEX and OPEX costs, as well as revenues derived from the sale of FT naphtha and middle distillates, and by-products such as heat, oxygen, and biomethane (Marchese et al., 2021b; Marchese, 2021). Consequently, economy of scale was applied to each CCU plant accounted for as in Eq. 3:
The reference cost (Cplant,ref) of each plant corresponded to the purchase cost of the reference plant evaluated by Marchese (2021), taking into account the sum of purchase cost of each plant component (Ceq,i). The plant size value corresponded to the amount of digestate entering the DIGESTATE plant, and CO2 entering the BIOGAS plant. The reference size corresponded to 881 kgdig/h and 1,000 kgCO2/h, respectively. A scaling factor of 0.78 was assumed for the overall CCU plant. From the plant cost, the total investment cost was evaluated considering installation factors, contingency costs, engineering costs, and commissioning costs. OPEX and revenues were varied depending on the plant producibility without applying any scaling factor.
Given the higher availability of biogas plants, the assessment was performed for Germany and Italy. Consequently, state incentives for biomethane grid injection were assumed for both countries. Regarding German policies, these accounted for a biomethane sale price of 31.6 €/kWh with 20-year sale credits of 61.6 €/MWh (Regatrace (2020); Baena-Moreno et al., 2020; Daniel-Gromke et al., 2019). In the case of Italy, a sale price of CH4 of 20.9 €/kWh was assumed, with credits of 62.7 €/MWh in the first 10 years and 0.305 €/m3 for each subsequent year of plant operations (Regatrace (2020); Barbera et al., 2019).
The cost of wax production was evaluated with the annuity method (Michailos et al., 2019), which included the cost of capital repayment for the borrowed capital. Specific component costs, operating costs, and revenues are provided in the Supplementary Material.
Figure 5 provides the potential out-take of carbon dioxide and digestate for each state. The total EU potential corresponds to 4.23 kton/h and 2.79 kton/h of pure CO2 and dry digestate, respectively. As seen, Germany dominates the market for the installed capacity of biogas—with the highest total number of installed plants—providing the highest potential out-take for both carbon dioxide and biomass material. Remarkably, the UK is the second country in terms of potential material flow of CO2, determined by the higher installed capacity than that in Italy (nevertheless, Italy has a higher number of operating biogas plants than the UK). However, the UK also presents a higher percentage of biogas produced from landfill applications (58% of biogas production from landfill, against 19% from Italy (EBA, 2020)), making Italy the second country in Europe with the availability of digestate material for further processing, followed by France, Czech Republic, and Estonia.
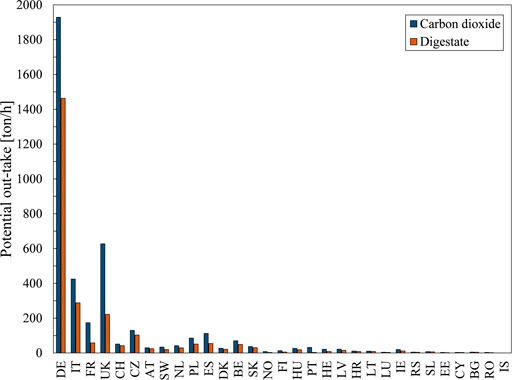
FIGURE 5. Potential out-take of CO2 and digestate (dry) from the operating biogas plants in Europe (end of the year 2019).
The total out-take potential of biomethane plants corresponds to 419 t/h and 357 t/h of CO2 and (dry) digestate, respectively. The share of production depending on the location is provided in Figure 6. Among all the countries that currently present installed upgrading units, Germany is the one with the highest availability of useful non-fossil streams.
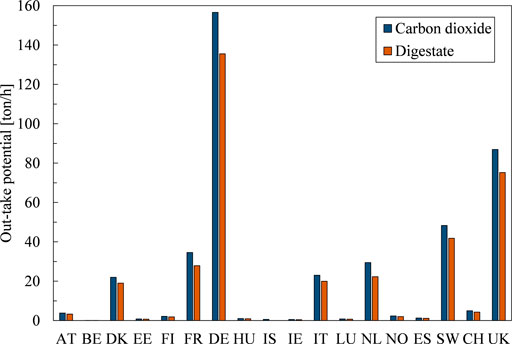
FIGURE 6. Potential out-take of CO2 and digestate (dry) from the operating biomethane plants in Europe (end of the year 2019).
With reference to the accounted CCU plant configurations, utilizing the streams available from the biogas plants provides different amounts of FT feedstocks. The results are listed in Table 3. Such routes provide 831.6 kton/y and 2,948.4 kton/y of waxes utilizing digestate and biogas-derived CO2, respectively. Hence, if we were to exploit the full potential of biogas and digestate, 78.8% of the wax demand could be covered by non-fossil sources.

TABLE 3. Potential production of FT compounds utilizing biogas plants’ CO2 and digestate flows. The liquid fraction accounts for both naphtha and middle distillate cuts.
Similarly, the production of Fischer–Tropsch material utilizing CO2 streams and digestate available from the biomethane plants is provided in Table 4. The total wax production from the digestate route corresponds to 12.6 ton/h, and that from biogas is 34.7 ton/h. Accounting for both contributions, up to 8.3% (39.7 kton/y) of the global paraffin demand can be covered with non-fossil feedstock. However, it is important to point out that this wax production derives from ready-to-use streams of CO2 and digestate that would otherwise be disposed of, especially for the carbon dioxide route where the waste stream would be vented toward the environment.
Biomethane plant locations that match the requirements of the baseline configurations were selected. Accordingly, locations that presented both carbon-feedstock streams availability derived from the AD process were identified, presenting a minimum CO2 flow of 1,000 kg/h and digestate flow of 881 kgdry/h (979 kga.r./h). These correspond to 73 plants throughout Europe, having a total CO2 and digestate stream potential of 137 ton/h and 119 ton/h, respectively. The total production of waxes corresponds to 11.4 t/h and 4.20 t/h with biogas and digestate. Such locations are presented in Figure 7. The evaluation of the FT out-take assumes the installation of both a biogas-to-FT and a digestate-to-FT plant at each location. However, moving digestate from one plant to another might be more feasible than CO2 gas transport, making the production of FT material from digestate feedstock potentially viable from all biomethane plants in Europe.
Additionally, for the locations identified in Italy and in Germany, the cost of wax production was evaluated. These represent 17 plant locations, 5 in Italy and 12 in Germany (Table 5). Considering a reference price of electricity of 100 €/MWh and a WACC (weight average cost of capital) value for the annuity coefficient of 7.50%, the most profitable location corresponds to Güstrow, in the north of Germany. Accordingly, producing waxes with the DIGESTATE route reaches a value of 2.59 €/kg, just 9 cent/kg higher than the fossil upper boundary of 2.5 €/kgwax. Contrariwise, employing the BIOGAS solution would determine a cost of waxes of 4.66 €/kgwax. Tables with the CAPEX and OPEX costs for each location and process route are provided in the Supplementary Material.
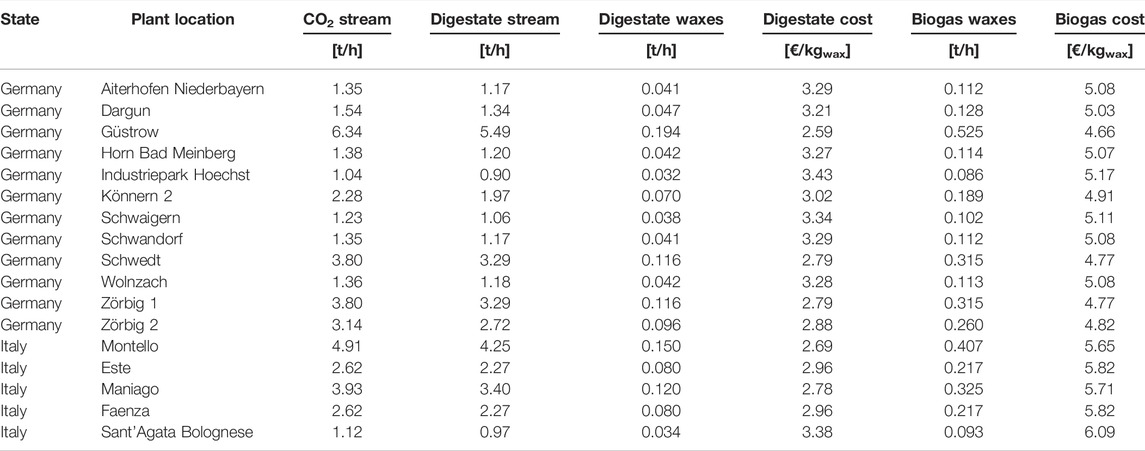
TABLE 5. Preferential plant location in Germany and Italy, with production and cost of waxes from digestate and carbon dioxide.
The wax production costs are even subjected to a change depending on the economic model parameter variation. For the identified location of Güstrow, a sensitivity test to the cost of electricity and WACC was performed. This is provided in Figure 8. In the case of access to low-price electricity (e.g., high availability of hydropower or wind power electricity at prices lower 75 €/MWh (IRENA, 2020)), a solution employing the BIOGAS CCU option provides a sensible lower cost of waxes than the DIGESTATE option. The cost of waxes would go from 0.28 €/kg for highly optimistic economic assumptions (i.e., 2.00% WACC, 40 €/MWh electricity cost) to 9.44 €/kg (WACC 12.50%, electricity priced at 160 €/MWh). Contrariwise, for high-price electric energy, using DIGESTATE should be preferred for the synthesis of waxes. In this case, the wax cost ranges from 1.59 €/kg to 3.61 €/kg. Additionally, the figure provides the evolution of the wax production cost also for the combined utilization of both units. In this regard, the installation costs of the plant can be reduced, by including a single FT reactor and distillation unit consuming syngas coming from both digestate gasification and reverse water–gas shift reaction. The combined utilization of both pathways is strongly influenced by the BIOGAS option, where the high level of variation due to the electricity price is derived by the use of the SOEC electrolysis technology.
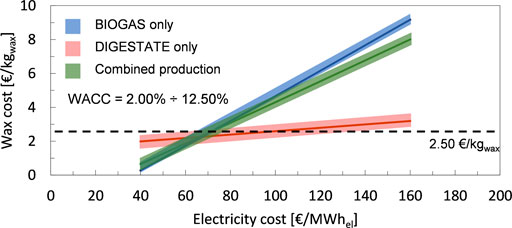
FIGURE 8. Effect of parameter variation on the cost of wax production in the location of Güstrow. Variation of the electricity cost and the WACC value: central lines of the color bands are evaluated at 7.50% WACC.
With reference to the cost of waxes provided by the utilization of carbon dioxide BIOGAS route, the system accounts for credits derived by the injection of methane into the gas grid. Accordingly, such credits are generally provided for the upgrading step, which could be considered already installed at the analyzed plant locations. As such, when installing a CCU plant solution like the one provided in Figure 4, biomethane credits determine a shift in the wax production cost if the same are not included in the economic analysis. Similarly, the cost of installation of the biogas-upgrading unit could be avoided in the analysis. In this regard, the production of FT waxes and carbon dioxide derived from biogas would rise about 2 €/kgwax in each of the locations investigated. In this case, the most economically viable solution using only CO2 from biogas is the location of Montello, in the north of Italy (Table 6). However, such a result is dependent on the economic model hypotheses. With reference to the same location of Güstrow, the effect of cost variation due to the avoidance of biomethane credits is depicted in Figure 9. Accordingly, the production of heavy Fischer–Tropsch compounds is preferential when credits for the biomethane grid injection are included.
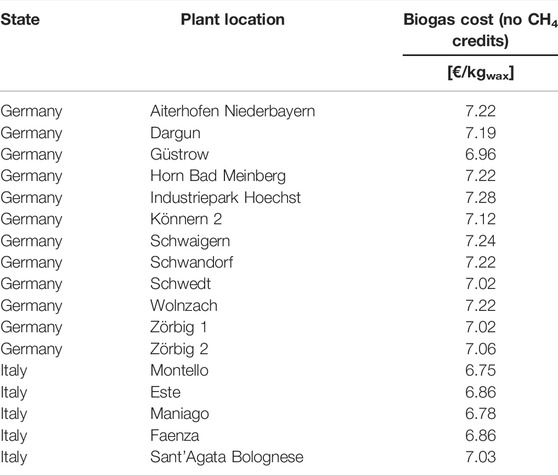
TABLE 6. Preferential plant location in Germany and Italy. The cost of wax production does not consider the capture unit installation costs and biomethane grid injection credits.
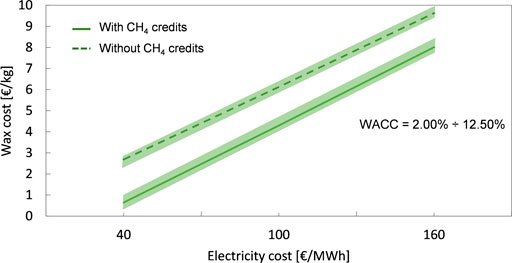
FIGURE 9. Variation of the cost of wax production in the location of Güstrow depending on the biomethane credits for grid injection after upgrading of biogas.
The present investigation assessed the optimal locations in Europe to produce FT waxes utilizing process schemes based on the capture and utilization of carbon feedstock from non-fossil compounds comprising of biogas and digestate derived by the process of anaerobic digestion. The analysis shows a total potential out-take of carbon dioxide from biogas of 4.23 kton/h and of digestate of 2.79 kton/h. Employing such feedstocks, it is possible to cover up to 79% of the worldwide paraffin demand, synthetizing waxes from non-fossil sources. When accounting only for the biomethane plants installed in Europe, the potential throughput of synthetic material is slightly lower, covering about 8% of the global paraffin wax demand. However, specific locations can be identified in Europe with ready-to-use non-fossil streams that match the techno-economic assumptions and results (i.e., presenting a suitable amount of carbon dioxide and digestate material). The lowest cost of wax production can be reached in the location of Güstrow, in Germany, at 2.59 €/kg exploiting digestate and 4.66 €/kg from biogas. Lastly, accounting for the actual potential of the biogas and biomethane plants in Europe might not be straightforward and might be subjected to specific investigation assumptions. However, dioxide and digestate currently available from the anaerobic digestion processes represent two crucial feedstocks for substituting fossil feedstocks and promoting circularity of the C1 molecule.
The original contributions presented in the study are included in the article/Supplementary Material, and further inquiries can be directed to the corresponding author.
MM and AL contributed to conception and design of the study. MM performed the analysis, and MG provided input data and supervision. All authors contributed to manuscript revision and read and approved the submitted version.
This research was funded by the European Union’s Horizon 2020 Research and Innovation program under grant agreement no. 768543 (ICO2CHEM project—From industrial CO2 streams to added value Fischer–Tropsch chemicals).
The authors declare that the research was conducted in the absence of any commercial or financial relationships that could be construed as a potential conflict of interest.
All claims expressed in this article are solely those of the authors and do not necessarily represent those of their affiliated organizations, or those of the publisher, the editors, and the reviewers. Any product that may be evaluated in this article, or claim that may be made by its manufacturer, is not guaranteed or endorsed by the publisher.
The Supplementary Material for this article can be found online at: https://www.frontiersin.org/articles/10.3389/fenrg.2021.773717/full#supplementary-material
Antoniou, N., Monlau, F., Sambusiti, C., Ficara, E., Barakat, A., and Zabaniotou, A. (2019). Contribution to Circular Economy Options of Mixed Agricultural Wastes Management: Coupling Anaerobic Digestion with Gasification for Enhanced Energy and Material Recovery. J. Clean. Prod. 209, 505–514. doi:10.1016/j.jclepro.2018.10.055
Awe, O. W., Zhao, Y., Nzihou, A., Minh, D. P., and Lyczko, N. (2017). A Review of Biogas Utilisation, Purification and Upgrading Technologies. Waste Biomass Valor. 8, 267–283. doi:10.1007/s12649-016-9826-4ï
Baena-Moreno, F. M., Sebastia-Saez, D., Wang, Q., and Reina, T. R. (2020). Is the Production of Biofuels and Bio-Chemicals Always Profitable? Co-production of Biomethane and Urea from Biogas as Case Study. Energ. Convers. Manage. 220, 113058. doi:10.1016/j.enconman.2020.113058
Barbera, E., Menegon, S., Banzato, D., D'Alpaos, C., and Bertucco, A. (2019). From Biogas to Biomethane: A Process Simulation-Based Techno-Economic Comparison of Different Upgrading Technologies in the Italian Context. Renew. Energ. 135, 663–673. doi:10.1016/j.renene.2018.12.052
Bauer, F., Persson, T., Hulteberg, C., and Tamm, D. (2013). Biogas Upgrading – Technology Overview, Comparison and Perspectives for the Future. Biofuels, Bioprod Biorefining 6, 246–256. doi:10.1002/bbb
Bekker, M., Louw, N. R., Jansen Van Rensburg, V. J., and Potgieter, J. (2013). The Benefits of Fischer-Tropsch Waxes in Synthetic Petroleum Jelly. Int. J. Cosmet. Sci. 35, 99–104. doi:10.1111/ics.12011
Blank, A., and Hoffmann, E. (2011). Upgrading of a Co-digestion Plant by Implementation of a Hydrolysis Stage. Waste Manag. Res. 29, 1145–1152. doi:10.1177/0734242X11423954
Corden, C., Bougas, K., Cunningham, E., Tyrer, D., Kreißig, J., Zetti, E., et al. (2019). Digestate and Compost as Fertilisers: Risk Assessment and Risk Management Options.
Cuéllar-Franca, R., García-Gutiérrez, P., Dimitriou, I., Elder, R. H., Allen, R. W. K., and Azapagic, A. (2019). Utilising Carbon Dioxide for Transport Fuels: The Economic and Environmental Sustainability of Different Fischer-Tropsch Process Designs. Appl. Energ. 253, 113560. doi:10.1016/j.apenergy.2019.113560
Daniel-Gromke, J., Denysenko, V., Liebetrau, J. B., and Europe, B. I. (2019). Biogas and Biomethane in Europe: Lessons from Denmark. Germany: and Italy.
EBA-GIE (2020). European Biomethane MAP – Infrastructure for Biomethane Production, 1. Gas Infrastruct Eur.
Gandiglio, M., and Lanzini, A. (2021). Biogas Resource Potential and Technical Exploitation. Compr. Renew. Energy. Second Ed. Amsterdam: Elsevier.
Gandiglio, M., Lanzini, A., Soto, A., Leone, P., and Santarelli, M. (2017). Enhancing the Energy Efficiency of Wastewater Treatment Plants through Co-digestion and Fuel Cell Systems. Front. Environ. Sci. 5, 70. doi:10.3389/fenvs.2017.00070
Hombach, L. E., Doré, L., Heidgen, K., Maas, H., Wallington, T. J., and Walther, G. (2019). Economic and Environmental Assessment of Current (2015) and Future (2030) Use of E-Fuels in Light-Duty Vehicles in Germany. J. Clean. Prod. 207, 153–162. doi:10.1016/j.jclepro.2018.09.261
Huang, L., Qing, C., Tao, H., Wang, Y., and Liu, X. (2015). Experimental Study for Biogas Upgrading by Water Scrubbing under Low Pressure. Open Chem. Eng. J. 9, 34–38. doi:10.2174/1874123101509010034
International Energy Agency (IEA) (2020). Outlook for Biogas and Biomethane. doi:10.1787/040c8cd2-en
Korhonen, J., Honkasalo, A., and Seppälä, J. (2018). Circular Economy: The Concept and its Limitations. Ecol. Econ. 143, 37–46. doi:10.1016/j.ecolecon.2017.06.041
Krylova, A. Y. (2014). Products of the Fischer-Tropsch Synthesis (A Review). Solid Fuel Chem. 48, 22–35. doi:10.3103/S0361521914010030
Lehtonen, J., Järnefelt, V., Alakurtti, S., Arasto, A., Hannula, I., Harlin, A., et al. (2019). The Carbon Reuse Economy: Transforming CO2 from a Pollutant into a Resource. VTT Tech. Res. Cent. Finl, 49. doi:10.32040/2019.978-951-38-8709-4
Marchese, M. (2021). Conversion of Industrial CO2 to Value- Added Fuels and Chemicals via Fischer-Tropsch Upgrade. PhD Thesis, Politec Di Torino.
Marchese, M., Buffo, G., Santarelli, M., and Lanzini, A. (2021). CO2 from Direct Air Capture as Carbon Feedstock for Fischer-Tropsch Chemicals and Fuels: Energy and Economic Analysis. J. CO2 Utilization 46, 101487. doi:10.1016/j.jcou.2021.101487
Marchese, M., Chesta, S., Santarelli, M., and Lanzini, A. (2021). Techno-economic Feasibility of a Biomass-To-X Plant: Fischer-Tropsch Wax Synthesis from Digestate Gasification. Energy 228, 120581. doi:10.1016/j.energy.2021.120581
Marchese, M., Giglio, E., Santarelli, M., and Lanzini, A. (2020). Energy Performance of Power-To-Liquid Applications Integrating Biogas Upgrading, Reverse Water Gas Shift, Solid Oxide Electrolysis and Fischer-Tropsch Technologies. Energy Convers. Manag. X 6, 100041. doi:10.1016/j.ecmx.2020.100041
Marchese, M., Heikkinen, N., Giglio, E., Lanzini, A., Lehtonen, J., and Reinikainen, M. (2019). Kinetic Study Based on the Carbide Mechanism of a Co-pt/γ-Al2O3 Fischer-Tropsch Catalyst Tested in a Laboratory-Scale Tubular Reactor. Catalysts 9, 717. doi:10.3390/catal9090717
Michailos, S., Mccord, S., Sick, V., Stokes, G., and Styring, P. (2019). Dimethyl Ether Synthesis via Captured CO2 Hydrogenation within the Power to Liquids Concept: A Techno-Economic Assessment. Energ. Convers. Manage. 184, 262–276. doi:10.1016/j.enconman.2019.01.046
Pellegrini, L. A., De Guido, G., and Moioli, S. (2020). Design of the CO2 Removal Section for PSA Tail Gas Treatment in a Hydrogen Production Plant. Front. Energ. Res. 8, 77. doi:10.3389/fenrg.2020.00077
Pérez-Fortes, M., Bocin-dumitriu, A., and Tzimas, E. (2014). CO2 Utilization Pathways: Techno-Economic Assessment and Market Opportunities. Energ. Proced. 63, 7968–7975. doi:10.1016/j.egypro.2014.11.834
Rahbari, A., Shirazi, A., Venkataraman, M. B., and Pye, J. (2019). A Solar Fuel Plant via Supercritical Water Gasification Integrated with Fischer-Tropsch Synthesis: Steady-State Modelling and Techno-Economic Assessment. Energ. Convers. Manage. 184, 636–648. doi:10.1016/j.enconman.2019.01.033
Riboldi, L., and Bolland, O. (2015). Evaluating Pressure Swing Adsorption as a CO 2 Separation Technique in Coal-Fired Power Plants, International Journal of Greenhouse Gas Control 39, 1-16. doi:10.1016/j.ijggc.2015.02.001
Rodin, V., Lindorfer, J., Böhm, H., and Vieira, L. (2020). Assessing the Potential of Carbon Dioxide Valorisation in Europe with Focus on Biogenic CO2. J. CO2 Utilization 41, 101219. doi:10.1016/j.jcou.2020.101219
Sechi, S., Giarola, S., Lanzini, A., Gandiglio, M., Santarelli, M., Oluleye, G., et al. (2021). A Bottom-Up Appraisal of the Technically Installable Capacity of Biogas-Based Solid Oxide Fuel Cells for Self Power Generation in Wastewater Treatment Plants. J. Environ. Manage. 279, 111753. doi:10.1016/J.JENVMAN.2020.111753
Song, C., Zhang, C., Zhang, S., Lin, H., Kim, Y., Ramakrishnan, M., et al. (2020). Thermochemical Liquefaction of Agricultural and Forestry Wastes into Biofuels and Chemicals from Circular Economy Perspectives. Sci. Total Environ. 749, 141972. doi:10.1016/j.scitotenv.2020.141972
Suaria, G., Aliani, S., Merlino, S., and Abbate, M. (2018). The Occurrence of Paraffin and Other Petroleum Waxes in the Marine Environment: A Review of the Current Legislative Framework and Shipping Operational Practices. Front. Mar. Sci. 5, 94. doi:10.3389/fmars.2018.00094
Sutter, D., Van Der Spek, M., and Mazzotti, M. (2019). 110th Anniversary: Evaluation of CO2-Based and CO2-Free Synthetic Fuel Systems Using a Net-Zero-CO2-Emission Framework. Ind. Eng. Chem. Res. 58, 19958–19972. doi:10.1021/acs.iecr.9b00880
Teir, S., Suomalainen, M., and Onarheim, K. (2014). Pre-evaluation of a New Process for Capture of CO2 Using Water.
Keywords: Fischer–Tropsch, synthetic hydrocarbons, biogas, anaerobic digestion, digestate, circular economy, biomethane
Citation: Marchese M, Gandiglio M and Lanzini A (2021) A Circular Approach for Making Fischer–Tropsch E-fuels and E-chemicals From Biogas Plants in Europe. Front. Energy Res. 9:773717. doi: 10.3389/fenrg.2021.773717
Received: 10 September 2021; Accepted: 08 November 2021;
Published: 10 December 2021.
Edited by:
Sachin Kumar, Sardar Swaran Singh National Institute of Renewable Energy, IndiaReviewed by:
Jale Yanik, Ege University, TurkeyCopyright © 2021 Marchese, Gandiglio and Lanzini. This is an open-access article distributed under the terms of the Creative Commons Attribution License (CC BY). The use, distribution or reproduction in other forums is permitted, provided the original author(s) and the copyright owner(s) are credited and that the original publication in this journal is cited, in accordance with accepted academic practice. No use, distribution or reproduction is permitted which does not comply with these terms.
*Correspondence: Marta Gandiglio, bWFydGEuZ2FuZGlnbGlvQHBvbGl0by5pdA==
Disclaimer: All claims expressed in this article are solely those of the authors and do not necessarily represent those of their affiliated organizations, or those of the publisher, the editors and the reviewers. Any product that may be evaluated in this article or claim that may be made by its manufacturer is not guaranteed or endorsed by the publisher.
Research integrity at Frontiers

Learn more about the work of our research integrity team to safeguard the quality of each article we publish.