 Qi Zhao
 Zhi-Ming Xia2,3,4*
 Chun-Gang Xu
 Zhao-Yang Chen
94% of researchers rate our articles as excellent or good
Learn more about the work of our research integrity team to safeguard the quality of each article we publish.
Find out more
ORIGINAL RESEARCH article
Front. Energy Res., 15 November 2021
Sec. Carbon Capture, Utilization and Storage
Volume 9 - 2021 | https://doi.org/10.3389/fenrg.2021.770599
This article is part of the Research TopicGas Hydrate and Hydrate Technology for Greenhouse Gas MitigationView all 7 articles
The capture and storage of carbon dioxide (CO2) are urgent and crucial to achieve the goal of carbon neutrality. Hydrate-based CO2 capture technology is one of the promising technologies for capturing and storing CO2. This work studied the nucleation and growth of CO2 hydrate provoked by direct current–voltage accompanied by charge flow with the agitation of 450 rpm at an initial pressure of 3.5 MPa and a temperature of 274.15 K. The results show that the physical bubble behavior and electrochemistry mechanisms could influence CO2 hydrate formation process in the application of voltage. The induction time and semi-completion time of CO2 hydrate formation were decreased by 51% and 27.8% in the presence of 15 V, respectively. However, more product of electrolysis, Joule heat and ions, could inhibit the CO2 hydrate formation process in the application of a high voltage (60 V). In addition, a high voltage (60 V) could change the morphology characteristics of CO2 hydrate from gel-like to whisker-like. This study provides valuable information on the formation of CO2 hydrate under the action of charge flow.
Nowadays, the emission of carbon dioxide (CO2) due to the massive burning of fossils fuels has been recognized as the leading contributor to global warming and climate change (Soon et al., 1999). In September 2020, China announced its aims “to have CO2 emissions peak before 2030 and achieve carbon neutrality before 2060”. Therefore, such severe consequence designates that the capture and storage of CO2 are urgent and crucial. CO2 capture technology mainly includes the chemical absorption method, physical adsorption method, membrane separation method, gas hydrate–based CO2 capture technology, etc. On account of the high stability and strong storage capacity of gas hydrate, hydrate-based CO2 separation and storage becomes a potential and promising way (Yang et al., 2008; Lee et al., 2010; Xia et al., 2016; Xia et al., 2017). However, the main issues need to be resolved for the application of hydrate technology, including harsh formation conditions, long induction time, slow formation rate, and low conversion ratio of gas to hydrate. There is an urgent need to find efficient methods to improve hydrate formation process.
There are two main methods to solve these issues: mechanical strengthening (mechanical stirring, spraying, and bubbling) and chemical physics strengthening (thermodynamic promoters, surfactant, porous material, and nanoparticles). The gas hydrate formation rate, induction time, and gas storage capacity can be affected by the application of strengthening methods, and these strengthening methods have respective advantages and disadvantages. Among them, the mechanical stirring (Linga et al., 2010; He et al., 2011), spraying (Ohmura et al., 2002; Fujita et al., 2009), bubbling (Luo et al., 2007; Chernov et al., 2017), and the addition of porous material (Linga et al., 2012; Bhattacharjee et al., 2015) can increase the gas–liquid contact area to promote gas dissolution. The surfactant (SDS, STS, SHS, etc.) can promote the dissolution and diffusion coefficient of the gas in the liquid phase by reducing the surface tension at the interface (Zhang et al., 2007; Xu et al., 2012). In addition, the mechanical strengthening and the addition of porous material and nanoparticles promote heat transfer and mass transfer of gas–liquid, thereby accelerating the production rate of hydrates. Furthermore, thermodynamic accelerators (THF, TBAB, CP, etc.) can alleviate the condition of gas hydrate formation and hasten the hydrate formation process (Linga et al., 2008; Li et al., 2010; Xu et al., 2017; Zheng et al., 2017). However, the energy consumption required by stirring and the heat generated in the stirring process are significant, which reduce energy efficiency (Mori, 2015). Adding an ultrasonic atomizer to the system increases the investment cost and increases the operation cost. Using additives will cause secondary pollution to the reaction system, which is not conducive to the development of some applications of hydrate-based technologies. Therefore, to enhance hydrate formation, we should comprehensively consider the advantages and disadvantages of various strengthening methods and make innovations on the basis of the original ones. In addition to the above strengthening methods, the hydrate formation provoked by direct current–voltage (DC-V) may become a potential strengthening method.
Several researchers have reported that the application of DC-V could assist water crystallization by charge flow (CF) and static electric field (SEF). Wei et al. (2008) found that water molecules were polarized along the direction of the electric field and nucleated at a higher temperature in the presence of SEF. When the intensity of SEF was 1.0 × 10⁵ V/m, the degree of undercooling (△T) could be shortened to 1.6°C. Conceptually, similar work has also been carried by Orlowska et al. (2009). When water droplets were under an electric field strength of 6.0 × 10⁶ V/m, the undercooling degree of nucleation (△T = 4°C) could be shortened by about 52% compared with that in the absence of the electric field. However, the time of nucleation was increased by 22%. Meanwhile, their theoretical research showed that applying an electric field in the process of nucleation would reduce the Gibbs free energy of the system and increase the nucleation temperature. On the basis of the previous research studies, Carpenter and Bahadur (2015) studied that the nucleation temperature could be significantly increased by more than 15°C under the ultrahigh electric field of 8.0 × 10⁷ V/m. In addition, they also found that the nucleation temperature could also be increased when the current flowed through the water droplets. However, the mechanism of influence on nucleation was very different from the SEF. Furthermore, Hozumi et al. (2003) examined the effect of six different electrode materials (Al, Cu, Ag, Au, Pt, and C) on ice nucleation in the presence of CF. It was found that the nucleation could be achieved at 1–2°C under current of 5–7 μA, and the probability of nucleation was closely related to the plate materials (Al=Cu > Ag > Au > Pt > C). The nucleation process of hydrate is similar to ice, so the application of DC-V may also have some influence on the hydrate nucleation. The research of Park et al. showed that the induction time of CO2 hydrate formation was largely shortened by 5.8 times under an electric field strength of 1.0 × 10⁴ V/m (Park and Kwon, 2018). In addition, when the SEF was applied before gas dissolution, the existence of a strongly polarized water layer at the water-gas interface hindered gas absorption, thus hindering the formation of hydrate. Pahlavanzadeh et al. (2020a) extended the idea of Park, which assessed the effect of the pulsed electric field (PEF) and SEF on the mechanism of THF hydrate formation. The study found that, with the increasing of the intensity of the electric field, the nucleation temperature and growth time of THF hydrate increased, and the application of PEF could weaken the effect on THF hydrate. Meanwhile, the formation of THF hydrate was investigated by the application of weak SEF. The induction time of THF hydrate could be extended, and the memory effect decreased in the presence of weak SEF (Chen et al., 2020). However, the other main reason for electro-nucleation is that CF in the system affects hydrate formation. Carpenter and Bahadur (2016) and Shahriari et al. (2017) studied that CF played an essential role on the hydrate formation. They concluded that the induction time could be significantly shortened during the process of THF hydrate formation by applying voltage accompanied by a weak current (μA), which may be attributed to cathode and anode product (bubble formation or metal cations) on account of oxidation-reduction reaction at the electrodes. However, despite the wealth of literature available in the field, there is still a lack of kinetics study of gas hydrate formation in the application of DC-V accompanied by CF. The main objective of this work is to investigate the effect of CF on the kinetics of CO2 hydrate formation. The induction time, semi-completion time, gas consumption, hydrate formation rate, and morphological characteristics were systematically studied in the process of CO2 hydrate formation in the application of different DC voltages (0–60 V). This study can provide helpful information on the dynamic behavior of the process of CO2 hydrate formation under the action of CF.
The purity of 99.99% CO2 was provided by Guangzhou Spectrum Source Gas Co., Ltd. The deionized water (resistivity of 18.25 MΩ cm) prepared by the laboratory water purification mechanism was used as pure water for CO2 hydrate formation. Potassium thiocyanate (KSCN) was made in Beijing Merida Technology Co., Ltd. to detect metal cations produced on the anode during electrolysis.
The schematic diagram of the experimental apparatus is shown in Figure 1A. The crystallizer with the inner volume of 380 ml (with inner length and width of 6.9 cm and inner height of 11 cm) and pressure tolerance of 10 MPa was applied for the kinetic experiments of CO2 hydrate formation. It was made of 316 stainless steel. The front and back of the crystallizer were equipped with visual windows for observing the formation and decomposition of CO2 hydrate. The inside of the crystallizer was coated with a polytetrafluoroethylene film to make it insulating. A mechanical stirring was set at the top of the reactor to thoroughly mix the gas and liquid phase. The crystallizer was immersed in a constant temperature water bath filled with 25 wt% ethylene glycol solution to maintain a constant temperature. The vacuum pump was used to free the reactor before feeding CO2. The cathode and anode electrodes (length, 49 mm; width, 34 mm) with a thickness of 1.2 mm were inserted in the liquid phase, as shown in Figure 1B. The spacing between the two electrodes was 3 cm. The electrodes were linked to a DC power supply, an ammeter, and a voltmeter. The cathode was coated with a 24-μm Parylene-C dielectric layer by vapor deposition technique. Then, only the dielectric layer on either side of the cathode electrode was removed to guarantee a small amount of current flowing. There will be sensible current flow through the liquid phase without the dielectric layer, leading to a great deal of Joule heating and water electrolysis. Two PT100 thermocouples with an accuracy of 0.1 K and a pressure sensor with an accuracy of 0.01 MPa were respectively arranged inside the crystallizer to monitor the temperature and pressure change. All the data during experiments were collected by Agilent 34970A.
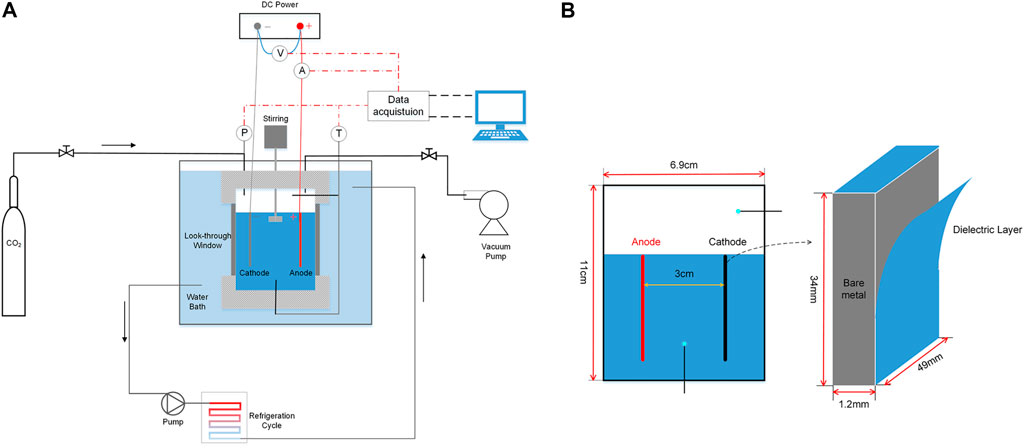
FIGURE 1. (A) Schematic of the experimental setup; (B) Details of the electrodes inside the crystallizer.
Before the hydrate formation experiment, the solubility of CO2 in the effect of CF and the chemical reaction between cathode and anode were studied. The crystallizer was firstly cleaned three times with deionized water and then dried by a dryer. After then, 180 ml of deionized water was injected into the crystallizer. Then, the crystallizer was placed in the water bath to maintain the temperature of 283.15 K. After the temperature of liquid reached the set temperature and kept stable, the vacuum pump started to make the reactor air free. Subsequently, CO2 was pressurized into the reactor to the desired pressure of 3.5 MPa. Then, both the stirring at the speed of 450 rpm and DC power supply started at one time (this time was set to 0). Furthermore, to detect the chemical reaction on the bipolar plate during power-on, a few prepared KSCN solutions were dropped into the liquid phase at normal temperature and pressure to observe the changes in the liquid phase.
The experiment process of the kinetics of CO2 hydrate formation is as follows. The preparatory work in the early stage was the same as above. The temperature of the water bath was set at 274.15 K. After gas injection, the pressure, temperature, and current experimental data were recorded every 10 s. It was considered the completion of CO2 hydrate formation when the pressure drop was not sensible for at least 2 h, and the temperature remained constant at the set temperate. Each experimental result in this study was the average of at least two independent tests.
The amount of CO2 gas consumption could be calculated by the following equation:
where
The CO2 gas consumption consists of the moles of CO2 dissolved in water and the moles of CO2 trapped into the hydrate phase. The relationship between the three is shown in the following equation:
where
The solubility of CO2 gas,
where T (°C) is the temperature at which the hydrate is stable, ranging from −1.48°C to 9.93°C.
The moles of CO2 dissolved in water can be calculated by the following equation:
where
where
where Ci is the Langmuir constant of CO2 in the type i cavity; fCO2 represents the fugacity of CO2 in the gas phase, which is calculated by the Peng–Robinson equation of state. The Langmuir constant of CO2 Ci is formulated as follows:
where T is the temperature; Ai and Bi are constants.
According to Eqs 2–4, the mole of CO2 trapped into the hydrate phase can be attained by the following equation:
Water to hydrate conversion,
CO2 to hydrate conversion,
where
The average rate of hydrate formation is computed as follows:
The average value (Rav) of these rates is calculated every 30 min as follows:
The CO2 solubility in the presence of CF was studied at 3.5 MPa and 283.15 K. Figure 2A shows the gas consumption during the CO2 dissolution process in different conditions. It could be obviously seen that the CO2 dissolution rate was accelerated in the presence of stirring. Moreover, the CO2 saturated solubility and dissolution rate was slightly promoted in the application of 30 V, but it was not conducive to the CO2 dissolution when applying 60 V voltage. Figure 2B shows the current profile and final temperature of the liquid phase during dissolution in different conditions. We found that the trends of the current change were the same in the application of different voltages. The current of the system rapidly increased at first and then kept stable. In the process of CO2 dissolution, a certain amount of H+, HCO3−, and CO32- ions were present in the solution because of chemical reactions. Because changes in concentration of dissolved CO2 influenced the concentration of ions, the current increased with the CO2 dissolution until saturation. Meanwhile, it is well known that current is proportional to voltage. Electrolysis is the oxidation-reduction reaction of the system that struck when the voltage was applied to the two electrodes. Furthermore, Joule heat would also occur during the electrolysis process except for oxidation-reduction reaction, which resulted in the elevation of the temperature of the system, particularly in higher voltages. In Figure 2B, the liquid phase temperature increased by about 0.3 and 0.05 K in the application of 60 and 30 V, respectively. However, the temperature affected the solubility, and higher temperature was not good for solubility (Zatsepina and Buffett, 2001; Diamond and Akinfiev, 2003). Hence, the CO2 saturated solubility was apparently reduced because of more Joule heat in the application of 60 V. Therefore, the change of system temperature is the essential factor affecting CO2 solubility in the presence of CF. It is appropriate that the solubility of CO2 gas in the presence of hydrates can be calculated according to the Diamond’s CO2 solubility model.
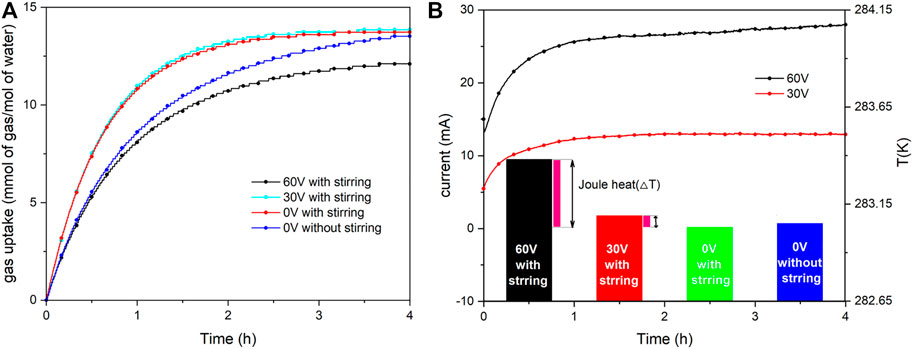
FIGURE 2. (A) Gas uptake during the CO2 dissolution process in different conditions at 3.5 MPa and 283.15K; (B) The current of solution profiles and the final temperature of liquid phase.
Figure 3 shows the morphology of CO2 hydrate formation in the reaction in the application of 0 and 30 V at the static system without agitation. It can be seen in Figure 3A that only a film hydrate was formed at the gas–liquid interface without any voltage because the film hindered the radial growth of CO2 hydrate. However, besides a film hydrate layer that appeared at the gas–liquid interface, whisker hydrate was observed at the liquid region in the application of 30 V. The differences of the CO2 hydrate morphology provided direct evidence that CF could trigger the CO2 hydrate formation. To confirm the reaction between the anode and the cathode under electrolysis, a little of prepared KSCN solutions were dropped into the liquid phase at ambient temperature and pressure (293.15 K and 0.101 MPa, respectively) with a potential difference of 30 V. The phenomenon in the liquid phase is shown in Figure 4. The anode region turned red rapidly, indicating that iron ions were generated by electrolysis. At the same time, many hydrogen bubbles were observed in the surface of the bare metal of the cathode. With the electrolytic reaction going on, the ions generated by electrolysis migrated in the opposite direction under the action of electric field force, and the anions and cations combined to form Fe(OH)3 reddish-brown precipitation.
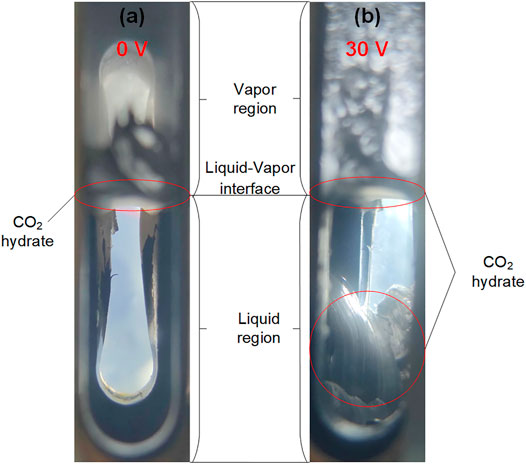
FIGURE 3. Morphology of CO2 hydrate formation in the application of 0 and 30 V without stirring at 3.5 MPa and 274.15 K. (A) 0 V, (B) 30 V.
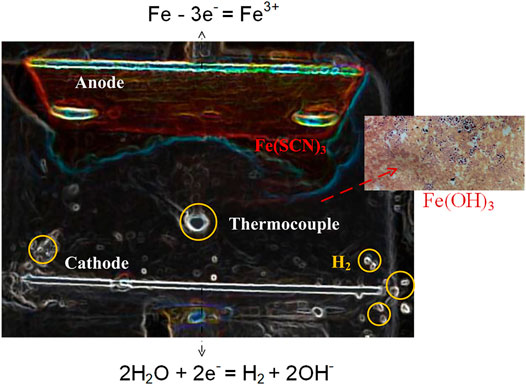
FIGURE 4. The phenomenon of bipolar plate dropping KSCN solution into water.
In the static system, the rate of hydrate formation was slow because of the inadequate mixing between gas and water. A large number of studies have shown that mechanical stirring could enhance the contact between gas and water, enhance heat and mass transfer, and promote hydrate formation (Hao et al., 2007; Linga et al., 2010; He et al., 2011). Therefore, the following experiment was carried out under a stirring system. Table 1 shows the experimental results of the CO2 hydrate formation in different application voltages with the speed of 450 rpm at 3.5 MPa and 274.15 K. Table 1 summarizes the experimental results, including induction time (tin), gas uptake during the induction period (GUin), semi-completion time (t90%), gas uptake during the semi-completion time (GU90%), final gas uptake (GU100%), water-to-hydrate conversion (CWH), and CO2-to-hydrate conversion (CCH).
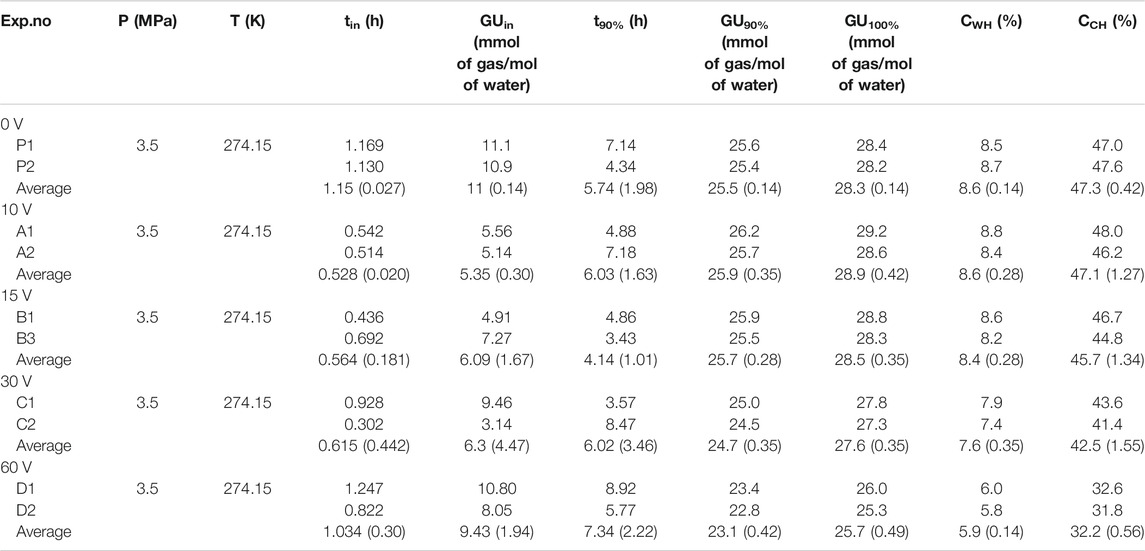
TABLE 1. Experimental results of CO2 hydrate formation in different conditions.
The ability of the supersaturation system to maintain a metastable state can be evaluated by the induction period, which is a key parameter in the process of CO2 hydrate nucleation. In this study, the induction time (tin) is defined as the period from time 0 (the opening of stirring and DC supply) to a detected significant temperature increase and sudden pressure drop. Semi-completion time (t90%) is defined as the time between time 0 and the time required to capture 90% of the general entrapped CO2 gas (Pahlavanzadeh et al., 2020b). The hydrate formation time is a critical parameter for hydrate application. After the hydrate conversion rate gets 90% of the total, the gas consumption rate becomes very slow, and the hydrate formation time is relatively long. Hence, t90% can be approximately taken as the completion time of hydrate formation.
Figure 5 shows the curves of the pressure of the system, the temperature of the liquid phase, and current during the hydrate formation process of CO2 hydrate at 3.5 MPa and 274.15 K in the application of 15 V at the first 3 h. The pressure of the system decreased as the dissolution of CO2 in the initial period, and the temperature of the liquid phase was maintained stable. Subsequently, an amount of CO2 gas molecules entrapped into hydrate cages formed water molecules, resulting in an abrupt rise in temperature and sensible decrease in pressure. Then, the temperature of the liquid phase returned to the set temperature. Nevertheless, the pressure still continually decreased because CO2 hydrates continued to generate, and hydrate grew and crept along the agitator arm toward the gas phase, as shown in Figure 5. This phenomenon of wall-creeping hydrate growth also was reported by the previous research (Huang, 2005). The current increased with the dissolution of CO2 and tended to be stable until the CO2 dissolve to saturation. The conductivity in the solution depends on ion concentration and ion mobility, which is proportional to temperature (Zatsepina and Buffett, 2001). Therefore, much heat generates instantly due to the nucleation of CO2 hydrate, which accelerates the ion mobility to increase the current in the solution. The resistance of the system increases because of the hydrate formation, and the current gradually decreases with the growth of the hydrate. However, the feed water in this experiment is excessive. Hence, when CO2 hydrates ultimately form, there is still a certain amount of free water in the system, and the current of the system cannot decrease to zero. According to Faraday’s electrolysis law, the calculation shows that less than 0.1% of water is electrolyzed. Thus, electrolysis would not affect the composition of components.
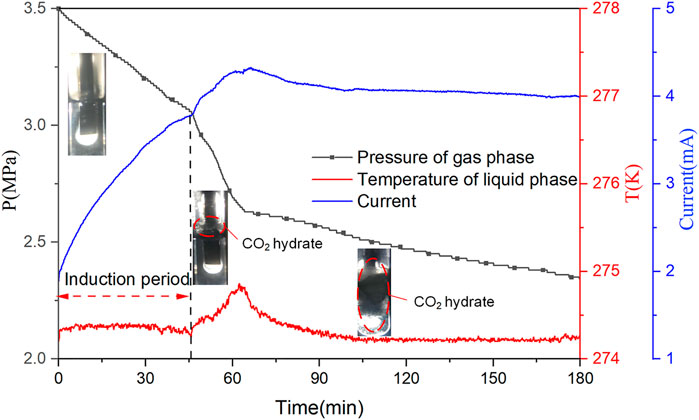
FIGURE 5. The pressure of gas phase and temperature of liquid phase and current curves during the CO2 hydrate formation process at 3.5 MPa and 274.15 K in the application of a voltage of 15 V.
Figure 6 shows the induction time and semi-completion time of CO2 hydrate formation by applying different voltages ranging from 0 to 60 V at experimental conditions of 274.15 K and 3.5 MPa. Interestingly, the induction time was totally reduced under the action of CF. The shortest induction time was obtained by applying voltage of 10 V, and it was reduced by 54% compared with that in without voltage. At the same time, we found that the induction time was prolonged with the increase of voltage. Significantly, the induction time in the application of 60 V became nearly consistent with that in without voltage. Hence, higher voltage may have a little positive effect on the nucleation of CO2 hydrate. The current flow in the solution resulted in electrolysis at the electrodes in the application of voltages. The electrolytic corrosion of the electrode plate occurred at the anode accompanying by the production of metal ions (Fe3+), and hydrogen bubbles busted out at the cathode. The growth and rupture of bubbles could disturb the system and increase the probability of CO2 hydrate nucleation. Meanwhile, the production of metal cations at anode also promoted the nucleation of crystals (Kumano et al., 2012). The empty hybrid orbitals of Fe3+ form coordination bonds with water molecules to promote the ordered arrangement of water molecules. The enhancement of the local hydrogen-bonding network can promote CO2 hydrate nucleation to reduce the induction time of CO2 hydrate. However, the faster rate of ions migrating to the electrode promotes the formation of Fe(OH)3 and shortens the residence time of Fe3+ in liquid phase with the increase of voltage. Furthermore, the more Joule heat is not conducive to the process of CO2 hydrate nucleation. Hence, the induction time was prolonged with the increase of voltage. As can be seen in Figure 6, the semi-completion time was prolonged except for voltage of 15 V compared with 0 V. The semi-completion time of CO2 hydrate formation was decreased by 27.8% in the application of 15 V. The semi-completion time represents the hydrate formation rate that can be controlled by kinetics or heat and mass transfer. Iron ions produced by electrolysis are more easily diffused to the gas–liquid interface area under the action of stirring in the application of 10 V under the weak electric field force. This leads to more hydrate growth at the interface, hindering the further diffusion of CO2. Thus, the semi-completion time was increased in the application of 10 V. More CO2 hydrates are formed in the whole liquid phase under the action of electrolytic product Fe3+ in the application of 15 V, which greatly shortens the semi-completion time. However, more Joule heat can inhibit the growth of hydrate with the increase of voltage.
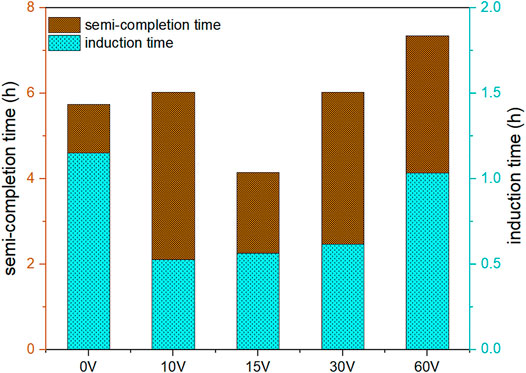
FIGURE 6. Effect of different voltages on induction time and semi-completion time of CO2 hydrate at 3.5 MPa and 274.15 K.
The curve of the CO2 gas consumption per mole of water (gas uptake) in the application of different DC voltages is illustrated in Figure 7. The gas consumption increased gradually during the process of hydrate formation until the completion of hydrate formation. The gas consumption in the first 0.7 h was almost the same due to the dissolution of CO2, but the differences subsequently arose under the action of the CF. It is observed that different DC voltages may have adverse effects on the gas consumption rate and the final amount of gas consumption. When 10- and 15-V DC voltage were applied to the system, the gas consumption rate was accelerated, with 15 V more pronounced. The amount of Joule heat is meager at low voltage, and it has little effect on the temperature of the system. On the contrary, the rate and final amount of CO2 gas consumption during the hydrate formation process were lower in applying voltage of 30 and 60 V compared with that in the absence of CF. This means that the CO2 gas molecules entrapped into hydrate cages become more difficult at higher DC voltage.
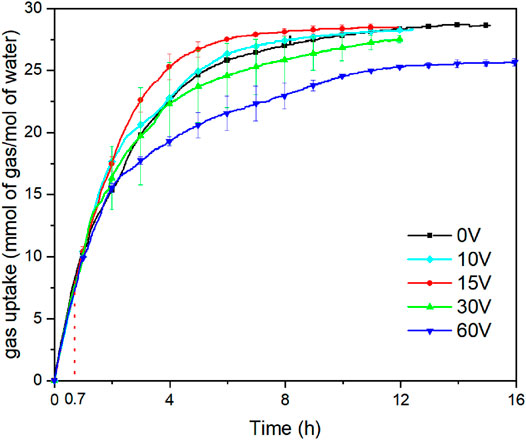
FIGURE 7. Gas uptake in the application of different voltages at 3.5 MPa and 274.15 K
In Figure 8, the rates of CO2 hydrate formation in the application of different voltages were compared. In all experiments, the beginning of the hydrate reaction had the highest rate of hydrate formation due to the CO2 gas dissolved rapidly in the aqueous phase and then the hydrate formation rates fell as a series of fluctuations to zero. It can be clearly seen in Figure 8 that the application of voltage slightly reduced the initial dissolution rate of CO2 in water, and the hydrate formation rate was obviously increased with the process of the hydrate formation under the action of CF. In the first 2 h, the rate of hydrate formation in the application of voltages was higher than that without voltage. We have known that the induction time could be shortened in the effect of CF based on the above discussion. More CO2 gas molecules were captured by the hydrate cage during this period. However, the rate of hydrate formation in the pure water system suddenly increased after 2 h. The relatively long induction time prolonged the time for many CO2 gas molecules entering the hydrate phase in the pure water system. The rate of hydrate growth depends on heat and mass transfer (Sloan et al., 2007). In the application of low voltages, anions and cations produced by electrolysis reaction and ions (CO32-/HCO3−) existing in the solution will migrate under the action of electric field force, which promotes the diffusion of CO2 and strengthens the formation of hydrate. However, when a high voltage (60 V) was applied to the system, the hydrate formation rate was significantly lower than that in other conditions. It may be due to the rising temperature of the system for more Joule heat generating at the higher voltage. Furthermore, the more production of metal cations may enhance the gas–liquid surface tension. Hence, these cause the decrease of gas consumption and hydrate formation rate after the induction period.
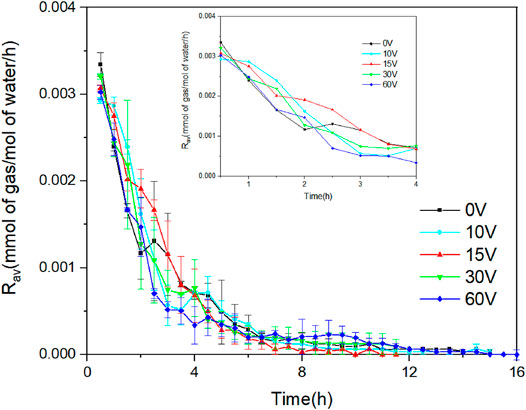
FIGURE 8. The average rate of hydrate formation in the application of different voltages at 3.5 MPa and 274.15 K
The microscopic schematic diagram of CO2 hydrate formation under the action of CF is shown in Figure 9A. The CO2 gas molecules were mainly distributed on the gas phase region at time 0. Under the action of stirring and CF, CO2 molecules gradually dissolved into the liquid phase and reacted with water to generate carbonic acid. Carbonic acid ionized H+, HCO3−, and CO32- ions. The anode electrolysis produced Fe3+, and the cathode produced H2 bubbles and OH− ions. Cations and anions migrated in opposite directions under the action of the electric field. The empty hybrid orbitals of Fe3+ formed coordination bonds with water molecules, promoting the ordered arrangement of water molecules. The generation of H2 bubbles could provide more locations for the nucleation CO2 hydrate. These all greatly increase the probability of CO2 hydrate nucleation. Meanwhile, the action of the electric field promotes heat and mass transfer to strengthen the growth of hydrates. However, part of electrical energy will be converted into thermal energy due to the resistors of the system in the application of high voltage. It will have a specific inhibition effect on the growth of hydrate.
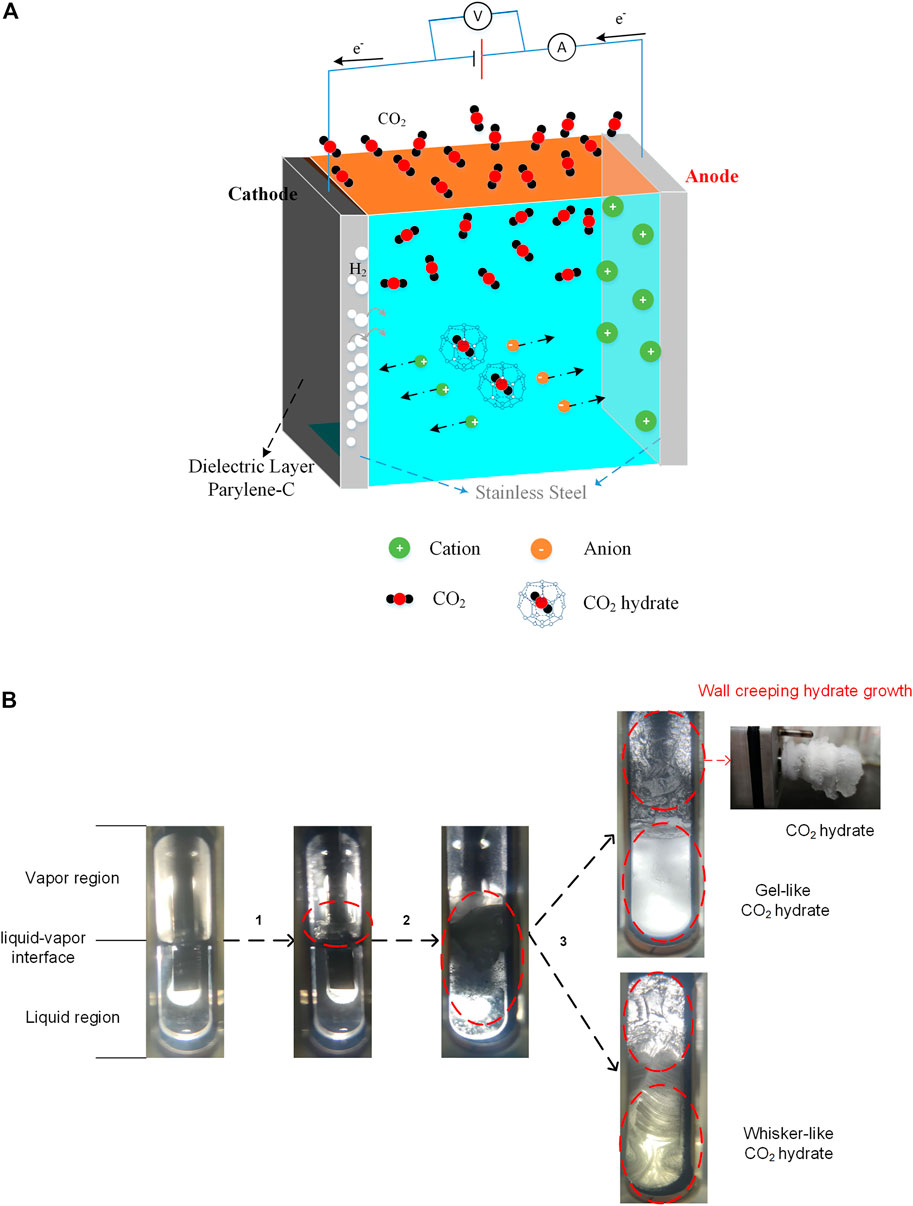
FIGURE 9. (A) The microscopic schematic diagram of CO2 hydrate formation in the application of voltages; (B) The formation process of CO2 hydrate under the action of CF.
The process of CO2 hydrate formation is shown in Figure 9B. The CO2 hydrate film firstly formed at the gas–liquid interface, and a small amount of hydrate was adsorbed on the stirring rod under the action of disturbance. Subsequently, the free CO2 gas in the vapor region and dissolved in water diffused to the hydrate layer, making the hydrate film thicker and thicker. In addition, the cavity in the hydrate film was gradually filled with CO2 gas, whereas many hydrates formed in the liquid phase region. Last, the CO2 hydrate distributed in the whole liquid phase zone. In addition to the hydrate formation in the liquid phase zone, the hydrate would form in the gas phase zone along the stirring rod until the whole rod was covered, which was called wall-creeping hydrate growth. The morphology characteristics of CO2 hydrate could be changed under the effect of CF. Gel-like CO2 hydrate crystals formed in the liquid phase when a low voltage (0–30 V) was applied. Differently, whisker-like CO2 hydrate crystals appeared in the liquid phase when the voltage of 60 V was applied. Tiny bubbles suspended in water under the action of mixing and low voltage, and the CO2 hydrate films gradually formed on the surfaces of these bubbles. During the process of stirring and bubble collision, bubbles could continuously generate and break. The hydrate film shells left by broken bubbles increased continuously, making the liquid phase of the system present milky gel-like shape. However, more Joule heat was produced because of the electrolysis in the application of 60 V voltage, which changes the supercooling degree of the system. At the same time, the generation of a certain amount of iron ions and hydrogen bubbles combining into iron hydroxide precipitation produce strong capillary action in the liquid phase and make the vapor pressure above the water pressure, which provides suitable conditions for the growth of whisker hydrate. However, the adsorption capillary channel is tiny; hence, the formation rate of whisker hydrate is low, which further verifies the previous results.
In this work, the CO2 hydrate formation process was studied with agitation of 450 rpm at an initial pressure of 3.5 MPa and a temperature of 274.15 K under the action of CF. The results show that the physical bubble behavior and electrochemistry mechanisms could affect the nucleation and formation process of CO2 hydrate in the application of voltage. The empty hybrid orbitals of Fe3+ produced by electrolysis form coordination bonds with water molecules to promote the ordered arrangement of water molecules during the CO2 hydrate nucleation process, and the growth and rupture of bubbles can disturb the system and increase the probability of CO2 hydrate nucleation. The induction time and semi-completion time of CO2 hydrate formation were decreased, respectively, by 51% and 27.8% in the application of 15 V. However, it is not conducive to the hydrate formation in the application of a higher voltage (60 V), which may attribute to the generation of more Joule heat and the enhancement of the gas–liquid surface tension of more production of metal cations. Besides, high voltage (60 V) could change the morphology characteristics of CO2 hydrate from gel-like to whisker-like due to changes in the degree of supercooling and strong capillary action. This study highlights the potential application of CF for gas hydrate formation. The results will help in developing successful technology for gas hydrate–based CO2.
The original contributions presented in the study are included in the article/supplementary material; further inquiries can be directed to the corresponding authors.
QZ: investigation and writing—original draft; Z-MX: conceptualization, methodology, and writing—reviewing and editing; C-GX: writing—reviewing and editing; Z-YC: funding acquisition; X-SL: conceptualization and funding acquisition.
This work is supported by Key Program of National Natural Science Foundation of China (51736009), National Natural Science Foundation of China (51879254), Fundamental Research and Applied Fundamental Research Major Project of Guangdong Province (2019B030302004 and 2020B0301030003), Guangdong Special Support Program-Local innovation and entrepreneurship team project (2019BT02L278), Special Project for Marine Economy Development of Guangdong Province (GDME-2018D002, GDME-2020D044), and general programs of the National Natural Science Foundation of Guangdong (2019A1515011730), which are gratefully acknowledged.
The authors declare that the research was conducted in the absence of any commercial or financial relationships that could be construed as a potential conflict of interest.
All claims expressed in this article are solely those of the authors and do not necessarily represent those of their affiliated organizations or those of the publisher, the editors, and the reviewers. Any product that may be evaluated in this article, or claim that may be made by its manufacturer, is not guaranteed or endorsed by the publisher.
Bhattacharjee, G., Kumar, A., Sakpal, T., and Kumar, R. (2015). Carbon Dioxide Sequestration: Influence of Porous Media on Hydrate Formation Kinetics. ACS Sustain. Chem. Eng. 3, 1205–1214. doi:10.1021/acssuschemeng.5b00171
Carpenter, K., and Bahadur, V. (2015). Electrofreezing of Water Droplets under Electrowetting Fields. Langmuir 31, 2243–2248. doi:10.1021/la504792n
Carpenter, K., and Bahadur, V. (2016). Electronucleation for Rapid and Controlled Formation of Hydrates. J. Phys. Chem. Lett. 7, 2465–2469. doi:10.1021/acs.jpclett.6b01166
Chen, B., Dong, H., Sun, H., Wang, P., and Yang, L. (2020). Effect of a Weak Electric Field on THF Hydrate Formation: Induction Time and Morphology. J. Pet. Sci. Eng. 194, 107486. doi:10.1016/j.petrol.2020.107486
Chernov, A. A., Pil’nik, A. A., Elistratov, D. S., Mezentsev, I. V., Meleshkin, A. V., Bartashevich, M. V., et al. (2017). New Hydrate Formation Methods in a Liquid-Gas Medium. Sci. Rep. 7, 40809. doi:10.1038/srep40809
Diamond, L. W., and Akinfiev, N. N. (2003). Solubility of CO2 in Water from −1.5 to 100 °C and from 0.1 to 100 MPa: Evaluation of Literature Data and Thermodynamic Modelling. Fluid Phase Equilibria 208, 265–290. doi:10.1016/s0378-3812(03)00041-4
Fujita, S., Watanabe, K., and Mori, Y. H. (2009). Clathrate-Hydrate Formation by Water Spraying onto a Porous Metal Plate Exuding a Hydrophobic Liquid Coolant. Aiche J. 55, 1056–1064. doi:10.1002/aic.11744
Hao, W., Wang, J., Fan, S., and Hao, W. (2007). Study on Methane Hydration Process in a Semi-Continuous Stirred Tank Reactor. Energ. Convers. Manage. 48, 954–960. doi:10.1016/j.enconman.2006.08.007
He, Y., Rudolph, E. S. J., Zitha, P. L. J., and Golombok, M. (2011). Kinetics of CO2CO2 and Methane Hydrate Formation: An Experimental Analysis in the Bulk Phase. Fuel 90, 272–279. doi:10.1016/j.fuel.2010.09.032
Hozumi, T., Saito, A., Okawa, S., and Watanabe, K. (2003). Effects of Electrode Materials on Freezing of Supercooled Water in Electric Freeze Control. Int. J. Refrigeration 26, 537–542. doi:10.1016/s0140-7007(03)00008-2
Huang, D. (2005). Measuring and Modeling Thermal Conductivity of Gas Hydrate-Bearing Sand. J. Geophys. Res. 110, B01311. doi:10.1029/2004jb003314
Kumano, H., Hirata, T., Mitsuishi, K., and Ueno, K. (2012). Experimental Study on Effect of Electric Field on Hydrate Nucleation in Supercooled Tetra-N-Butyl Ammonium Bromide Aqueous Solution. Int. J. Refrigeration 35, 1266–1274. doi:10.1016/j.ijrefrig.2012.03.005
Lee, H. J., Lee, J. D., Linga, P., Englezos, P., Kim, Y. S., Lee, M. S., et al. (2010). Gas Hydrate Formation Process for Pre-Combustion Capture of Carbon Dioxide. Energy 35, 2729–2733. doi:10.1016/j.energy.2009.05.026
Li, X.-S., Xia, Z.-M., Chen, Z.-Y., Yan, K.-F., Li, G., and Wu, H.-J. (2010). Equilibrium Hydrate Formation Conditions for the Mixtures of CO2 + H2 + Tetrabutyl Ammonium Bromide. J. Chem. Eng. Data 55, 2180–2184. doi:10.1021/je900758t
Linga, P., Adeyemo, A., and Englezos, P. (2008). Medium-Pressure Clathrate Hydrate/Membrane Hybrid Process for Postcombustion Capture of Carbon Dioxide. Environ. Sci. Technol. 42, 315–320. doi:10.1021/es071824k
Linga, P., Daraboina, N., Ripmeester, J. A., and Englezos, P. (2012). Enhanced Rate of Gas Hydrate Formation in a Fixed Bed Column Filled with Sand Compared to a Stirred Vessel. Chem. Eng. Sci. 68, 617–623. doi:10.1016/j.ces.2011.10.030
Linga, P., Kumar, R., Lee, J. D., Ripmeester, J., and Englezos, P. (2010). A New Apparatus to Enhance the Rate of Gas Hydrate Formation: Application to Capture of Carbon Dioxide. Int. J. Greenhouse Gas Control. 4, 630–637. doi:10.1016/j.ijggc.2009.12.014
Luo, Y.-T., Zhu, J.-H., Fan, S.-S., and Chen, G.-J. (2007). Study on the Kinetics of Hydrate Formation in a Bubble Column. Chem. Eng. Sci. 62, 1000–1009. doi:10.1016/j.ces.2006.11.004
Mauk Smith, J., Van Ness, H. C., Abbott, M. M., and Thomas Swihart, M. (2000). Introduction to Chemical Engineering Thermodynamics. New York, US: McGraw-Hill Education, 27, e62–e70.
Mohammadi, A., Manteghian, M., Haghtalab, A., Mohammadi, A. H., and Rahmati-Abkenar, M. (2014). Kinetic Study of Carbon Dioxide Hydrate Formation in Presence of Silver Nanoparticles and SDS. Chem. Eng. J. 237, 387–395. doi:10.1016/j.cej.2013.09.026
Mori, Y. (2015). On the Scale-Up of Gas-Hydrate-Forming Reactors: The Case of Gas-Dispersion-Type Reactors. Energies 8, 1317–1335. doi:10.3390/en8021317
Ohmura, R., Kashiwazaki, S., Shiota, S., Tsuji, H., and Mori, Y. H. (2002). Structure-I and Structure-H Hydrate Formation Using Water Spraying. Energy Fuels 16, 1141–1147. doi:10.1021/ef0200727
Orlowska, M., Havet, M., and Le-Bail, A. (2009). Controlled Ice Nucleation under High Voltage DC Electrostatic Field Conditions. Food Res. Int. 42, 879–884. doi:10.1016/j.foodres.2009.03.015
Pahlavanzadeh, H., Hejazi, S., and Manteghian, M. (2020a). Hydrate Formation under Static and Pulsed Electric fields. J. Nat. Gas Sci. Eng. 77, 103232. doi:10.1016/j.jngse.2020.103232
Pahlavanzadeh, H., Javidani, A. M., Ganji, H., and Mohammadi, A. (2020b). Investigation of the Effect of NaCl on the Kinetics of R410a Hydrate Formation in the Presence and Absence of Cyclopentane with Potential Application in Hydrate-Based Desalination. Ind. Eng. Chem. Res. 59, 14115–14125. doi:10.1021/acs.iecr.0c02504
Park, T., and Kwon, T.-H. (2018). Effect of Electric Field on Gas Hydrate Nucleation Kinetics: Evidence for the Enhanced Kinetics of Hydrate Nucleation by Negatively Charged Clay Surfaces. Environ. Sci. Technol. 52, 3267–3274. doi:10.1021/acs.est.7b05477
Shahriari, A., Acharya, P. V., Carpenter, K., and Bahadur, V. (2017). Metal-Foam-Based Ultrafast Electronucleation of Hydrates at Low Voltages. Langmuir 33, 5652–5656. doi:10.1021/acs.langmuir.7b00913
Sloan, E. D., Koh, C. A., and Koh, C. A. (2007). Clathrate Hydrates of Natural Gases. Boca Raton, Florida, US: Taylor & Francis CRC Press.
Soon, W., Baliunas, S., Robinson, A., and Robinson, Z. (1999). Environmental Effects of Increased Atmospheric Carbon Dioxide. Clim. Res. 13, 149–164. doi:10.3354/cr013149
Wei, S., Xiaobin, X., Hong, Z., and Chuanxiang, X. (2008). Effects of Dipole Polarization of Water Molecules on Ice Formation under an Electrostatic Field. Cryobiology 56, 93–99. doi:10.1016/j.cryobiol.2007.10.173
Xia, Z.-M., Li, X.-S., Chen, Z.-Y., Li, G., Cai, J., Wang, Y., et al. (2017). Hydrate-Based Acidic Gases Capture for Clean Methane with New Synergic Additives. Appl. Energ. 207, 584–593. doi:10.1016/j.apenergy.2017.06.017
Xia, Z.-M., Li, X.-S., Chen, Z.-Y., Li, G., Yan, K.-F., Xu, C.-G., et al. (2016). Hydrate-Based CO2 Capture and CH4 Purification from Simulated Biogas with Synergic Additives Based on Gas Solvent. Appl. Energ. 162, 1153–1159. doi:10.1016/j.apenergy.2015.02.016
Xu, C.-G., Li, X.-S., Lv, Q.-N., Chen, Z.-Y., and Cai, J. (2012). Hydrate-Based CO2 (Carbon Dioxide) Capture from IGCC (Integrated Gasification Combined Cycle) Synthesis Gas Using Bubble Method with a Set of Visual Equipment. Energy 44, 358–366. doi:10.1016/j.energy.2012.06.021
Xu, C.-G., Yu, Y.-S., Ding, Y.-L., Cai, J., and Li, X.-S. (2017). The Effect of Hydrate Promoters on Gas Uptake. Phys. Chem. Chem. Phys. 19, 21769–21776. doi:10.1039/c7cp02173a
Yang, H., Xu, Z., Fan, M., Gupta, R., Slimane, R. B., Bland, A. E., et al. (2008). Progress in Carbon Dioxide Separation and Capture: A Review. J. Environ. Sci. 20, 14–27. doi:10.1016/s1001-0742(08)60002-9
Zatsepina, O. Y., and Buffett, B. A. (2001). Experimental Study of the Stability of CO2-Hydrate in a Porous Medium. Fluid Phase Equilibria 192, 85–102. doi:10.1016/S0378-3812(01)00636-7
Zhang, J. S., Lee, S., and Lee, J. W. (2007). Kinetics of Methane Hydrate Formation from SDS Solution. Ind. Eng. Chem. Res. 46, 6353–6359. doi:10.1021/ie070627r
Keywords: carbon dioxide, gas hydrate, direct current–voltage, charge flow, kinetics
Citation: Zhao Q, Xia Z-M, Xu C-G, Chen Z-Y and Li X-S (2021) Influence of Direct Current–Voltage Accompanied by Charge Flow on CO2 Hydrate Formation. Front. Energy Res. 9:770599. doi: 10.3389/fenrg.2021.770599
Received: 04 September 2021; Accepted: 07 October 2021;
Published: 15 November 2021.
Edited by:
Greeshma Gadikota, Cornell University, United StatesReviewed by:
Sohaib Mohammed, Cornell University, United StatesCopyright © 2021 Zhao, Xia, Xu, Chen and Li. This is an open-access article distributed under the terms of the Creative Commons Attribution License (CC BY). The use, distribution or reproduction in other forums is permitted, provided the original author(s) and the copyright owner(s) are credited and that the original publication in this journal is cited, in accordance with accepted academic practice. No use, distribution or reproduction is permitted which does not comply with these terms.
*Correspondence: Xiao-Sen Li, bGl4c0Btcy5naWVjLmFjLmNu; Zhi-Ming Xia, eGlhem1AbXMuZ2llYy5hYy5jbg==
Disclaimer: All claims expressed in this article are solely those of the authors and do not necessarily represent those of their affiliated organizations, or those of the publisher, the editors and the reviewers. Any product that may be evaluated in this article or claim that may be made by its manufacturer is not guaranteed or endorsed by the publisher.
Research integrity at Frontiers
Learn more about the work of our research integrity team to safeguard the quality of each article we publish.