Abstract
This paper studies the tolerance of electromagnetic relay (EMR) under voltage sag and short interruptions on the basis of response mechanism analysis and the extensive tests. First, it introduces the structure of EMR and proposes response mechanism of EMR under voltage sag. Then, a detailed test plan is presented, including the information of test platform, testing condition, EMRs used in test, list of test, test procedure, and the measured waveforms. Magnitude and duration of the sags are not only the characteristics to be considered to investigate EMR’s tolerance. The other factors, which may have significance influence on tolerance of EMR, are considered here, including point-on-wave (POW), phase angle jump (PAJ), harmonic, magnitude variation in pre- and post-sag segments, two-stage sag, and slow recovery sag. Extensive tests results are presented in the form of voltage-tolerance curves (VTCs). Besides magnitude and duration, POW, PAJ, and two-stage sag have a significant influence on the tolerance of EMR. Other factors only have a tiny impact on the tolerance of EMR. The results show that the magnitude tolerance of EMR is 48–74% of Unom, and duration tolerance is 5–28 ms; they are useful for the technical assessment of EMR’s tolerance to voltage sags and short interruptions, and for the economic assessment of the industry process trip due to its disengagement. Test results also benefit for choosing proper EMR and mitigation device in the complicated operating environment.
1 Introduction
Electromagnetic relay (EMR) is widely applied in industrial control system and communication as a kind of basic electric component, also playing a role in switching circuits, transferring signals, and eliminating interference. However, when a short-circuit fault occurs in the power system, it causes power quality issues, such as voltage sag and short interruption (Nagata et al., 2018; Wang et al., 2019; Ye et al., 2019), which affect the normal operation of EMR. Voltage sag even causes the malfunction and damage of EMR in severe cases (Wu and Fan, 2015; Jianbo and Qi, 2018), then leading to the failure of the whole industrial process and resulting in the huge economic losses (Mohammadi et al., 2017; De Santis et al., 2018; Gambôa et al., 2019). For example, (Bollen, 2000) records that the tripping of EMR under one voltage sag event “cause the shutdown of a large chemical plant, leading to perhaps $100,000 in lost production.” However, the tolerance of EMR under voltage sag presented in Bollen (2000) is from IEEE Std. 1346 (IEEE, 1998) which published the sensitivity of EMR 20 years ago. The data in IEEE Std. 1346 may be not suited for the industry today, because of the improvement of the technique of EMR and the updating industry processes. It is important to understand the tolerance of EMR under voltage sag nowadays to provide the voltage sag mitigation scheme and the EMR purchase plan for the industry users.
EMR is known as the sensitive equipment under voltage sag because of industrial users’ complain (IEEE, 1998; Bollen, 2000; Zhai and Yang, 2008). IEEE Std. 1346 (IEEE, 1998) pays close attention to it and present that tolerance of EMR is 60–75% of rated voltage of magnitude, and is 10–30 ms of duration; however, this standard states that the presented tolerance “should not be considered typical for these types of devices but only a samples of what is available.” It is difficult to provide the detailed guide for the users. The simulation was done to investigate the dynamic characteristics of EMR interfered by voltage sags and short interruptions to offer the qualitative understanding of the sensitivity of EMR (Zhai and Yang, 2008). It is a necessary way to get the tolerance information of sensitive equipment than conducting the extensive tests on equipment. The tolerance of other sensitive equipment is also obtained through test, for example, the tests on adjustable speed drive (ASD) (Xu et al., 2019a), programmable logic controller (PLC) (Xu et al., 2019b), AC coil contactor (ACC) (Djokic et al., 2004; Hardi et al., 2010; Weldemariam et al., 2016), and so on (Ouyang et al., 2015; Ouyang and Liu, 2017).
The different single-event characteristics of voltage sag is considered in the test. Magnitude and duration are the essential characteristics which should be included in the test. Furthermore, other characteristics should be included, such as point-on-wave (Alvaro et al., 2019; Wang et al., 2020) and phase angle jump (PAJ) (Wang et al., 2015). The former is also called phase angle, and the latter is called phase shift in IEC 61000-4-30 (IEC, 2021). POW is the phase angle of the fundamental voltage waveform at which the voltage sag occurs; PAJ is the change of phase angle during the voltage sag (Djoki et al., 2007; Wang et al., 2015; IEEE, 2017; Alvaro et al., 2019; Wang et al., 2020; Ren et al., 2021). There are two views about considering the other characteristics. For one thing, IEEE Std. 1346 recommends that “phase shift and point of initiation not be considered,” since these “characteristics are not typically available in the sag environment data.” However, for the improvement of the voltage sag generator and the monitor technical, the problem of “sag environment data” has not been the barrier of the testing. Another opinion is that POW and PAJ have significant impacts on electromagnetic equipment (Djoki et al., 2007; Wang et al., 2015; Alvaro et al., 2019; Wang et al., 2020; Ren et al., 2021); similar thinking is also recommended in the standards. IEC 61000-4-30 (IEC, 2021) states that for some equipment “drop-outs, the phase angle at which a voltage dip begins is an important characteristic”; IEEE Std. 1668-2017 (IEEE, 2017), which is the newest standard related to testing on the sensitive equipment under voltage sag, suggests that “…characteristics such as phase-shift, point-on-wave of initiation, and recovery of the instantaneous voltage waveform during the sag may have an effect on equipment performance as well.” Thus, the various single-event characteristics of voltage sag are included in this paper to test the sensitivity of EMR.
This paper proposes a general test procedure and has done extensive tests to investigate the tolerance of EMR to get the quantitative results and support the voltage sag mitigation for EMR. The rest of this paper is organized as follows. Section 2 describes the structure and response mechanism of EMR. Detailed test plan is elaborated in Section 3, including test principle, test procedure, equipment under test (EUT), and voltage sag generator. Test results are presented in the form of voltage tolerance curves in Section 4. Section 5 discusses the potential application, and Section 6 makes a conclusion of the test results.
2 Structure and Response Mechanism
2.1 Structure of Electromagnetic Relay
The structure sketch of EMR is shown in Figure 1 (Fan and Wu, 2014). It is mainly composed by an iron core, AC coils, an armature, return springs, and contact system, similar to the structure of ACC. Contact system contains three types of contacts: a normally open contact (NO), a normally closed contact (NC), and a common contact (CO); their positions are also shown in Figure 1.
FIGURE 1

The structure of EMR.
When a certain voltage is supplied to the coil, an electromagnetic force (Fmag) is generated. Then, the armature is attracted toward to iron core as Fmag is greater than the force of spring (Fs). Then, the circuit is turned on. On the other hand, when the coil is de-energized, Fmag disappears but the Fs still exists. Then, armature returns to its original position, causing the circuit turned off. The whole working process is shown in Figure 2. Once a voltage sag occurs in the process, it causes EMR to work unnormal.
FIGURE 2
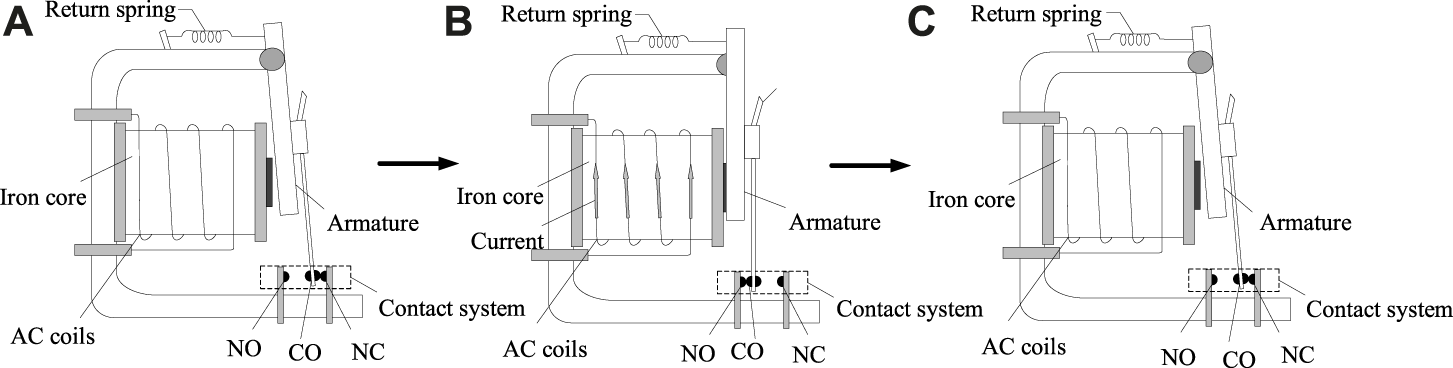
Working principle of EMR. (A) EMR is not energized. (B) EMR is energized. (C) EMR is de-energized.
EMR and ACC are both basic electromagnetic equipment in the control systems, and their structures are similar. However, EMR is generally used for the control loop, whose operating current is small, only a few Amps; ACC is often used for main circuit control, commonly being used to control the start and stop of the motor, etc., and its rated current is greater, even up to several thousand Amps, so an arc extinguishing device is needed for ACC. The behaviors of EMR and ACC under voltage sag are different due to the arc extinguishing device, coil turn number, and so on. The research results on behavior of ACC under voltage sag cannot be used as the result of study on EMR, and the knowledge of behavior of EMR under voltage sag is limited.
2.2 Response Mechanism of Electromagnetic Relay to Voltage Sag
When the sinusoidal AC power is supplied, the main flux of the ac coil changes sinusoidally with time:
The Fmag can be calculated by Maxwell’s electromagnetic force formula:where S is magnetic attraction area at air gap, is vacuum permeability.
Thus, according to Eqs 1, 2, Fmag can be written as
Therefore, the Fmag is proportional to the square of the main flux. The Fmag changes versus time at twice voltage frequency.
Figure 3 shows the waveform of Fmag in blue and Fs in red during a voltage sag. In this case, the operation of EMR is influenced by the sag. Before sag starts, Fmag is greater than Fs, and EMR operates normally. When a sag occurs at time t1, Fmag is gradually reduced; however, Fmag is still greater than Fs until time t2, and EMR operates normally from t1 to t2. Fmag is less than Fs from t2, and EMR is disengaged from t2 to t3. The sag ends at t3, and EMR recovers to operate normally.
FIGURE 3
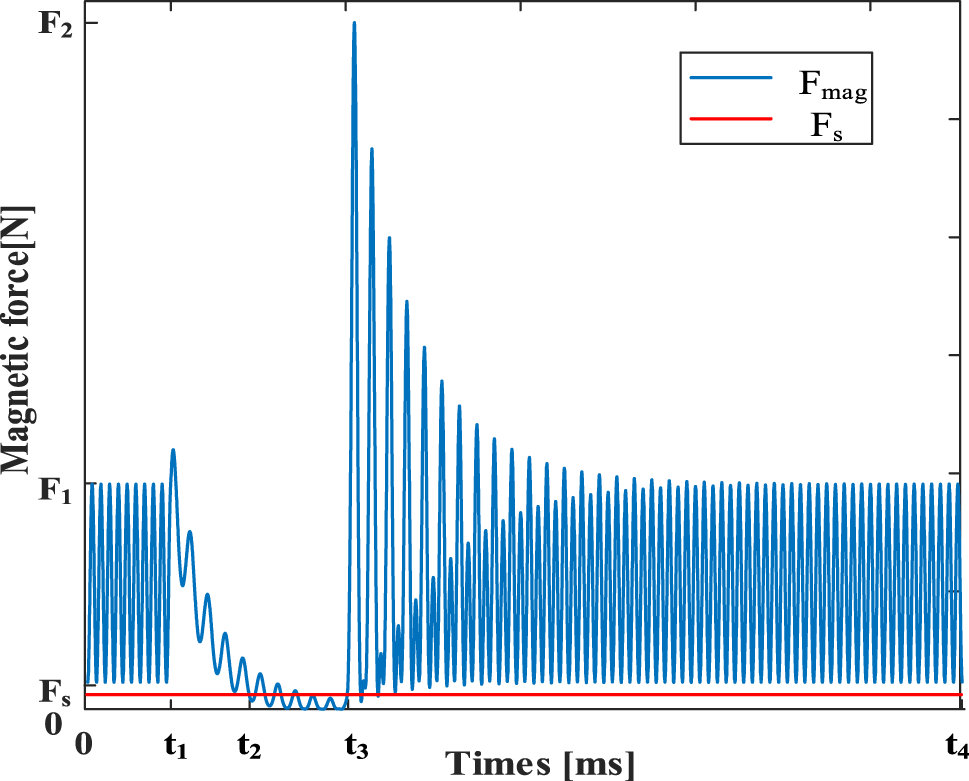
The curves of the electromagnetic Force (Fmag) and the force of spring (Fs).
It indicates that when the sag duration is too long, causing Fmag less than Fs, EMR trips (Wu and Fan, 2015). Of course, when voltage sag magnitude is above a certain level, Fmag keeps higher than Fs no matter how long the sag lasts, and the EMR can work steadily (Zhai and Yang, 2008). In other words, to ensure that the EMR works normally when powered, Fmag should be greater than Fs. Thus, it is necessary to know and quantify the EMR’s tolerance to voltage sag.
Moreover, different POW and PAJ influence EMR’s main flux, thereby affecting the change of Fmag. It means that POW and PAJ may influence EMR’s tolerance, so this paper considers these characteristics in the test. According to Eq. 3, Fmag is related to voltage frequency, so harmonic and frequency fluctuation are also in consideration. In Section 3, a detailed schedule is presented to investigate the EMR’s tolerance to various conditions.
3 Test Plan
3.1 Test Platform
Based on EMR’s structure and its response mechanism, the test circuit is connected as shown in Figure 4. The test platform consisted of the console, voltage sag generator (programmable power supply MX45), the data acquisition device (DEWE-510), EUT, DC supply source, and the lamp load.
FIGURE 4
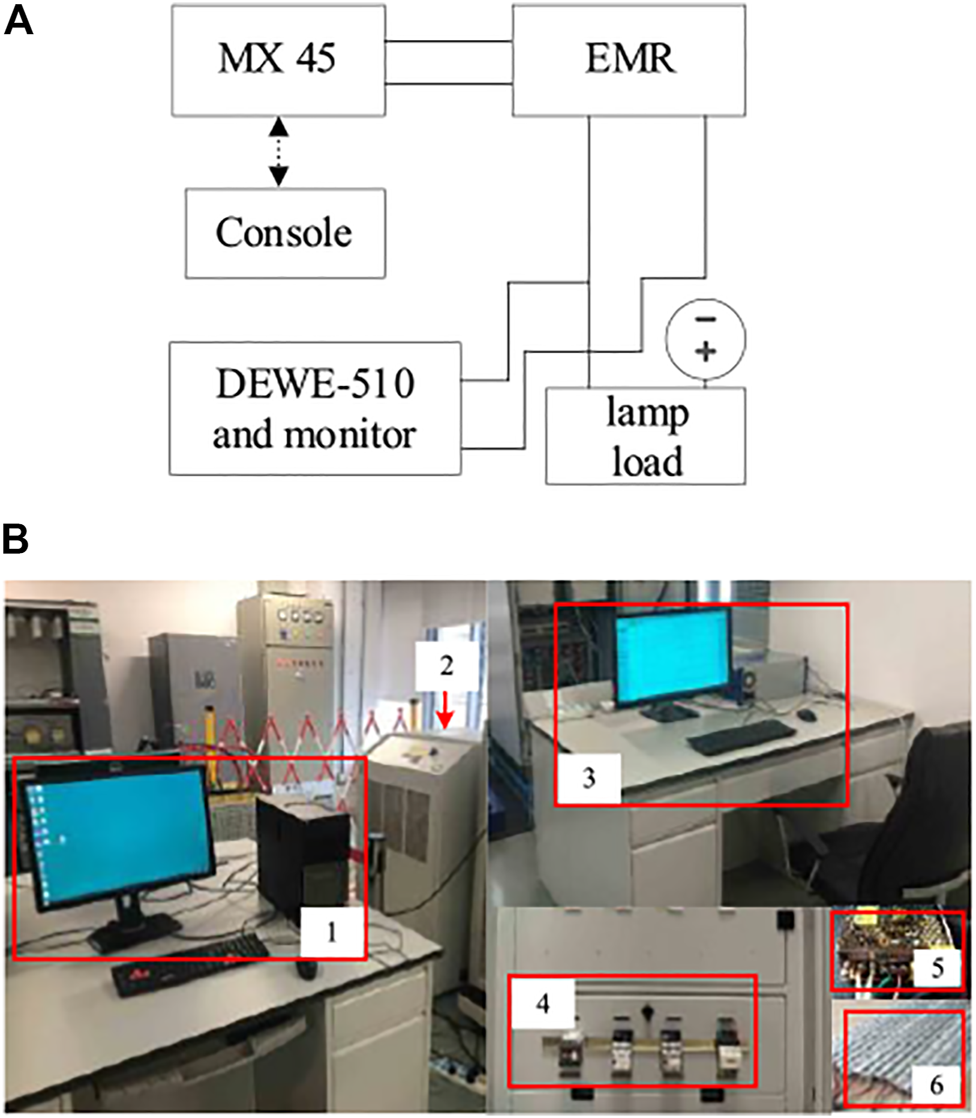
Test circuit. (A) The connection of the test for EMR. (B) Test platform (1. console, 2. programmable power supply (MX45), 3. data acquisition device DEWE-510 and its Display, 4. EMR, 5. DC supply source, 6. lamp load).
Programmable power supply MX45 (AMETEK, 2017), whose brand is AMETAK, is used as the sag generator here. The voltage output range is 0∼400 V, and the maximum output power is 45 kVA; single and three phase mode are available. It meets the voltage sag generator requirements in IEEE 1668-2017 (IEEE, 2017), and MX45 can generate any voltage sag waveform designed by setting. In the test, the voltage waveform from MX45 is measured by the acquisition device. The measured single-event characteristics of the generated voltage sag are consistent with the setting value on the voltage sag generator.
The EUT is EMR, which is energized from one of the phases of MX45 (phase-A), since it is single-phase equipment. Thus, the test platform is a single-phase system.
3.2 Testing Condition and Equipment Under Test
The sensitivity is determined by two major factors: the design of the equipment and the physical characteristics of the voltage sag (IEEE, 2017). It suggests that different brands of the same equipment, and even different models of the same brand, often have different sensitivity to voltage sag. Eight EMRs from seven different manufactures are selected as EUT in the tests, in order to ensure a high degree of reliability and quantify the tolerance to voltage sag in the general way. The list of EUT is given in Table 1, with the information of EMR’s nominal voltage (Unom) and nominal current (Inom).
TABLE 1
| EUT | Unom (V) | Inom (A) | Manufacturer |
|---|---|---|---|
| R1 | 220 | 5 | OMRON |
| R2 | 220 | 5 | OMRON |
| R3 | 230 | 5 | ABB |
| R4 | 230 | 5 | Schneider |
| R5 | 220 | 5 | IDEC |
| R6 | 220 | 10 | IDEC |
| R7 | 220 | 5 | Chint |
| R8 | 220 | 5 | DELIXI |
The main parameters of EUT.
EMRs are connected with a load circuit as a switch. A resistive lamp is used as the load here, supplied by a DC supply source (24 V). In all tests, EMR is supplied by MX45, 100% of Unom is supplied to EMR during the pre-and post-sag segments, and a voltage sag is supplied to EMR during the sag segment. DEWE-510 was used to monitor the voltage on the lamp load. When a voltage sag causes EMR tripping, the voltage is about 0 V. The voltage indicates the behavior of EMR under voltage sag.
3.3 List of Test
The effect by rectangular and non-rectangular voltage sags is investigated.
EMRs are first tested against simple rectangular voltage sags, which are with different POW or PAJ, supplied from an ideal voltage source.
Then, another complicated voltage wave-forms, supplied from a non-ideal voltage source, is tested. These voltage sags include sags with a frequency variation up to ±2%, sags with a harmonic content (THD up to 12%), and sags with the magnitude variation up to ±10% in pre- and post-sag segments.
Lastly, the influence of various two-stage voltage sags, as well as the slow recovery sags, is investigated. Table 2 summarizes the influence factor of this test.
TABLE 2
| Test condition | Sag characteristics setting detailed |
|---|---|
| Rectangular voltage sag | Sag with POW (0° POW, 27° POW, 45° POW, 63° POW, 90° POW) |
| Sag with PAJ (0° PAJ, 30° PAJ, 60° PAJ, 90° PAJ) | |
| Sag with a frequency variation up to ±2% | |
| Sag with a harmonic content (THD up to 12%) | |
| Sag with the magnitude variation in pre- and post-sag segments (up to ±10%) | |
| Non-rectangular voltage sag | Two-stage voltage sags |
| The slow recovery sags (voltage recovery gradient: 10, 20, 30, 40, 50 V/s) |
Factors considered in the tests.
3.4 Test Procedure
In order to get the accurate test results, the test is done according to the test procedure. The following procedure is used in tests with rectangular voltage sags, and it is presented as the general test procedure for the sensitive equipment under voltage sag.
3.4.1 Set the Influence Factors and the Ranges of Them for the Test
There are three main factors for EMR, including magnitude, duration, and POW; the non-main factors are PAJ, frequency variation, harmonic distortion, and magnitude variation. It is planned that the maximum and minimum magnitudes of voltage sag for testing are 90 and 0%; the two values are decided according to the definition of voltage sag. The maximum and minimum durations for testing are 2 and 0 ms, respectively; the tolerance of duration of all EUT in the current research is less than 2 s; thus, 2 s is as the maximum duration. The test step sizes are 2% and 2 ms for magnitude and duration, respectively. The step sizes for other influence factors are in Table 2.
The main and non-main factors for the different EUT can be different; it depends on the response characteristics of the different EUT under voltage sag. The factors in Table 2 are suitable for most single-phase equipment; however, the type of voltage sag, which is not mentioned in Table 2, should be the important factor in the test for three-phase equipment.
3.4.2 Generate Voltage Sag and Test
The generated voltage sag is with the different single-event characteristics, as shown in Figure 5; the three main factors keep constant when changing the non-main factor. Take PAJ setting as example, when setting magnitude = 50%, duration = 100 ms, POW = 45°, the step is to set PAJ equals 0°, 30°, 60°, 90° in order, and record the test result. Then, change POW to 63° (magnitude and duration remain unchanged), and then test the EUT under the voltage sag with PAJ equals 0°, 30°, 60°, 90°, respectively. After finishing the test with considering the effect by PAJ, then do the tests considering the effect by the other non-main factors. Considering all the factors in four loops in Figure 5, test the behavior of the EUT under the voltage sag with the different factors.
FIGURE 5
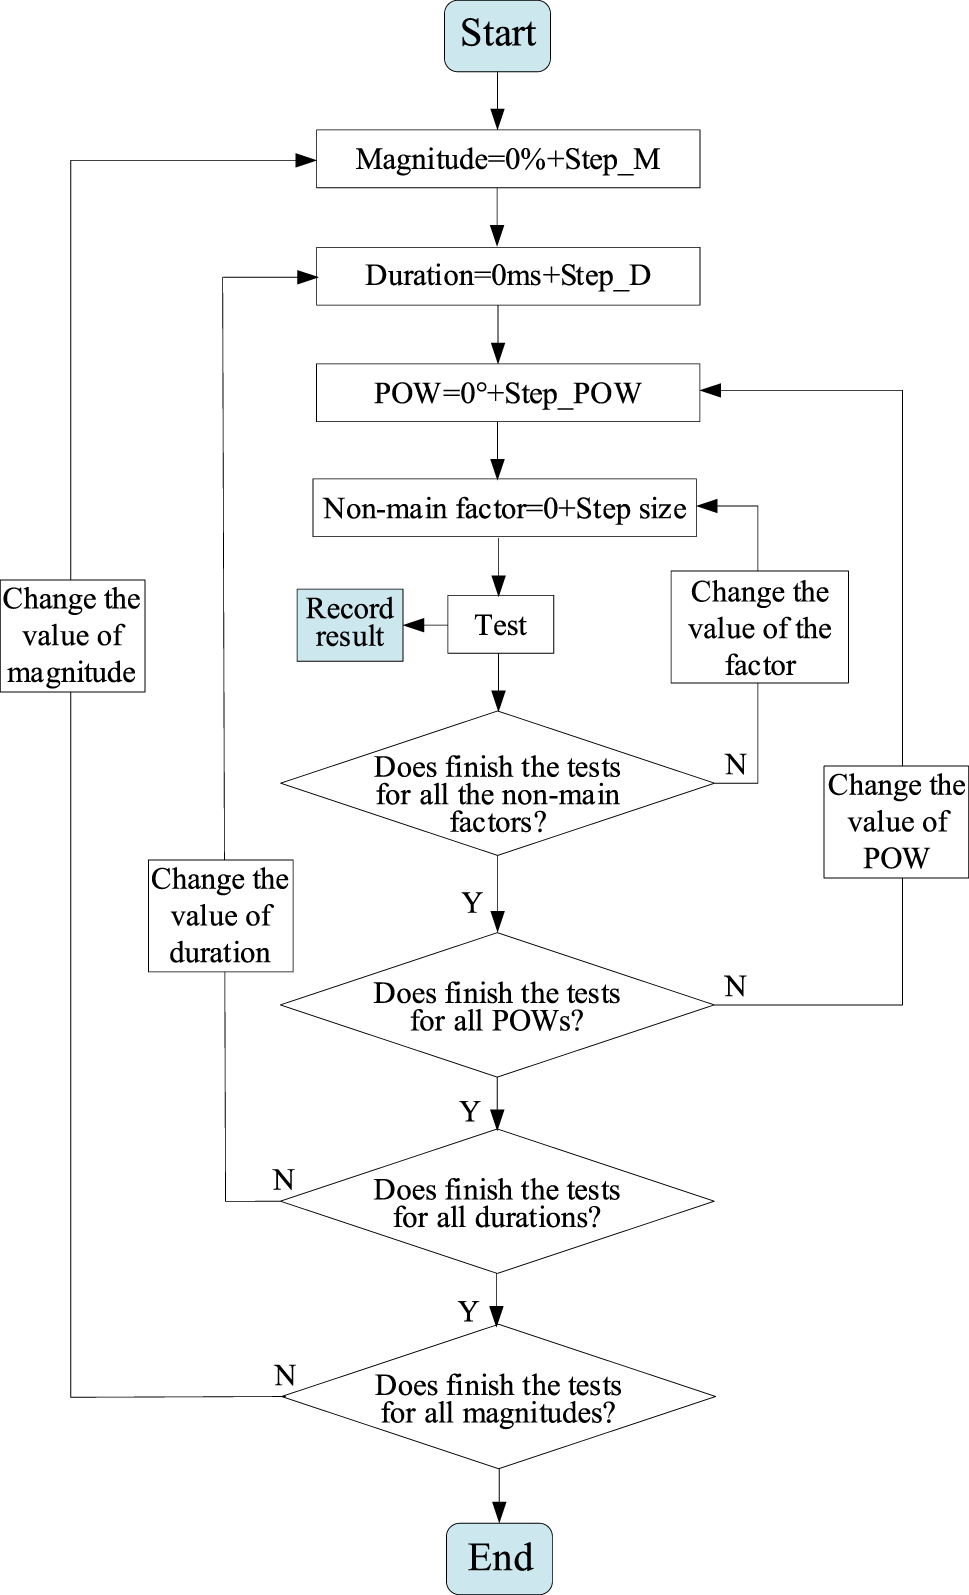
The steps of the test.
3.4.3 Tripping Criterion
The voltage sag generator generates voltage sag to supply EUT, and the states of EUT and the lamp load are recorded as the tripping criterion for EUT. The tripping criterion can be different for different EUT, for example, the dc voltage, current, or rotor speed can be options for tripping criterion of ASD. VTC can be drawn after all the tests were done.
The detailed test procedure may be different for the different EUT. The non-main factors are not necessary for all the EUT. It depends on the different structure and working condition.
3.5 The Measured Waveforms
The measured time-varying waveforms are shown in Figure 6 as an example. The top panels of Figures 6A,B are the generated voltage sag waveforms; the bottoms are the voltage of the tested lamp. There is a voltage sag generated by MX45; the single-event characteristics of it are 20% of Unom magnitude, 20 ms duration, 30° POW, and 30° PAJ; the voltage versus time is shown in the top of Figure 6A. The supplied voltage of lamp is recorded by the oscilloscope, which is about 24 V, shown in the bottom panel in Figure 6A; the lamp keeps working normally. EMR can tolerate this voltage sag. However, when the duration extends to 60 ms (shown in the top panel in Figure 6B), the other single-event characteristics of the voltage sag in Figure 6B are the same as the voltage sag in Figure 6A; the EMR fails in Figure 6B. EMR can tolerate about 20–25 ms, and then it fails; the load cannot keep working since the supply voltage of the load decrease to 0 V.
FIGURE 6
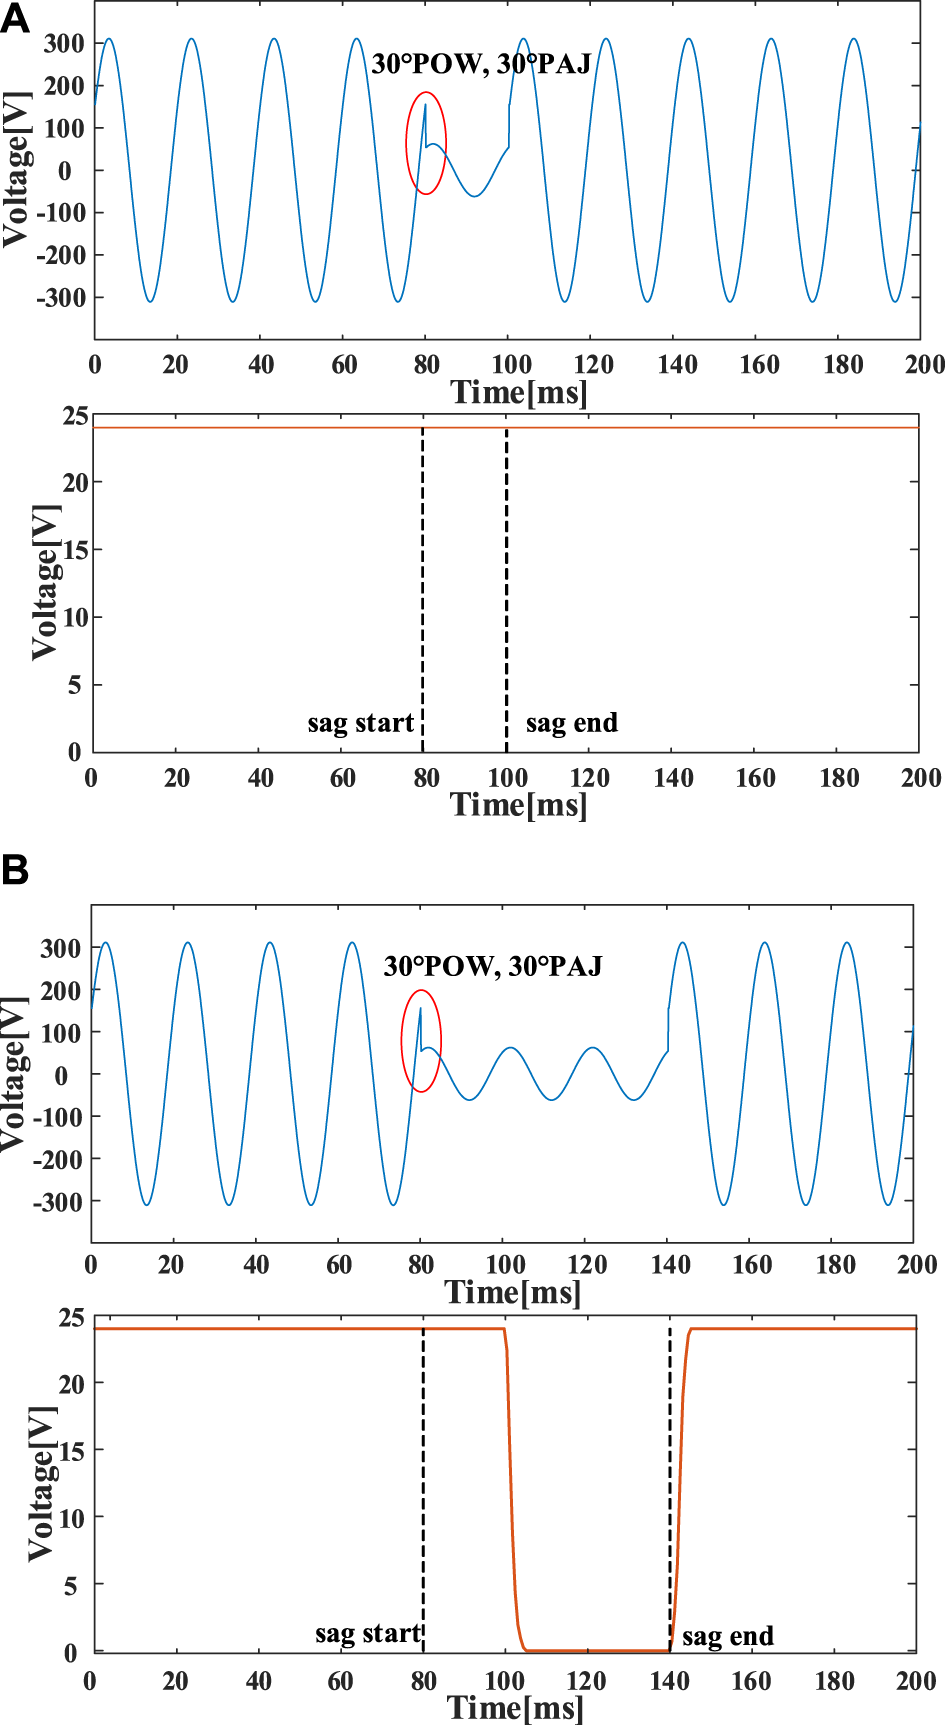
The measured time-varying wave-forms. (A) EMR don’t trip, (B) EMR trip.
The two examples in Figure 6 are the typical waveforms of the tests. The extensive tests show that the longer the duration or the lower magnitude of voltage sag, the greater probability of EMR tripping. The detailed results of the test are shown in Section 4.
4 Test Results
4.1 Testing of Electromagnetic Relay to Rectangular Voltage Sags
4.1.1 Quarter-Cycle Symmetry Respect to Point-on-Wave
The results of test are presented graphically by VTCs. The detailed test results for R1 are shown in Figure 7. VTCs of 0° POW, 180° POW, and 360° POW are quite close. VTCs of 90° POW and 270° POW are nearly the same. Furthermore, though there is a slight difference in VTCs of 45°, 135°, 225°, and 315° POW, they are almost coincident of the shape. It describes EMR’s quarter-cycle symmetry. Thus, the sensitivity of EMRs is illustrated only for POW between 0° and 90° (0° POW, 27° POW, 45° POW, 63° POW, 90° POW are tested in this paper).
FIGURE 7
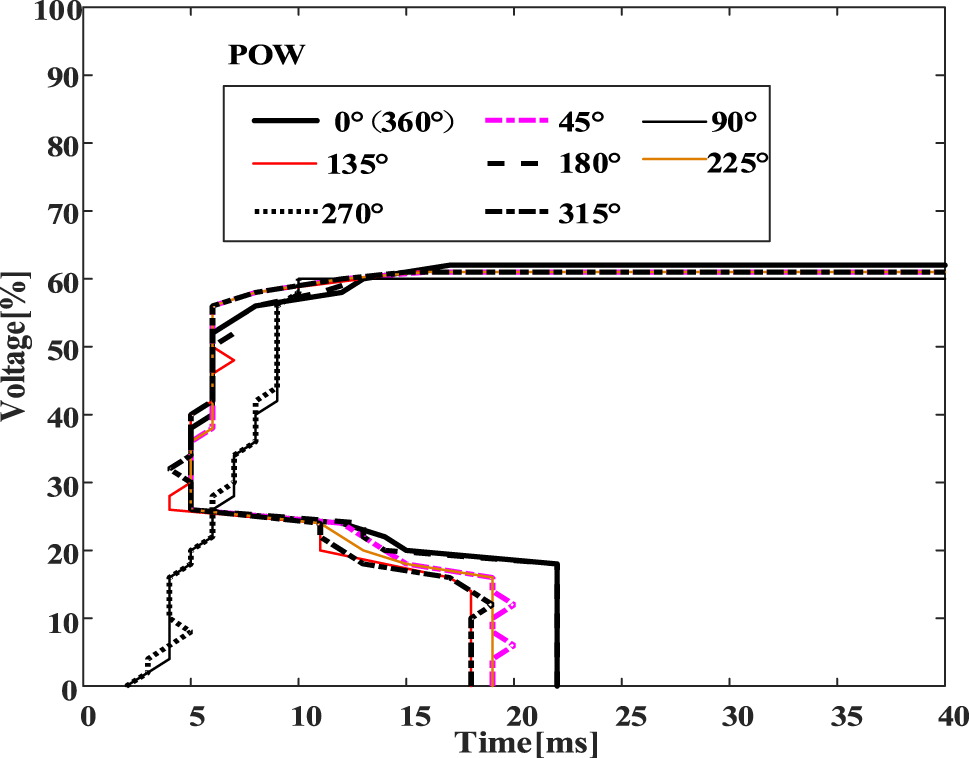
Illustration of quarter-cycle symmetry (R1, 0° PAJ).
4.1.2 Sensitivity to Point-on-Wave
The sensitivity of EMR to POW is tested and shown in Figure 8. POW has a greater influence on the sensitivity of EMR.
FIGURE 8
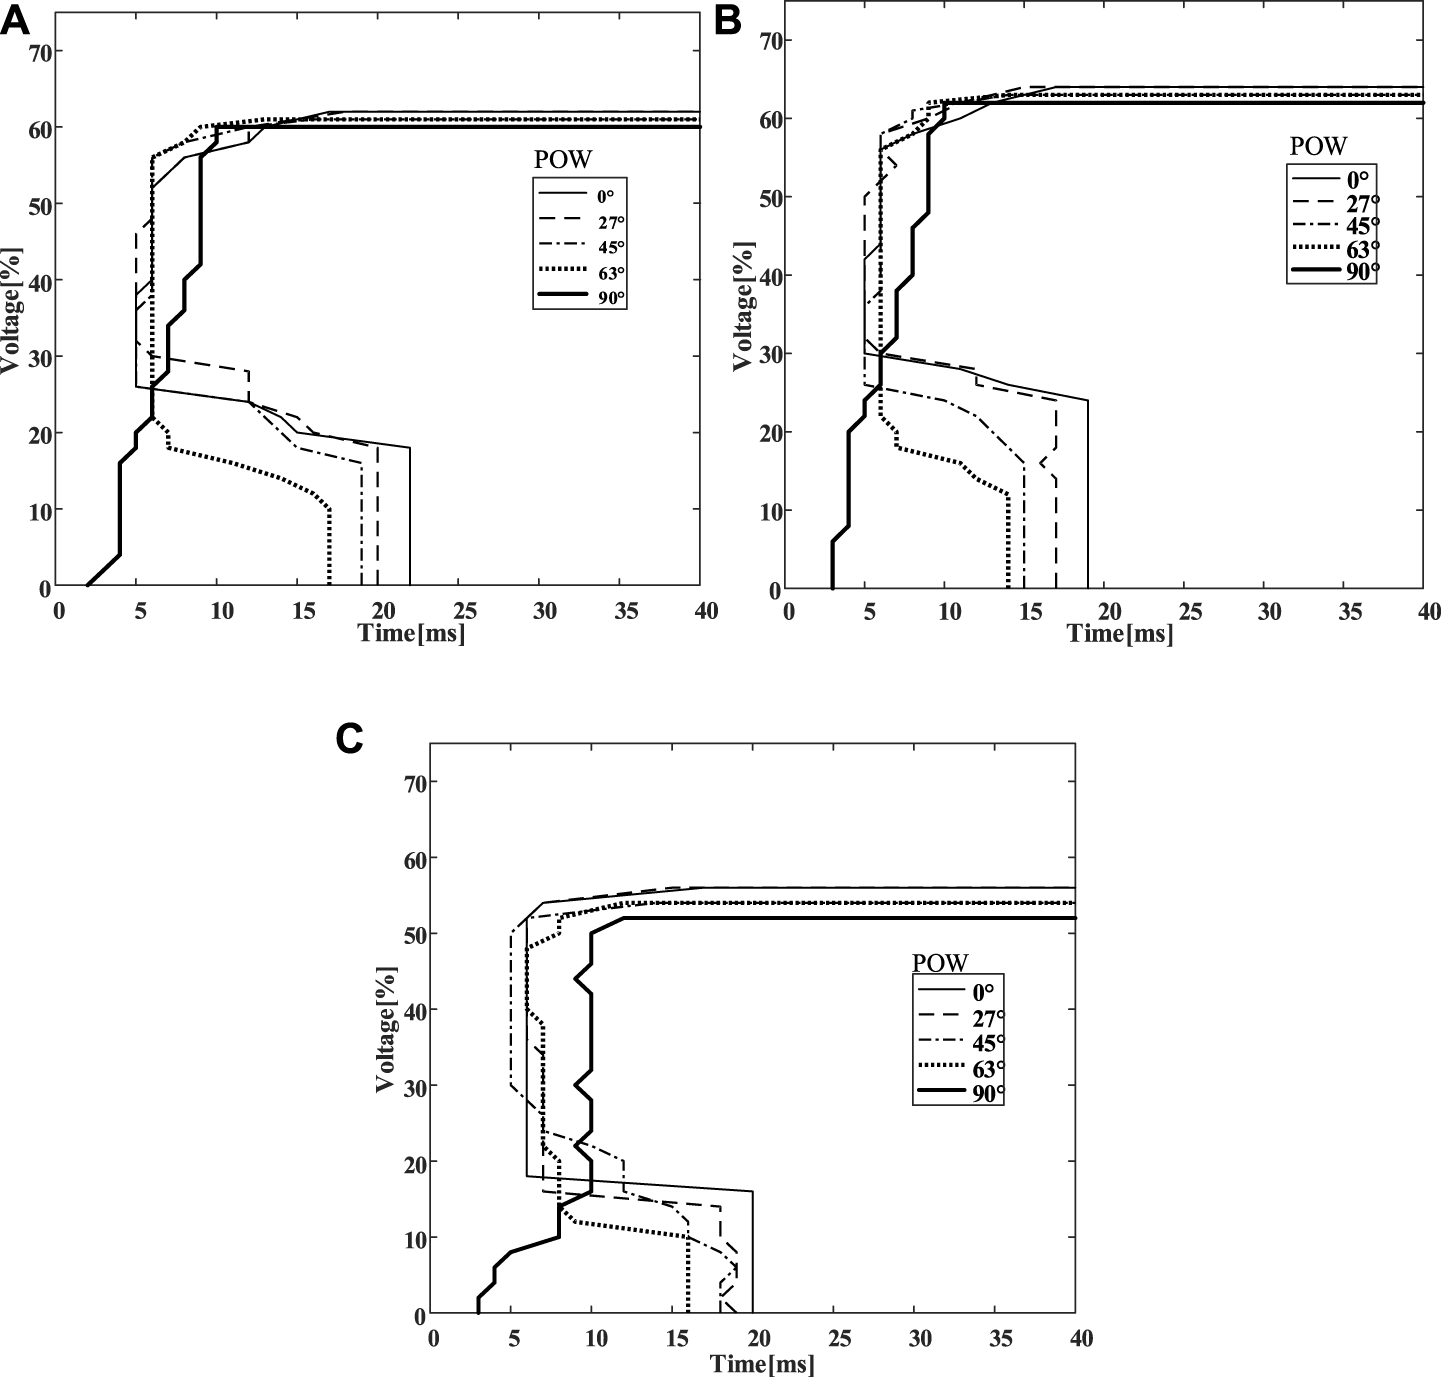
Test results considering the different POW (0° PAJ). (A) Results for R1. (B) Results for R2. (C) Results for R7.
It is obvious that the less POW, the stronger voltage sag tolerance of EMR, when the voltage sag is deep drop. Take R1 as example, when a short interruption occurs, the tolerance durations are 22 ms for 0° POW, 20 ms for 27° POW, 19 ms for 45° POW, 16 ms for 63° POW, and 3 ms for 90° POW, respectively. However, the greater POW, the stronger tolerance of EMR under voltage sag, when the voltage sag is shallow. R1 can tolerate 10 ms when 90° POW, but 5 ms when 0° POW, when the magnitude is 40%.
VTCs of 0° and 90° POW for all tested EMRs are shown in Figure 8. Overall, the shape of VTCs for the eight EMRs are similar; however, VTCs of different EMRs are with different “knee” parameter, due to the different type and different manufacturer. For example, R1 and R2 are two devices with the similar parameter (not the same model) from the same manufacturer; the results in Figure 8 show that the VTCs of the two devices are different.
The sensitivity of the “flat” part for different POW is illustrated in Figure 9; “voltage threshold” means the maximum magnitude can be tolerated of a certain POW. In Figure 9, the larger POW, the smaller voltage threshold. Moreover, the variation of this threshold is between 2 and 10% of Unom depending on the type of the EMR. For example, R5 will trip when the voltage drops below 54–62% of Unom, depending on the POW, for voltage sags lasting more than 30 ms. This represents that the upper and lower limits of voltage magnitude threshold for the EMRs are tested.
FIGURE 9
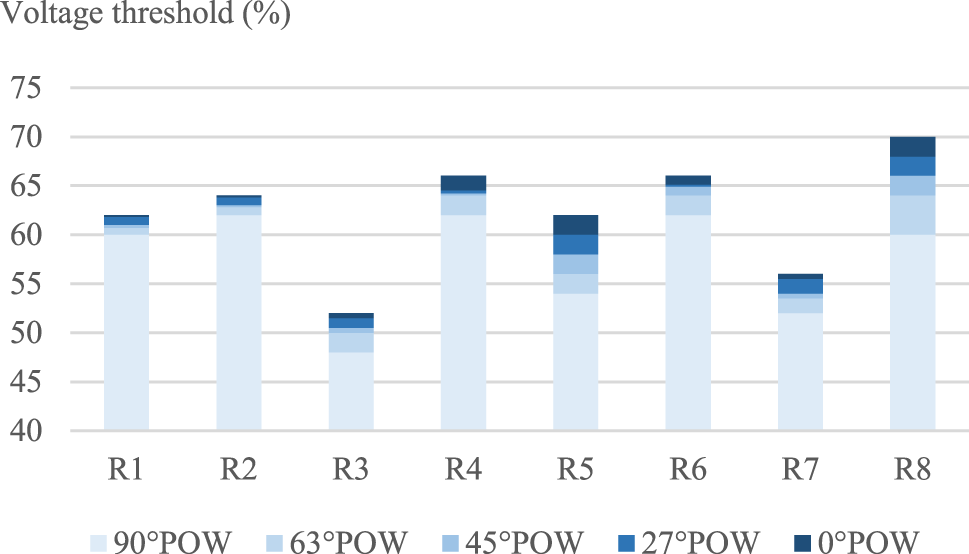
Voltage threshold of different VTCs under different POW (0° PAJ).
4.1.3 Sensitivity to Phase Angle Jump
The test results of PAJ are showed in Figure 10. The tests of different PAJ are divided into two groups: one for 0° POW and another for 90° POW. The test of each group considers four PAJs, including 0° PAJ, 30° PAJ, 60° PAJ, and 90° PAJ.
FIGURE 10
Test results considering the different PAJ (0° POW and 90° POW). (A) Results for R2. (B) Results for R5. (C) Results for R8.
From Figure 10, the tolerance of the complicated part (t < 30 ms) of VTCs is clear. When voltage sag is starting at 0° POW, the larger PAJ, the stronger EMR’s tolerance. For example, the duration is 24 ms of 90° PAJ when the voltage magnitude is 50% of Unom, while the duration is only 8 ms of 0° PAJ under the same condition. Instead, the larger PAJ, the weaker EMR’s tolerance when the sag is starting at 90° POW.
For the two groups VTCs, the less PAJ, the stronger tolerance to the sags with shorter duration, which is with the obvious trend in the “vertical” part (t < 15–30 ms). In the “flat” part (t > 15–30 ms) of the VTCs, the less PAJ is also with the stronger tolerance; however, the trend is not as obvious as in the “vertical” part. Generally, PAJ effects on the tolerance of EMR, when a PAJ occurs, the tolerance of EMR is weaker.
4.1.4 Sensitivity to Frequency Variation
Test the tolerance of EMR to the sags with a frequency variation up to ±2%. The sags at 49, 50, and 51 Hz are considered. Frequency variation of ±2% of nominal frequency does not influence the sensitivity of the tested EMRs, since the VTCs at the three frequencies are almost coincident in Figure 11A.
FIGURE 11
Test results for R1 (0° PAJ). (A) Considering the frequency fluctuation. (B) Considering the harmonic distortion. (C) Considering the magnitude variation in pre- and post-sag segment.
4.1.5 Sensitivity to Harmonic Distortion
Test the tolerance of EMR to the sags with a harmonic content (THD up to 12%). It demonstrates that harmonic distortions of up to 12% of THD have only a slight influence on both EMR’ sensitivity and the shape of VTCs, shown in Figure 11B. Test results show that the tolerance of EMR is slightly higher when the supply voltage contains harmonics.
4.1.6 Sensitivity to the Magnitude Variation in Pre- and Post-Sag Segments
The tolerance test results to the sags with variation in pre- and post-sag voltage magnitude (up to ±10%) is in Figure 11C. It demonstrates that when the pre- and post-sag magnitude is 110% of Unom (242 V), EMR’s tolerance increases slightly. It can conclude that the slightly higher of the magnitude in pre- and post-sag segments, the stronger tolerance of EMR.
4.1.7 General Voltage-Tolerance Curves
Based on the test results obtained, the general VTC of all the tested EMR is shown in Figure 12. EMR can tolerate a voltage sag with the magnitude more than 74% of Unom. When the sag magnitude is less than 48% of Unom, EMR will trip when the sag duration exceeds 28 ms.
FIGURE 12
Generic VTCs for EMR.
4.2 Testing of Electromagnetic Relay With Non-Rectangular Voltage Sags
4.2.1 Sensitivity to the Two-Stage Voltage Sags
In order to ensure the accuracy of the test results, the total duration of the two stages (Figure 13) must be less than the maximum tolerance duration (0% of Unom) for a certain EUT. For example, the maximum tolerance duration of R4 is 24 ms when 0% of Unom, 10% of Unom, or 30% of Unom; total duration of the two stage sags in this test for R4 should be less than 24 ms. All the tests to two-stage voltage sags are under the same conditions, both with the same total duration (20 ms), 0° POW and 0° PAJ.
FIGURE 13
An example of the two-stage voltage sag.
The results of three groups tests are listed in Table 3. The tests of No. 1 group are to prove the tolerance of R4. R4 is exposed to a short interruption (0% of Unom), a voltage sag (10% of Unom), and a voltage sag (30% of Unom); it remains engaged. It means R4 can operate normally to a sag or short interruption when the duration is less than 24 ms.
TABLE 3
| No | First stage | Second stage | State of R4 | ||
|---|---|---|---|---|---|
| Magnitude (%) | Duration (ms) | Magnitude (V%) | Duration (ms) | ||
| 1 | 0 | 20 | — | — | Engaged |
| 10 | 20 | — | — | Engaged | |
| 30 | 20 | — | — | Engaged | |
| 2 | 0 | 14 | 10 | 6 | Disengaged |
| 10 | 6 | 0 | 14 | Disengaged | |
| 3 | 0 | 14 | 30 | 6 | Engaged |
| 30 | 6 | 0 | 14 | Disengaged | |
Test conditions and results to two-stage voltage sags for R4.
The tests of No. 2 group show that EMR is sensitive to the two-stage voltage sag. R4 is exposed to a combined two-stage voltage sag, different in respective sag duration, while both the states of R4 are disengaged. The sag in No. 1 is worse than the sag in No. 2; “two-stage” makes R4 disengaged.
The tests of No. 3 group show that EMR is sensitive to the order of the two-stage. R4 is exposed to two different sequential two-stage voltage sags. It works normally to the sag with first stage of 0% and second stage of 30%, and is disengaged to the sag with first stage of 30% and second stage of 0%.
4.2.2 Sensitivity to the Slow Recovery Voltage Sag
The slow recovery voltage sag is due to the starting of large motors or transformer energizing. In the tests, the voltage sag is set as recovering progressively to the nominal voltage. Five voltage recovery gradient and two different POW are considered here.
Table 4 shows the duration of sag, which causes the disengagement of R4. From the test results, it can conclude that the disengagement time is increasing with the increasing recovery gradient, for the shallower initial drop, while the opposite results would obtain for a deeper initial drop. Overall, difference of disengaged time is small of different recovery gradient if initial drop is a constant.
TABLE 4
| Initial drop to | Voltage recovery gradient | ||||
|---|---|---|---|---|---|
| 10V/s | 20V/s | 30V/s | 40V/s | 50V/s | |
| (a) 0° POW (0° PAJ) | |||||
| 0% | 25 | 24 | 23 | 22 | 21 |
| 10% | 25 | 24 | 24 | 23 | 21 |
| 20% | 25 | 24 | 24 | 24 | 22 |
| 30% | 25 | 24 | 24 | 24 | 22 |
| 40% | 25 | 25 | 24 | 24 | 22 |
| 50% | 7 | 7 | 7 | 8 | 10 |
| 60% | 8 | 9 | 9 | 9 | 10 |
| 70% | — | — | — | — | — |
| (b)90° POW (0° PAJ) | |||||
| 0% | 5 | 5 | 4 | 4 | 4 |
| 10% | 5 | 5 | 5 | 5 | 5 |
| 20% | 6 | 6 | 6 | 5 | 5 |
| 30% | 6 | 6 | 6 | 6 | 6 |
| 40% | 10 | 10 | 10 | 9 | 9 |
| 50% | 10 | 10 | 10 | 10 | 10 |
| 60% | 12 | 12 | 12 | 13 | 14 |
| 70% | — | — | — | — | — |
Duration (ms) of the slow recovery voltage sag to disengage for R4 as a function of initial voltage drop and the voltage recovery gradient.
5 Comparison
This study proposes a general test procedure to improve the test effective and the accuracy. The comparisons of the effectiveness and the accuracy between the proposed test procedure and the test method proposed by IEEE standard (IEEE, 2017) are listed in Table 5.
TABLE 5
| Magnitude (%) | The proposed method | IEEE method | ||||
|---|---|---|---|---|---|---|
| Times | Results (ms) | Error (ms) | Times | Result (ms) | Error (ms) | |
| 0 | 8 | 19.063 | 0.0625 | 3 | 20 | 1.0000 |
| 10 | 8 | 19.063 | 0.0625 | 3 | 20 | 1.0000 |
| 20 | 8 | 19.063 | 0.0625 | 3 | 20 | 1.0000 |
| 30 | 8 | 5.3125 | 0.6875 | 2 | 10 | 4.0000 |
| 40 | 8 | 5.3125 | 0.3125 | 2 | 10 | 5.0000 |
| 50 | 8 | 6.5625 | 0.5625 | 2 | 10 | 4.0000 |
| 60 | 8 | 14.063 | 0.0625 | 3 | 20 | 1.0000 |
Comparisons between the proposed method and the IEEE method.
The results in Table 5 are the test results for R2, when 0° POW and 0° PAJ. The “real” critical points of the tolerance under the voltage sags with the different residual voltage are testing results by the traditional method, which is called “step by step” method. The step size is 1 ms; the small step size ensures the testing accuracy but with the heavy testing work. The real tolerances are 19, 19, 19, 6, 5, 6, and 14 ms when magnitudes are 0, 10, 20, 30, 40, 50, and 60%, respectively. However, the traditional method costs the extensive work, for example, it has to do 1,000 tests, when the critical point is 1,000 ms for a certain residual voltage.
IEEE test method (IEEE, 2017) is the fixed step test method. For example, the first step to the seventh step is testing the tolerance of EUT when duration is 0, 10, 20, 50, 100, 200, and 500 ms, respectively. The greater test step sizes result in the greater test errors. The example in Table 5 is not with the great errors, because of the critical points are less than 20 ms, the step size in this range is small by IEEE method. The worse situation is that when the critical point is 300 or 400 ms, the test result should be 500 ms, leading the larger error.
The proposed method can decide the next test point automatically according to the test results of the two previous test points, can quickly approach the critical point. The errors of the testing results for R2 are less than 1 ms compared with the real tolerances. The test work is 8 times for a certain residual voltage, which is quite less than the test work by “step by step” method, whose testing works are 19, 19, 19, 6, 5, 6, and 14 times for the different residual voltage for R2. The proposed method is with the high efficiency and test accuracy.
6 Application of the Test Results
First, through numerous tests, it finds that POW and PAJ are the major affected factors, as well the two-stage sag. For the reason that, it can carry out a subset tests described in this paper to analyze the voltage tolerance of EMR, only considering magnitude, duration, POW, PAJ, and the two-stage sag.
Secondly, based on the test results got, the general VTC of EMR are obtained as shown in Figure 12. The general VTC is helpful for industry consumer to choose the proper EMR considering their own operating environment. Moreover, it is useful for the manufacturer to design the EMR with higher voltage tolerance for specific consumer. For example, EMR can work steadily in a longer duration environment.
Third, EMR can tolerate a voltage sag with the magnitude more than 74% of Unom no matter how long the sag lasts from the general VTC in Figure 12. The result is profitable for providing appropriate sag countermeasures. For example, the voltage is only compensated to 74% of Unom to ensure the EMR operate properly, and the entire industry process would not be interrupted, accordingly. It means that industrial users can choose a voltage-compensating device with a smaller capacity to maintain the whole process and save money, more importantly.
7 Conclusion
This paper has performed a large number of tolerance tests on eight different EMRs, and the test results are presented graphically as VTCs. The tolerance to rectangular and non-rectangular voltage sag is investigated in the tests; the influence factors considered here include POW, PAJ, frequency variation, harmonic, magnitude variation in pre- and post-sag segments, two-stage sag, and slow recovery sag.
The obtained VTCs clearly show that the response of EMRs to voltage sag or short interruption can be rather complex. The magnitude and duration of sag are not the only parameters which influence EMR’s sensitivity; POW and PAJ also have an important influence on the EMR’s tolerance.
The following specific conclusions can be drawn from the tests performed.
1) From the tolerance test under rectangular voltage sag, the tolerance capability of EMR is obtained. Although the EMR’s VTC is different depending on its type, the shapes of VTCs of all tested EMRs are basically similar. Through more than 10,000 tests on each EMR, EMR can tolerate a voltage sag with the magnitude more than 74% of Unom. When the sag magnitude is less than 48% of Unom, EMR will trip when the sag duration exceeds 28 ms.
2) A quarter-cycle symmetry of VTCs with respect to POW is proved. The POW has a significant influence on the behavior of EMRs. VTCs have different shapes for 0° and 90° POW. The tolerance of EMR is stronger at 0° POW than 90° POW, generally.
3) PAJ effects on the tolerance of EMR, when a PAJ occurs, the tolerance of EMR is weaker.
4) Two-stage voltage sags can decrease EMR’s tolerance, making EMR easier to disengage. The sequence of the two-stage also has a significant influence on EMR’s tolerance.
5) Other factors of frequency variation up to ±2%, harmonic (THD up to 12%), and the slow recovery voltage sag only have a not-noticeable impact on the tolerance of EMR. EMR can tolerate the slow recovery voltage sag with the magnitude more than 60–70% of Unom.
The test results are useful to choose proper EMR with higher tolerance and to use subset tests to quantitatively analyze sensitivity of a new EMR. It is profitable to apply a voltage compensating device with a smaller capacity to keep the process unaffected using the general VTC.
Statements
Data availability statement
The original contributions presented in the study are included in the article/supplementary material. Further inquiries can be directed to the corresponding author.
Author contributions
HZ contributed to the conception and design of the research. HZ design experiment. QW conducted a statistical analysis. YY wrote the first draft of the manuscript. HZ wrote part of the manuscript. All authors contributed to the revision of the manuscript and read and approved the submitted version.
Funding
This work was supported by the Science and Technology Project of China Southern Power Grid (090000KK52190169/SZKJXM2019669).
Conflict of interest
The authors declare that the research was conducted in the absence of any commercial or financial relationships that could be construed as a potential conflict of interest.
Publisher’s note
All claims expressed in this article are solely those of the authors and do not necessarily represent those of their affiliated organizations, or those of the publisher, the editors and the reviewers. Any product that may be evaluated in this article, or claim that may be made by its manufacturer, is not guaranteed or endorsed by the publisher.
References
1
Alvaro F. B. Keng W. L. Grazia T. Santoso S. (2019). Accurate Identification of Point-on-Wave Inception and Recovery Instants of Voltage Sags and Swells. IEEE Trans. Power Del.34 (4), 551–560. 10.1109/tpwrd.2018.2876682
2
AMETEK (2017). MX Series Data Sheet, Technical Documentation. Berwyn, USA: AMETEK.
3
Bollen M. H. J. (2000). Understanding Power Quality Problem: Voltage Sag and Interruptions, Ser. Series on Power Engineering. NY, USA: IEEE Press.
4
De Santis M. Noce C. Varilone P. Verde P. (2018). Analysis of the Origin of Measured Voltage Sags in Interconnected Networks. Electric Power Syst. Res.154, 391–400. 10.1016/j.epsr.2017.09.008
5
Djoki S. Milanovi J. V. Rowland S. M. (2007). Advanced Voltage Sag Characterisation II: point on Wave. IET Gener. Transm. Distrib.1 (1), 146–154. 10.1049/iet-gtd:20050434
6
Djokic S. Z. Milanovic J. V. Kirschen D. S. (2004). Sensitivity of AC Coil Contactors to Voltage Sags, Short Interruptions, and Undervoltage Transients. IEEE Trans. Power Deliv.19 (3), 1299–1307. 10.1109/tpwrd.2004.824396
7
Fan W. Wu S. (2014). “Ship Mechanical Environment Impact on the Performance of Electromagnetic Relay,”in 11th World Congress on Intelligent Control and Automation, Shenyang, China, June 24-July 4, 2014, 3702–3706. 10.1109/wcica.2014.7053332
8
Gambôa P. Silva J. F. Pinto S. F. Margato E. (2019). Input-Output Linearization and PI Controllers for AC-AC Matrix Converter Based Dynamic Voltage Restorers with Flywheel Energy Storage: a Comparison. Electric Power Syst. Res.169, 214–228. 10.1016/j.epsr.2018.12.023
9
Hardi S. Daut I. Irwanto M. (2010). “Testing of Contactors under Voltage Sag and Non-sinusoidal Voltage Conditions,”in 2010 IEEE International Conference and Power and Energy, Kuala Lumpur, Malaysia, November 29-December 1, 2010, 683–688. 10.1109/pecon.2010.5697667
10
IEC (2021). “IEC Electromagnetic Compatibility: Testing and Measurement Techniques-Power Quality Measurement Methods,” in IEC 61000-4-30, 2015 (Geneva: IEC).
11
IEEE (2017). “IEEE Recommended Practice for Voltage Sag and Short Interruption Ride-Through Testing for End-Use Electrical Equipment Rated Less Than 1000 V,” in IEEE Std. 1668, 2017. (Revision of IEEE Std. 1668-2014) (Manhattan, NY: IEEE).
12
IEEE (1998). “IEEE Recommended Practice for Evaluating Electric Power System Compatibility with Electronic Process Equipment,” in IEEE Std. 1346, 1998 (Manhattan, NY: IEEE).
13
Ma Z. Y. Xu Z. Mo W. X. Guo W. Q. Wanf J. H. Zhou K. et al (2018). “A New Method for Sensitive Single-phase Equipment Testing to Voltage Sag,”in 2018 18th International Conference on Harmonics and Quality of Power (ICHQP), Ljubljana, Slovenia, May 13-16, 2018, 1–6.
14
Mohammadi Y. Moradi M. H. Chouhy Leborgne R. (2017). Employing Instantaneous Positive Sequence Symmetrical Components for Voltage Sag Source Relative Location. Electric Power Syst. Res.151, 186–196. 10.1016/j.epsr.2017.05.030
15
Nagata E. A. Ferreira D. D. Duque C. A. Cequeira A. S. (2018). Voltage Sag and Swell Detection and Segmentation Based on Independent Component Analysis. Electric Power Syst. Res.155, 274–280. 10.1016/j.epsr.2017.10.029
16
Ouyang S. Liu L. (2017). Test and Study on Sensitivity of Electronic Circuit in Low‐voltage Release to Voltage Sags. IET Circuits, Devices Syst.11 (6), 529–534. 10.1049/iet-cds.2016.0222
17
Ouyang S. Liu P. Liu L. Li X. (2015). Test and Analysis on Sensitivity of Low‐voltage Releases to Voltage Sags. IET Generation, Transm. Distribution9 (16), 2664–2671. 10.1049/iet-gtd.2015.0547
18
Ren J. Xiao X. Zheng Z. Wang Y. Ma Z. Liu K. (2021). Impact of Phase Angle Jump on DFIG under LVRT Conditions: Challenges and Recommendations. IEEE Trans. Power Deliv., 1. 10.1109/TPWRD.2020.3048434
19
Wu S. Fan W. (2015). “A Method for Analyzing the Influence of Voltage Fluctuation on Pick-Up Characteristics of Electromagnetic Relay,” in 2015 IEEE International Conference on Information and Automation, Lijiang, China, August 8-10, 2015, 2616–2620. 10.1109/icinfa.2015.7279726
20
Wang Y. Bollen M. H. J. Xiao X.-Y. (2015). Calculation of the Phase-Angle-Jump for Voltage Dips in Three-phase Systems. IEEE Trans. Power Deliv.30 (1), 480–487. 10.1109/tpwrd.2014.2352358
21
Wang Y. Deng L.-F. Bollen M. H. J. Xiao X.-Y. (2020). Calculation of the point-on-wave for Voltage Dips in Three-phase Systems. IEEE Trans. Power Deliv.35 (4), 2068–2079. 10.1109/tpwrd.2019.2960524
22
Wang Y. Luo H. Xiao X.-Y. (2019). Voltage Sag Frequency Kernel Density Estimation Method Considering protection Characteristics and Fault Distribution. Electric Power Syst. Res.170, 128–137. 10.1016/j.epsr.2019.01.009
23
Weldemariam L. E. Gartner H. J. Cuk V. Cobben J. F. G. (2016). “Mitigation Strategies to Improve the Performance of AC Contactor against Voltage Dips,”in 2016 51st International Universities Power Engineering Conference (UPEC), Coimbra, Portugal, September 6-9, 2016, 1–6.
24
Xu Y. Lu W. Wang K. Li C. Aslam W. (2019). Sensitivity of Low-Voltage Variable-Frequency Devices to Voltage Sags. IEEE Access7, 2068–2079. 10.1109/access.2018.2885402
25
Xu Y. Wu Y. Zhang M. Xu S. (2019). Sensitivity of Programmable Logic Controllers to Voltage Sags. IEEE Trans. Power Deliv.34 (1), 2–10. 10.1109/tpwrd.2018.2870086
26
Ye J. Gooi H. B. Wang B. Li Y. Liu Y. (2019). Elliptical Restoration Based Single-phase Dynamic Voltage Restorer for Source Power Factor Correction. Electric Power Syst. Res.166, 199–209. 10.1016/j.epsr.2018.10.011
27
Zhai G. Yang W. (2008). “3-D Finite Element Analysis of Dynamic Characteristics of Electromagnetic Relay Interfered by Voltage Dips and Short Interruptions,”in 2008 International Conference on Electrical Machines and Systems, Wuhan, China, October 17-20, 2008, 564–567.
28
Jianbo Z. Qi W. (2018). “An Anti-misoperation Method for Intermediate Relay Used in DC System of Substation,” in 2018 13th IEEE Conference on Industrial Electronics and Applications (ICIEA), Wuhan, China, May 31-June 2, 2018, 455–460. 10.1109/iciea.2018.8397760
Summary
Keywords
electromagnetic relay, power quality, short interruption, voltage sag, voltage-tolerance curve
Citation
Zhang H, Wang Q and You Y (2021) Tolerance of Electromagnetic Relay to Voltage Sags and Short Interruptions. Front. Energy Res. 9:766472. doi: 10.3389/fenrg.2021.766472
Received
29 August 2021
Accepted
11 November 2021
Published
17 December 2021
Volume
9 - 2021
Edited by
Zhenhao Tang, Northeast Electric Power University, China
Reviewed by
P. Maadeswaran, Periyar University, India
Karthik Balasubramanian, Keppel Offshore and Marine Limited, Singapore
Updates
Copyright
© 2021 Zhang, Wang and You.
This is an open-access article distributed under the terms of the Creative Commons Attribution License (CC BY). The use, distribution or reproduction in other forums is permitted, provided the original author(s) and the copyright owner(s) are credited and that the original publication in this journal is cited, in accordance with accepted academic practice. No use, distribution or reproduction is permitted which does not comply with these terms.
*Correspondence: Huaying Zhang, zhytgyx@163.com
This article was submitted to Smart Grids, a section of the journal Frontiers in Energy Research
Disclaimer
All claims expressed in this article are solely those of the authors and do not necessarily represent those of their affiliated organizations, or those of the publisher, the editors and the reviewers. Any product that may be evaluated in this article or claim that may be made by its manufacturer is not guaranteed or endorsed by the publisher.