 Rong Fu
 Jie Chen1*
 Jie Zhang
- 1Nanjing University of Posts and Telecommunications, Nanjing, China
- 2State Grid Electric Power Research Institute, Nanjing, China
Price tamping attacks may cause market turbulence, attack detection and defense strategy are needed to study. Firstly, demand response characteristics are analyzed in a User Energy System. A quantitative model is established to describe the load changes caused by price tampering attacks. Secondly, a space-based cumulative intrusion detection method is proposed to pick up the discrepancy under tampering attacks. To verify the practicability of the proposed method, intrusion detection experiments are tested in the Principal Information and Safety Laboratory. Then, comprehensively considering the purchase of electricity from the power grid, self-generation, and load shedding, a quantitative model of attack consequences is established based on the allocation coefficient. Thus, the intrusion detection algorithm is used as a defense resource, and a demand-side defense protection strategy is formed to find an optimal deployment method based on non-cooperative game theory. The defensive protection strategy takes the quantitative model of attack consequences as the solution target, and solves the Nash equilibrium solution under different attack modes. Finally, in the IEEE-33 node system simulations, the defense resource is deployed using intrusion detection strategy, and the defense decision is executed to show the effectiveness of the comprehensive protection strategies.
1 Introduction
The cyber-physical system integrates the computing system, the communication network, and the physical environment through computation, communication, and control (3C) technology. Thus, a multi-dimensional heterogeneous complex system that integrates real-time sensing, dynamic control, and information services is formed by Liu et al. (2015). In recent years, with the rapid development of smart grid construction, the interaction between traditional power networks and information networks has become increasingly complex. Zhao et al. (2010) indicates that The modern power system is no longer the traditional power equipment network. It develops into a power cyber-physical system (CPS) with various typical features.
As a private network of power industrial control systems, power communication network had the characteristic of “secure partition, network-specific, horizontal isolation, and vertical authentication”. And it was considered to have strong security and reliability for a long time which was proposed by Miao et al. (2009). However, compared with the traditional primary power network, the research on security protection for power communication systems started late.
Recently, A.Ashok et al. (2017) ’s research showed that traditional physical isolation can’t guarantee the absolute security of power CPS. So the attack against the power system wasn’t implemented on the physical side only. On the contrary, current attack was more likely to happen on the information side due to the low cost and the greater potential damage. Tang et al. (2016) revealed the ever-changing attack methods which may exist on the information side of the power CPS. The Ukrainian power outage event analyzed in the literature of Tong et al. (2016) was an example of a network attack in the power network.
Currently, false data injection attacks (FDIA) exist in all aspects of the power CPS according to Tang et al. (2016). Zhao et al. (2016) and Ni et al. (2016) indicated that the attacker attacked the sensing device by injecting false data to achieve the purpose of attacking the power grid. Wang. (2014) described the FDIA against large, complex SCADA systems. The relative active/passive defense methods need to be further studied (Hahn and Manimaran, 2011; Tian et al., 2018).
At the same time, renewable energy is developing fast. Prosumers in the smart grid have not only participated in the production, transmission, distribution, and use of electricity as consumers, but also have gradually participated in the distributed generation process as the role of power producers according to Jun et al. (2015) and Yang et al. (2018). The electricity consumed in an area consists of two parts-traditional power and local distributed new energy generation such as solar energy, wind energy, etc. In this case, the regional electricity price can no longer be fixed to a certain value. It should dynamically change with the production of two kinds of electric energy to pursue the maximization of their profits according to Telaretti et al. (2014) ’s points.
This situation requires the introduction of a competitive mechanism in the field of power generation. The business model of the open power generation side has gradually formed. It means that each power generation unit needs to compete in the electricity market. In such case, Wang. (2001) revealed that the opening of electricity prices also brought many security risks. With the development of power CPS and new energy technologies, the power grid has become more distributed. The control center in the power grid gradually becomes more diversified. Regional power grids often use proxy methods to participate in electricity price decisions. In order to obtain more benefits or implement destructive actions, malicious bidding events occur from time to time. In the literature of Ma et al. (2016), real-time electricity price attacks had a serious impact on user load demand. Xia et al. (2017) conducted experiments and found that electricity price delay attacks caused great interference to the electricity market.
As can be seen from Jie et al. (2019), a Stackelberg game was used to model Man-In-The-Middle (MITM) attack mode. They compared the financial loss and the effect of cyber security. From the result, there were great differences in the losses and delays caused by MITM attacks before and after defensive measures. MITM attacks were studied in VANET by Ahmad et al. (2018). Results suggested that these attacks had a massive influence on the network in terms of low content delivery, high end-to-end delay, compromised messages, and packet losses. For example, for 50% distributed MITM attackers, the network experiences about 6.89% more loss as compared to the network containing fleet attackers. In the field of electricity, Chen et al. (2017) showed the man-in-the-middle attacks against smart meters DL/T 645–2007 Protocol. Wang et al. (2015) described a false data injection attack against multi-step electricity prices (MEP). It can be seen that the malicious bidding behavior realized by MITM attacks on electricity prices has gradually become a big problem. And it needs more attention and better solutions (Lin et al., 2013). This shows that man-in-the-middle attacks cannot be ignored. It is gradually affecting the security of systems that contain communications such as power CPS.
Generally, there have been two types of MITM attacks on electricity prices (23–25) (Bharti and Mala, 2019; Singh et al., 2019; Sun et al., 2019): 1) It attacks the information flow; 2) It attacks the information center (Song, 2018). The first type of MITM attacks can maliciously change the price data between the buyer and the seller, and the second type can send false price data. Because the first type is easy to operate, it becomes the main way of MITM attacks on electricity prices according to Liwei and Yang. (2019).
When MITM attacks on electricity prices occur, the load changes according to electricity prices. Further, the load may be mismatched with the source. When the load is larger than the source, the voltage level would decrease and the load shedding would occur in a large area sometimes. When the load is less than the source, the system voltage level would rise, which may lead to an electric accident.
In this case, Bao (2018) studied that the attacker and the defender are clearly opposed. The attack mode of the middleman attacker will not be static, and it will develop in the direction of maximizing the attack benefits. In order to cope with the changing attacks, grid defenders must also respond in a timely manner. The attacker wants to cause the biggest grid loss. The purpose of the defender is to reduce this loss. This process is consistent with the process of the game.
As a powerful solution tool, the game theory had been widely used to solve various problems in the power system. W. Lee et al. used game theory to solve the problem of new energy consumption (Lee et al., 2015). The game strategy was also used by Wei et al. (2018) to solve the coordinated cyber-physical attacks problem.
This article starts from the intrusion detection and protection of price tampering attacks by MITM attackers. A set of defense strategies is designed based on state estimation and game theory. The main content of this article has the following aspects:
1) A cumulative error detection strategy based on normal distribution is designed to detect the price tampering attack by MITM attackers;
2) Based on the minimum comprehensive cost, a quantitative model of attack consequences is established which considers three demand-side response methods of purchasing power from the external grid, self-generation, and load shedding comprehensively;
3) A demand-side defense protection strategy based on game theory is established. The model uses the intrusion detection method to deploy defend resources, and sets the demand-responsive attack consequence quantitative model as the game target.
2 Demand Response Analysis Under Price Tamping Attacks
2.1 Architecture of a User Energy System
On the demand side, prosumers such as residential, commercial, industrial consumers, have their dispatch centers to monitor their loads and generations in a User Energy System. These dispatch centers are managed by User Energy Management System (UEMS) (Ma L et al., 2016). Among them, residential and commercial electricity consumption affected by current electricity price is small and industrial electricity consumption is often relatively large, due to the difference in production costs elasticity. For example, residential prosumers have micro power generation units installed on the user side, such as photovoltaic and wind power, and can meet part of the power demand on the demand side through self-generation. The architecture of a User Energy System is shown in Figure 1.
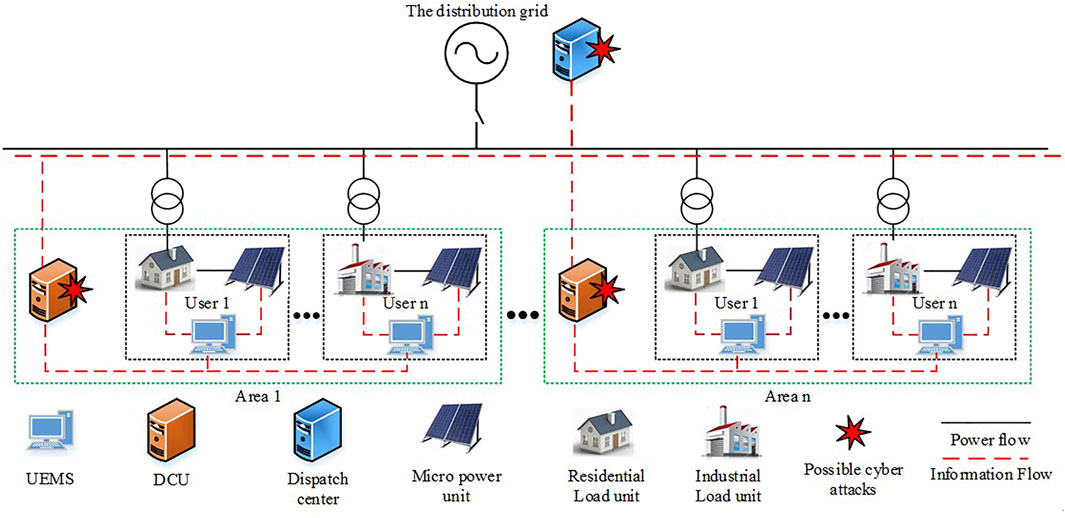
FIGURE 1. User Energy System architecture under cyber attacks.
In this architecture, prosumers can be divided into several areas for better control. Each area is controlled by a Distributed Control Unit (DCU), which is responsible for transferring distributed information. In UEMS, each DCU communicates with the demand-side control center to achieve measurement and control of the demand side. The center makes decisions based on the information uploaded by the DCUs. These DCUs control the energy transactions of prosumers in the area, generate electricity prices according to the power consumption and load type of the corresponding area, and upload them to the demand-side control center. The demand-side control center can communicate with the external distribution grid about its electricity information.
The Electricity price tampering attack scenario based on MITM attack is simulated in the experiment. MITM attack on electricity price provide false information to interfere with the power market. MITM attack secretly changed the communication mode between UEMS and demand side control center. It makes the initial connection becomes a new connection with the intervention of a MITM attacker. Therefore, the normal tariff transmitted in the original connection will be replaced by malicious electricity price required by the bidder. UEMS will no longer purchase and use power resources according to the normal electricity price. MITM attack mode is shown in Figure 2.
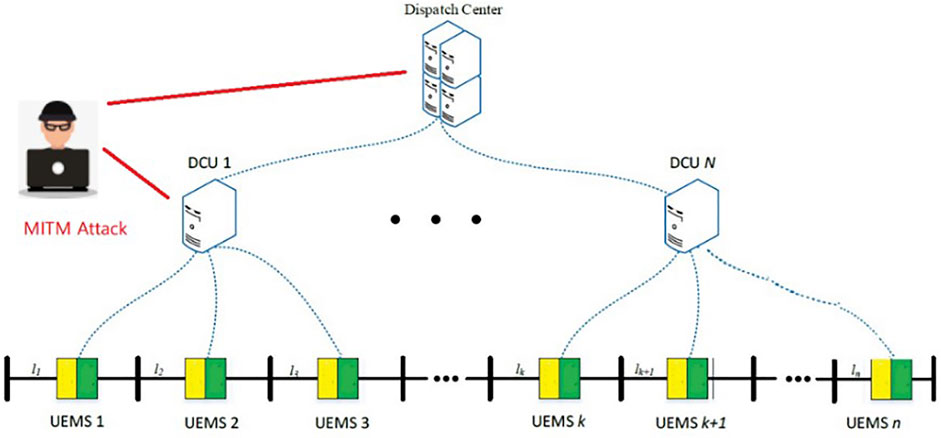
FIGURE 2. MITM attack mode between DCUs and dispatch center
2.2 Electricity Changes Under Price Tampering Attacks
When a price tampering attack occurs on the demand side, it will cause demand changes to the corresponding area. Based on the price elasticity of electricity demand (PEED) model proposed by Hu et al. (2008), the electricity consumption change of an area after the attack can be expressed.
1) Large power consumers consume more variable electricity such as industrial users, and their electricity prices are higher than ordinary ones. When the price tampering attack occurs, due to the influence of production costs, large power consumers purchase electricity under certain restrictions. The electricity consumption
where
2) Small power consumers usually consume load relatively constantly, such as residential and commercial users. They seldom change their own electricity demand when the electricity price changes. Suppose their electricity consumption in a certain area is
According to the power consumption changes of these two types of consumers, the PEED model is used to express the electricity consumption
where
To sum up, if the price tampering attack is successful, the target area has an electricity change
3 Intrusion Detection of Price Tamping Attacks
This section studies how to detect price tamping attacks based on statistical bias and state estimation. Intrusion detection is essential to determine whether an abnormal event occurs in the system. It comes down to the problem of distinguishing between “normal” and “abnormal” states. The existing anomaly detection methods can be divided into deviation-based detection and feature-based detection methods according to the identification basis.
In the actual application process, the detection relying on a single residual is likely to cause residual pollution and flooding. It can lead to missed or false detection of abnormal data. So when there is a lot of abnormal data in the detected data, the correlation between the data cannot be fully utilized. This detection method is also powerless to attack multiple nodes at the same time. The detection accuracy of detection methods based on state estimation will also be greatly affected.
Aiming at the shortcoming that the detection result is overly dependent on a single residual, this section studies a cumulative error detection strategy based on a normal distribution under tampering attacks. The strategy improves the detection success rate from the perspective of multi-point cumulative deviation.
The detection of price tampering attacks is essentially a state estimation process. Power system state estimation processing generally analyzes low-precision, incomplete, and occasionally bad data in power system measurement data, and outputs high-precision, complete, and reliable data after processing.
3.1 Basic Theory of Intrusion Detection
Here are general intrusion detection processes of the power system:
1) Establish state estimation functions. The state estimation equation is:
2) Simplify the state estimation functions. In order to facilitate calculation, assumptions are as follows: the bus voltage value is approximately equal to 1; the shunt component, bus, branch circuit, and reactive power flow can be ignored. Now,
3) Modify the state estimation functions. When the price tamping attack occurs, prosumers response to change the demand loads, and the measured value vector is modified as
Now, the measurement error vector after the price tamping attack can be obtained:
3.2 Cumulative Error Detection Based on Normal Distribution
Assuming that small independent effects make an additive contribution to each observation, the measuring datum are random and have a multivariate normal distribution based on historical data analysis. So a Bayesian model is established to describe the true data
When the attacker knows the defense information of the defender (layout
When the deviation of all measured values in the vector is accumulated from the vector, the accumulated deviation will become prominent. The detection scheme studied in this section identifies attacks based on cumulative errors, such as the relationship between electricity changes and abnormal pricing measures.
Here, a space-based cumulative error detection method based on hypothesis testing is introduced. The cumulative deviation is as follows:
Here we consider two assumptions:
We assume that measurement vector
3.3 Experiment Analysis
An intrusion detection test environment is built to check the strategy’s effectiveness (Figure 3A). Its equivalent topology is shown in Figure 3B. In the Test Verification Center of the Principal Information and Safety Laboratory, the avalanche application attack test tool, Hessman switches, and Wireshark packet capture tools are used to test price tamping attacks. The communication side port connection diagram for the test process is shown in the Figure 3C.
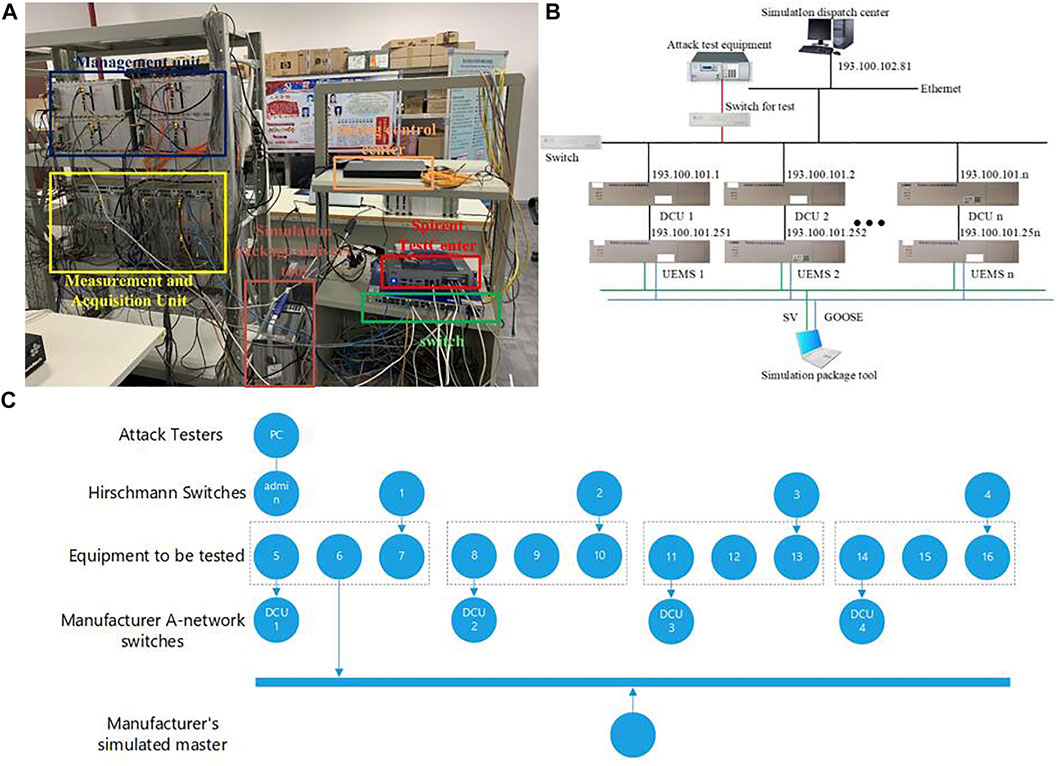
FIGURE 3. Experimental environment. (A) Attack test platform. (B) Intrusion detection test environment. (C) The communication topology with 4 DCUs.
In the experimental environment, each DCU (using 4 DCUs for simulation test) is connected to the simulation dispatch center through a Hessman switch. Simulated packet sending tools are used to send GOOSE/SV messages to UEMS, which simulates the normal output and consumption of each area on the demand side. In each DCU, the price information is collected in the information link through the packet capture tool and sent to the demand side control center regularly. In the demand side control center, the intrusion detection strategy is tested to detect the attacks. Due to limited resources, 4 DCUs are simulated in a UEMS.
The experiment test steps are as follows:
1) The input and output ports of DCU, UEMS, avalanche application attack tester, switch, and other devices are connected according to the communication topology. The DCUs are connected at all levels to the demand side control center through the communication equipment switch. Through the Hessman switch, the analog demand side control center and the switch connection port are assigned to VLAN100. Configure the DCU and switch connection ports at all levels as TRUNK ports.
2) Connect the avalanche application attack tester to the switch, and connect the port to VLAN200. Perform corresponding price tampering attacks to the DCU through the switch using MITM attack mode.
3) DCU sends the compound information message with a digital signature to the demand side control center, and the analog side control center detection unit uses the proposed intrusion strategies to judge whether the price tampering attack occurs.
4) Repeat the test to obtain the detection success rate under different price tampering attacks.
In order to reflect the superiority of the intrusion detection strategy, a horizontal comparison is carried out. The detection results of traditional single-point detection, non-parametric cumulative detection, and cumulative error detection strategies under the same attack scheme and threshold are analyzed.
The relevant parameters of the experiment 1 are set as follows:
1) Set the current market electricity price to 100 ¥/kW.
2) Set the attack method as follows: DCU1 price is tampered with 80% of the original electricity price, DCU2 price is tampered with 60% of the original electricity price, DCU3 price is tampered with the original electricity price of 100%, and DCU4 electricity price is tampered with the original electricity price of 100%.
3) Set the threshold as follows:
4) Set the number of simulations from1 to 100, and the statistics node from 1 to 10.
The detection success rate obtained by simulation is shown in Figure 4A. The abscissa shows the number of detections. The ordinate is the detection success rate. 100 trials are conducted and the detection success rate is the ratio of successful intrusion detection number in the total number of tests. During the test, the detection success rate varies with the number of tests. This is due to errors (such as communication data packet loss and communication delay) that may occur during the test. From the overall trend, the cumulative error detection mentioned can achieve a detection success rate of more than 76%, the cumulative detection success rate (73% in 100 trials), and the single-point detection success rate (66% in 100 trials). It can be seen that the detection success rate is sorted according to size: cumulative error detection success rate > non-parametric cumulative detection success rate > single point detection success rate.

FIGURE 4. Line chart. (A) comparison results of three detection methods. (B) The relationship between detection success rate and
The relationship between detection success rate and the threshold
To examine the detection success of the defense strategy against different attack methods, experiment 2 first analyzed the detection success of the strategy when attacking different regions with the same amount of price tampering attack, Table 1. The parameters for experiment 2 are set as follows.
1) Set the current market electricity price to 100 ¥/kW.
2) Based on the principle of random combination, set the following 14 attack methods when the electricity price tampering amount is 80% of the original price in an attack scenario containing four target areas.
3) Set the threshold values as follows:
4) Set the number of simulations to 100.
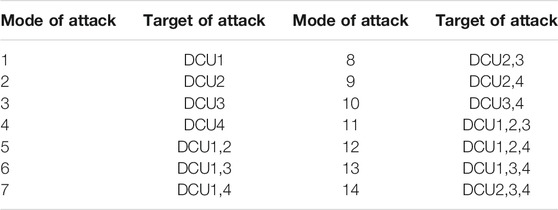
TABLE 1. Price tampering attack methods.
The detection success rate obtained from the simulation is shown in Figure 5.
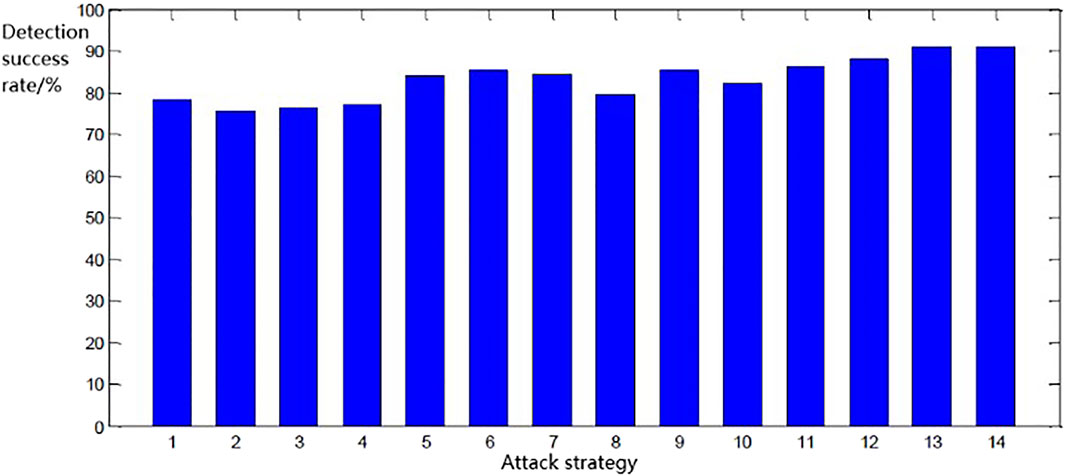
FIGURE 5. Experimental results for different tampering attacks.
The horizontal coordinates of Figure 6 represent the 14 attack methods and the vertical coordinates represent the detection success rate. From the experimental results, it can be concluded that the detection success rate is higher when the tariff tampering attack attacks more DCUs, indicating that the proposed strategy is more effective in detecting tariff tampering attacks when they occur in more areas.
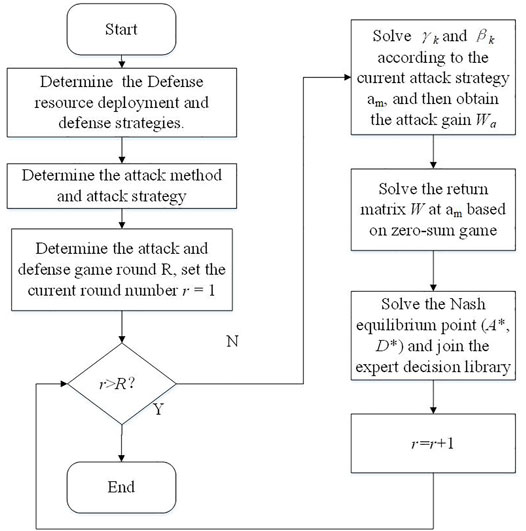
FIGURE 6. The attack and defensive strategies flow chart.
4 Defense Strategy Based on Attack Consequences
4.1 Demand-Side Response Model With Allocation Coefficient
4.1.1 Power Purchase Cost Model From the Power Grid
If the price tamping attack occurs, the demand-side prosumers respond to load shedding and power purchase from the power grid. For the regional control center, the purchasing power should satisfy the load demand in the current time period.
According to the demand-side response model, the demand-side power demand has changed under the price tampering attack. At this time, the power demand side must take certain measures to repair or restore the energy balance on the demand side.
In the area
where
4.1.2 Self-Generation Cost Model
In addition to spot price trading with the power grid, there are also ways to purchase electricity by self-generated energy resources. The internal energy system belongs to the user side, and its power generation cost is the prosumer’s electricity cost. In the area
where
In this section, two types of power purchase methods are considered: spot transactions with the power grid, and power purchase in internal energy system power generation. Therefore, the following constraint exists:
4.1.3 Load Shedding Cost Model
If the price tampering attack consequences are serious, the purchase of electricity may not fully balance the power loss load. At this time, in order to meet the demand-side power supply balance, load shedding is required in an urgent state. Following principles need to be met during load shedding: cut off from the end to the source, give priority to protecting important loads, and ensure normal area power supply.
According to the principle of load shedding, loads in different areas have different importance.
Load shedding cost is introduced to quantify the loss caused by load removal. It is related to many factors, such as user type, advance notice time, power outage duration, power outage occurrence time, and power shortage rate. The cost value affected by these factors is usually obtained by user survey, and its calculation method has been specifically analyzed by Ren et al. (2006). The load shedding cost
where
4.1.4 Integrated Defense Cost Model
In the power defense architecture, two types of power suppliers are considered: internal self-generation energy resource and external power grid under the price tampering attack. This means that two different types of electricity sellers need to be considered comprehensively when purchasing electricity. In addition, considering serious attack consequences, some areas may not be able to restore power supply balance through the purchase of electricity. At this time, it is urgent to consider cutting off the loads. To avoid further losses and restore power supply balance as quickly as possible, the system administrator needs to make a trade-off among power purchase, internal energy supply, and load shedding operation.
Load shedding is a serious consequence of a tampering attack on electricity prices. If an area is not directly connected to the external power grid after the attack, it cannot purchase the power supply and restore the loss loads. Although the power purchase scheme could meet the short-term power supply balance promptly, purchasing electricity is a tampered electricity price. The electricity price paid is higher than the normal electricity price, the power purchase cost becomes higher than before. Thus the hidden loss may have an impact in a longer period. At this time, a load loss weight coefficient
For the area
To reduce the defense cost, the demand-side emergency defense cost minimization function after the price tampering attack is as follows:
The Eq. 12 can be transformed as:
4.2 Demand-Side Defense Strategy Based on Game Theory
4.2.1 Game Elements Design
The interactive process between the cyber attacker and the grid defender is a game process. The grid defender often doesn’t know the attacker’s offensive strategy, and there is no partnership between the attacker and the defender. Therefore, it is a non-cooperative game process based on incomplete information, which can be represented by a four-tuple:
Since it is a non-cooperative zero-sum game process, the sum of the gains of both attackers and defenders is zero. If the attacker’s gain function
4.2.2 Analysis of the Non-cooperative Game Process
During the non-cooperative zero-sum game process, the attacker and the defender revolve around the reward function and adjust their strategies to obtain the maximum benefit. When both side players are at an equilibrium point, neither can adjust the strategy to obtain higher returns, thus the players have reached the equilibrium point, which is called the Nash equilibrium point.
In the price tampering attack, due to the low cost of attack and the universality of the attack modes, the attacker often has enough attack resources and can choose different attack modes. On the contrary, on the defense side, since the potential attack is unknown and the cost of defense resources is high, it is impossible to defend every link in each area. The specific game process is listed as follows:
Step 1: Determine the attacker’s offensive strategy space A including the offensive mode
Step 2: In the rth round, the attacker determines the current offensive strategy
Step 3: In the rth round, the defender determines a possible attacked area by the intrusion detection strategy. The defender finds the optimal defense target by minimizing the integrated emergency defense cost on the demand side. The defender’s gain function
Step 4: Determine whether the round number r reaches the preset total number of rounds R. If not, the Nash equilibrium point
In the game process, the attacker and the defender adjust their strategiesn in order to obtain the maximum income. When the two sides are at an equilibrium point, neither of them can obtain higher returns by adjusting strategies. When two sides reach an equilibrium state, the Nash equilibrium point is
5 Defense Simulation and Case Study
5.1 Simulation Case
In this section, an improved IEEE-33 node distribution system (Meng et al., 2015) is used to verify the effectiveness of the proposed game model. As shown in Figure 7, the IEEE-33 node distribution system is divided into 4 areas. Each area contains a DCU, which is deployed on nodes 1, 2, 5, 25. The load is divided into the industrial, residential, and commercial load. Detailed load demand before attacks is shown in Table 2.
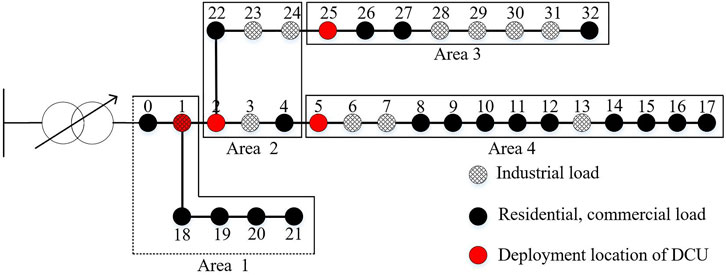
FIGURE 7. The improved IEEE-33 node distribution system with 4 areas.
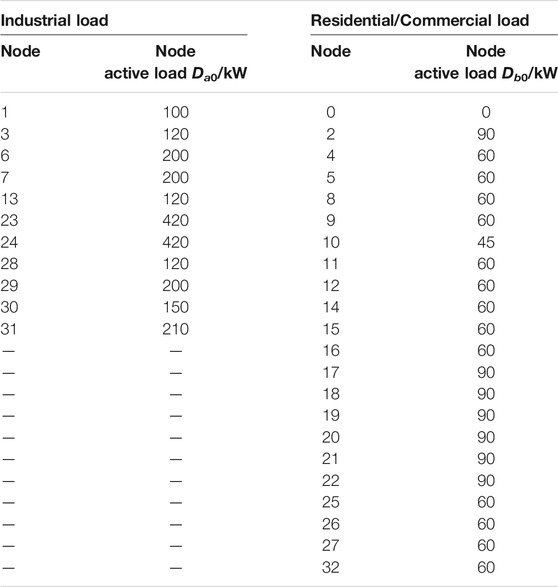
TABLE 2. IEEE-33 node distribution system parameter value.
The distribution system sets normal electricity price
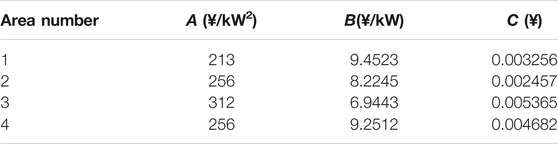
TABLE 3. Power generation cost coefficient.
Refer to Table 2,
5.2 The Load Change Analysis
In the scenario analysis, the attacker modifies the electricity price to 80% of the normal electricity price to discuss the optimal defense strategy pair. In 4 attack target areas, assuming that the number of attack target areas is not greater than 3, there are 14 selectable offensive strategy combinations.
The load changes
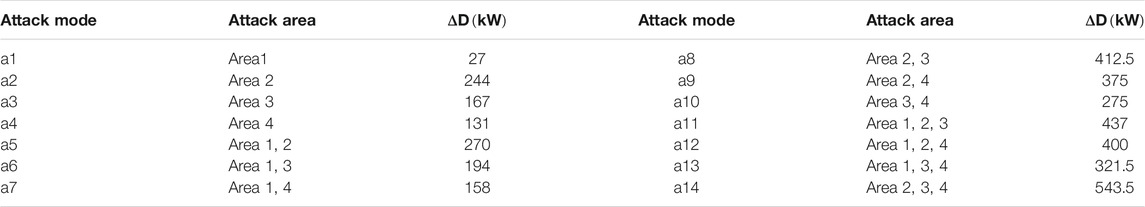
TABLE 4. The load changes under various attack modes.
5.3 Optimal
According to different load changes
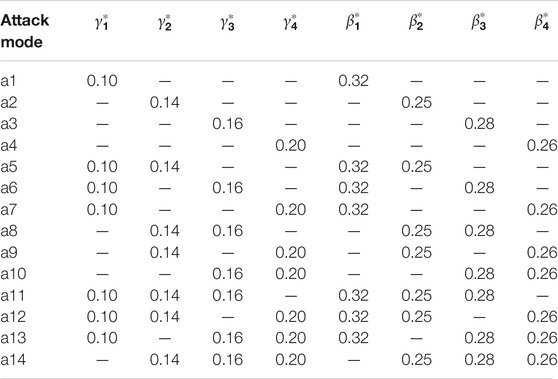
TABLE 5. Optimal values under different attack modes.
In Table 5,
5.4 Attack Loss Quantification
Under various attack modes, the electricity purchased from the external grid, self-generated power, and load-shedding capacity can be obtained, as shown in Figure 8A. The attack loss results can be further quantified as shown in Figure 8B.
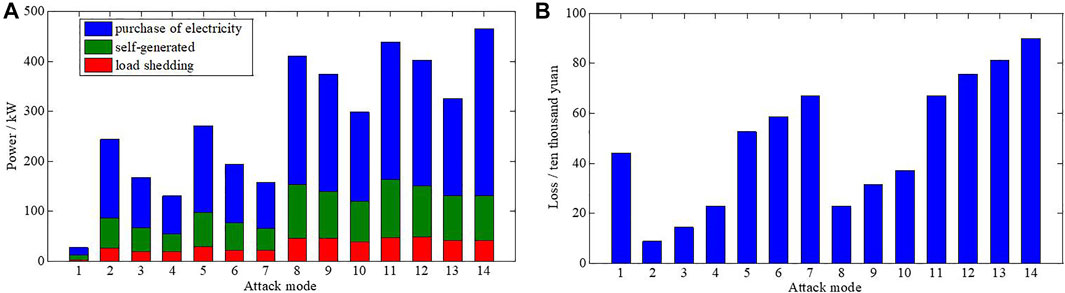
FIGURE 8. (A) Purchase of electricity, self-generated power, and load shedding under different attack modes. (B) Quantification of attack consequences.
In Figure 8B, the abscissa is the attack mode and the ordinate is the quantized loss value under attack. This illustration shows that attack method a14 causes the largest loss value of 898000¥; the attack mode a2 causes the smallest loss value of 86000¥.
In general, the loss value caused by the attack modes with more target areas is greater than that with fewer target areas. The overall loss value with three areas (attack modes a11-a14) as the attack target is greater than that of targeting two areas (attack modes a5-a10). The overall loss value of targeting two areas (attack modes a5-a10) is greater than that of targeting a single area (attack modes a1-a4).
5.5 Game Result Analysis
To reflect the defense deploy verification with limited defense resources, the deployment area of the intrusion detection strategy has been limited to less than or equal to 2, so there are currently 10 methods to deploy intrusion detecting equipment, as shown in Figure 9. In 4 attack target areas, 14 selectable offensive strategy combinations have been mentioned before, so the total number of game rounds is R = 14 * 10 = 140.
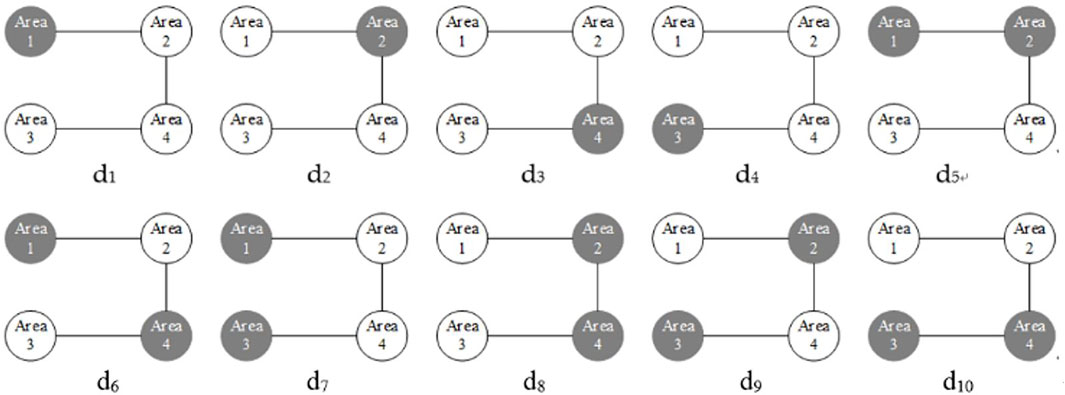
FIGURE 9. Different deployment methods.
According to the offensive strategy space and defense strategy space, the Nash equilibrium points under various attacks are obtained as shown in Table 6. The intersection of the offensive strategy and the defense strategy (green block) in Table 6 is the Nash equilibrium point under various attack modes.
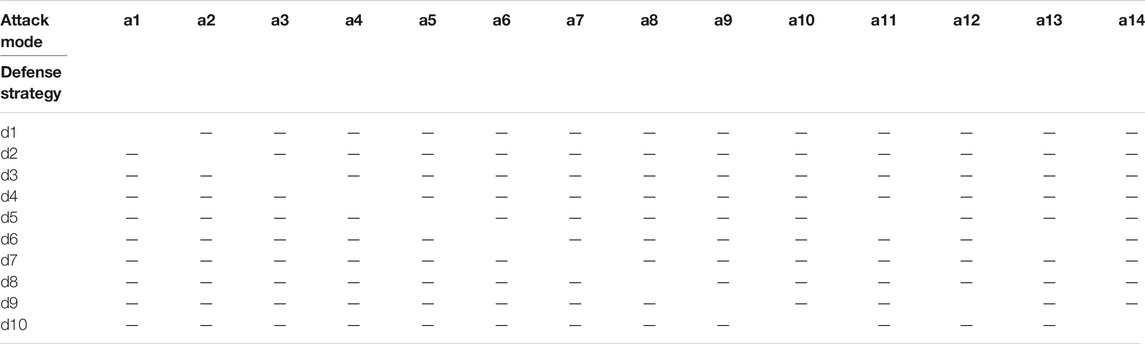
TABLE 6. Nash equilibrium point under various attack modes.
It can be found that under the condition that the offensive resources and the defense resources have sufficient configuration, the Nash equilibrium point will appear in the place where the attack target and the defense target are consistent, namely (a1, d1), (a2, d2), (a3, d3), (a4, d4), (a5, d5), (a6, d6), (a7, d7), (a8, d8), (a9, d9), (a10, d10). It matches the actual deployment situation. In the case of insufficient defense resources, the Nash equilibrium points are (a11, d5), (a12, d9), (a13, d6), (a14, d10). The optimal defense strategy is not matched the actual deployment situation.
Considering 14 attack modes, the comparison of the loss value with optimal defense strategy and without defense strategy are shown in Figure 10A. For attack mode a1 to attack mode a14, the loss values decreased by 61.4, 37.6, 56.3, 46.5, 73.2, 56.0, 22.8, 36.2, 56.8, 31.5, 52.1, 45.2, 57.2, 31.7%. The results show that the optimal defense protection strategy can significantly reduce the losses caused by attacks.

FIGURE 10. (A) Comparison of losses before and after the game defense. (B) Loss value of different defense strategies under attack mode a13.
Taking attack mode a13 as an example, the loss value of different defense strategies under 10 attack modes is shown in Figure 10B. The abscissa represents the defense strategy, and the ordinate represents the loss value under the current attack mode and defense strategy. It can be seen that the defense strategy d6 has the best defense result and the loss value is 345500¥. On the contrary, the defense strategy d2 has the worst defense result, even if it has no defense result. In summary, Nash equilibrium point (a13, d6) has the best deployment and defense strategy.
6 Conclusion
In this paper, a set of intrusion detection and defense strategies is designed. The conclusions are as follows:
1) A space-based cumulative intrusion detection method is proposed under the price tampering attack. The cumulative deviation detection strategy can not only detect the measured value of one measurement point based on normal distribution, but also detect the shortcomings of the subtle tampering of the target area. The experiment tests verified the superiority of the strategy. The detection success rate has been increased by 14% compared with the traditional detection strategy and by 3% compared with the non-parametric cumulative detection strategy.
2) A quantitative model of attack consequences is established to minimize the integrated defense cost. The model quantifies the changes in electricity caused by price tampering attacks, comprehensively considering three demand-side response methods of purchasing external grid, self-generation, and load shedding.
3) A demand-side defense strategy is established based on non-cooperative game theory. It deploys the defense resource using intrusion detection strategy, and takes the quantitative model of attack consequences as the game target. Taking into account the limited nature of defense resources, the Nash equilibrium point is solved to generate defense decisions. In the distribution system simulations, the Nash equilibrium point is solved under various attack strategies and a reference for defense matching is provided. The results show that the proposed defense protection strategy has certain effectiveness.
Data Availability Statement
The original contributions presented in the study are included in the article/Supplementary Material, further inquiries can be directed to the corresponding author.
Author Contributions
RF proposed the methodology and prepared original draft. JC conducted the theoretical analysis as well as the simulation verification. XZ and JZ carried out the experiments validation. All authors have read and agreed to the published version of the manuscript.
Funding
This research was supported by the National Natural Science Foundation of China under Grant 61633016.
Conflict of Interest
The authors declare that the research was conducted in the absence of any commercial or financial relationships that could be construed as a potential conflict of interest.
Publisher’s Note
All claims expressed in this article are solely those of the authors and do not necessarily represent those of their affiliated organizations, or those of the publisher, the editors and the reviewers. Any product that may be evaluated in this article, or claim that may be made by its manufacturer, is not guaranteed or endorsed by the publisher.
References
Ahmad, F., Adnane, A., Franqueira, V., Kurugollu, F., and Liu, L. (2018). Man-In-The-Middle Attacks in Vehicular Ad-Hoc Networks: Evaluating the Impact of Attackers' Strategies. Sensors 18 (11), 4040. doi:10.3390/s18114040
An, L., and Yang, G.-H. (2019). Distributed Secure State Estimation for Cyber-Physical Systems under Sensor Attacks. Automatica 107, 526–538. doi:10.1016/j.automatica.2019.06.019
Ashok, A., Govindarasu, M., and Wang, J. (2017). Cyber-Physical Attack-Resilient Wide-Area Monitoring, Protection, and Control for the Power Grid. Proc. IEEE 105 (7), 1389–1407. doi:10.1109/JPROC.2017.2686394
Bao, T. (2018). Multi-agent Game Solving Method for Power System Supply and Demand Interaction. Guangzhou, China: South China University of Technology.
Bharti., D., and De, M. (2019). Framework for Multipoint Optimal Reactive Power Compensation in Radial Distribution System with High Distributed Generation Penetration. Int. Trans. Electr. Energ Syst. 29 (7). doi:10.1002/2050-7038.12007
Chen, W., Pan, X., Yang, W., and Wei, L. (2017). An Intermediate Attack against Smart Meter DL/T 645-2007 Protocol. J. Shanghai Univ. Electric Power 33 (04), 378–384. CNKI:SUN:DYXY.0.2017-04-014. doi:10.3969/j.issn.1006-4729.2017.04.014
Hahn, A., and Govindarasu, M. (2011). Cyber Attack Exposure Evaluation Framework for the Smart Grid. IEEE Trans. Smart Grid 2 (4), 835–843. doi:10.1109/TSG.2011.2163829
Hu, J., Li, C., Zhao, H., and Lü, Z. (2008). The Relationship between Price Elasticity of Demand and Generation Market Equilibrium Analysis Based on Game Theory. Proc. CSEE 28 (01), 89–94. doi:10.3321/j.issn:0258-8013.2008.01.016
Jie Lin, J., Xinyu Yang, W., and Yang, X. (2013). “On False Data Injection Attack against Multistep Electricity Price in Electricity Market in Smart Grid,” in Proceedings of the IEEE Global Communications Conference (GLOBECOM), Atlanta, GA, USA, December 2013, 760–765. doi:10.1109/GLOCOM.2013.6831164
Jie, Y., Choo, K.-K. R., Li, M., Chen, L., and Guo, C. (2019). Tradeoff Gain and Loss Optimization against Man-In-The-Middle Attacks Based on Game Theoretic Model. Future Generation Comp. Syst. 101, 169–179. doi:10.1016/j.future.2019.05.078
Jun, H., Peng, X., Hongfei, W., and Yan, X. (2015). “A Distributed MPPT Control for a Hybrid Centralized-Distributed TEG Power Generation System,” in Proceedings of the IEEE 10th Conference on Industrial Electronics and Applications (ICIEA), Auckland, New Zealand, June 2015, 741–744. doi:10.1109/ICIEA.2015.7334206
Kucuk, S. (2018). “Intelligent Electrical Load Shedding in Heavily Loaded Industrial Establishments with a Case Study,” in Proceedings of the 5th International Conference on Electrical and Electronic Engineering (ICEEE), Istanbul, Turkey, May 2018, 463–467. doi:10.1109/ICEEE2.2018.8391382
Lee, W., Xiang, L., Schober, R., and Wong, V. W. S. (2015). Electric Vehicle Charging Stations with Renewable Power Generators: A Game Theoretical Analysis. IEEE Trans. Smart Grid 6 (2), 608–617. doi:10.1109/TSG.2014.2374592
Liu, D., Sheng, W., Wang, Y., Lu, Y., and Sun, C. (2015). Key Technologies and Trends of Cyber Physical System for Power Grid. Proc. CSEE 35 (14), 3522–3531. doi:10.13334/j.0258-8013.pcsee.2015.14.006
Ma, L., Liu, N., Zhang, J., Tushar, W., and Yuen, C. (2016). Energy Management for Joint Operation of CHP and PV Prosumers inside a Grid-Connected Microgrid: A Game Theoretic Approach. IEEE Trans. Ind. Inf. 12 (5), 1930–1942. doi:10.1109/TII.2016.2578184
Meng, X., Gao, J., Sheng, W., Gu, W., and Fan, W. (2015). A Day-Ahead Two-Stage Optimal Scheduling Model for Distribution Network Containing Distributed Generations. Power Syst. Tech. 39 (05), 1294–1300. doi:10.13335/j.1000-3673.pst.2015.05.019
Miao, X., Zhang, K., and Tian, S.-M. (2009). Information Communication System Supporting Smart Grid. Power Syst. Tech. 33 (17), 8–13. doi:10.7500/AEPS20160113102
Ni, M., Yan, J., and Rui, B. (2016). Thoughts on Power System Anti-malicious Information Attack. Automation Electric Power Syst. 40 (05), 148–151. doi:10.7500/AEPS20160113102
Ren, Z., Kuang, X., and Huang, W. (2006). Cost-benefit Analysis for Actualizing Interruptible Load Measure. Grid Tech. 30 (07), 22–25. doi:10.13335/j.1000-3673.pst.2006.07.005
Singh., B., Mukherjee., V., and Tiwari., P. (2019). GA-based Optimization for Optimally Placed and Properly Coordinated Control of Distributed Generations and Static Var Compensator in Distribution Networks. Energ. Rep. 5, 926–959. doi:10.1016/j.egyr.2019.07.007
Song, C. (2018). Research on Detection Method of Power Price Modification Attack in Smart Grid. Harbin, China: Harbin Institute of Technology.
Sun., L., Jin., Y., Pan, L., Shen, J., and Lee, K. Y. (2019). Efficiency Analysis and Control of a Grid-Connected PEM Fuel Cell in Distributed Generation. Energ. Convers. Manag. 195, 587–596. doi:10.1016/j.enconman.2019.04.041
Tang, Y., Chen, Q., Li, M., et al. (2016). Overview on Cyber-Attacks against Cyber Physical Power System. Automation Electric Power Syst. 40 (17), 59–69. CNKI:SUN:DLXT.0.2016-17-009.
Telaretti, E., Mineo, L., Massaro, F., Dusonchet, L., Pecoraro, F., and Milazzo, F. (2014). “A Simple Operation Strategy of Battery Storage Systems under Dynamic Electricity Pricing: An Italian Case Study for a Medium-Scale Public Facility,” in Proceedings of the 3rd Renewable Power Generation Conference (RPG 2014), Naples, September 2014, 1–7. doi:10.1049/cp.2014.0842
Tian, J.-., Wang, B.-H., and Xia., L. (2018). State-preserving Topology Attacks and its Impact on Economic Operation of Smart Grid. Power Syst. Prot. Control. 46 (1), 50–56. doi:10.7667/PSPC162060
Tong, X., and Wang, X. (2016). Inference and Countermeasure Presuppostion of Network Attack in Incident on Ukrainian Power Grid. Automation Electric Power Syst. 40 (07), 144–148. doi:10.7500/AEPS20160202101
Wang, C., and Li, P. (2010). Development and Challenges of Distributed Power Generation, Microgrid and Intelligent Distribution Network. Automation Electric Power Syst. 34 (02), 10–14. doi:10.1109/CCECE.2010.5575154
Wang, X. (2001). Block Bidding Model Based Power Market. Proc. CSEE 21 (12), 2–7. doi:10.13334/j.0258-8013.pcsee.2001.12.001
Wang, X., Shi, Z., Ren, J., and Yang, A. (2015). A Defensive Strategy against Delay Attacks on Real-Time Pricing in Smart Grids. J. Beijing Univ. Posts Telecommunications 38 (S1), 116–120. doi:10.13190/j.jbupt.2015.s1.026
Wang, Y. (2014). Research on Detection and Defense Methods against False Data Attack on Smart Grid. Beijing, China: North China Electric Power University.
Wei, L., Sarwat, A. I., Saad, W., and Biswas, S. (2018). Stochastic Games for Power Grid Protection against Coordinated Cyber-Physical Attacks. IEEE Trans. Smart Grid 9 (2), 684–694. doi:10.1109/TSG.2016.2561266
Wu, J., Tu, G., Luo, Y., and Sheng, G. (2002). Analysis of the Trading Methods in the Electricity Market. Automation Electric Power Syst. 34 (12), 24–29. CNKI:SUN:DLXT.0.2002-12-004.
Xia, Z., Fang, Z., Zou, F., Wang, J., and Sangaiah, A. K. (2019). Research on Defensive Strategy of Real-Time Price Attack Based on Multiperson Zero-Determinant. Security Commun. Networks 2019 (11), 1–13. doi:10.1155/2019/6956072
Yang, B., Yuan, Q., and Liu, H. (2018). Evaluation on Power Supply Reliability of Microgrid in Islanded Operation Mode Considering the Prediction of Distributed Generation. Proc. CSU-EPSA 31 (06), 50–54. doi:10.19635/j.cnki.csu-epsa.000058
Zhao, J., Liang, G., Wen, F., and Dong, Z. (2016). Lessons Learnt from Ukrainian Blackout: Protecting Power Grids against False Data Injection Attacks. Automation Electric Power Syst. 40 (07), 149–151. doi:10.7500/AEPS20160203101
Keywords: cyber-physical system, demand side defense, price tampering attack, game theory, load shedding
Citation: Fu R, Chen J, Zhang X and Zhang J (2021) A Comprehensive Game Theoretical Defense Strategy in Demand Side Management Against Price Tampering Attacks. Front. Energy Res. 9:763260. doi: 10.3389/fenrg.2021.763260
Received: 23 August 2021; Accepted: 02 November 2021;
Published: 25 November 2021.
Edited by:
Zimran Rafique, Higher Colleges of Technology, United Arab EmiratesReviewed by:
Kenneth E. Okedu, National University of Science and Technology, OmanYifan Wang, Northeastern University, China
Copyright © 2021 Fu, Chen, Zhang and Zhang. This is an open-access article distributed under the terms of the Creative Commons Attribution License (CC BY). The use, distribution or reproduction in other forums is permitted, provided the original author(s) and the copyright owner(s) are credited and that the original publication in this journal is cited, in accordance with accepted academic practice. No use, distribution or reproduction is permitted which does not comply with these terms.
*Correspondence: Jie Chen, Mzk5MDEwNTUwQHFxLmNvbQ==