 Chun Chen
 Yitong Wu
 Shengpeng Liu
- School of Electrical & Information Engineering, Changsha University of Science and Technology, Changsha, China
The intending island service restoration method is one of the core technologies of self-healing control for smart distribution systems, which aims to maximize the restoration of the out-of-service loads in the out-of-service area without faults quickly. For this reason, a topology-weighted directional traversal intending island recovery method considering the uncertainty of distributed generation sources is proposed. First, divide the network level of the power-loss feeder and calculate the interval power flow of the feeder before the fault, and obtain the power flow direction when the active and reactive power of the faulted branch is the smallest so as to determine whether the distributed generation supply in the non-faulty power-loss area can restore all load power supply. If not, to determine the island recovery plan, continue to compare the distributed generation supply and the load capacity at all levels, and give priority to recovering loads with higher importance levels and smaller network levels. The traversal of the topological authority and direction effectively reduces the island recovery time and can make full use of the distributed generation output to maximize the recovery of the non-faulty power-loss area. Taking the PG&E 69-node system as an example and using the BFGS trust region algorithm to calculate the island power flow without unbalanced nodes for verification, the results show that this method consumes less time and can restore more load power supply than the existing island recovery method, which verifies the method’s effectiveness and reasonability.
Introduction
In recent years, with the innovation of the power electronics technology and the rapid development of clean energy, it has become the future trend of power system development to maximize the development and utilization of new energy and insist on centralized development and distributed development simultaneously. Under these circumstances, the hydrogen production technology continues to develop. The literature (Zhang et al., 2021) proposes a multirenewable hydrogen production method to cope with the rising demand for alternative hydrogen. In this energy transition period of low carbonization and decarburization, the high penetration access of distributed generation (DG) makes the topology of the distribution system increasingly complex, increases the flexibility and diversity of the system operation mode, and provides a new path for the fault recovery of the distribution network (Yang et al., 2018); (Lee et al., 2013); (Lei et al., 2019); (Yang et al., 2017). IEEE Std.1547-2003 encourages power suppliers and users to realize isolated operation of microgrids through technical means as much as possible when the main network cannot provide reliable power (Basso and DeBlasio, 2004); (Zhao et al., 2019); (Li et al., 2019).
Through a review of the existing studies on distribution network island recovery, they mainly focus on the division of the island scheme. In the literature (Caldon et al., 2008); (Shariatzadeh et al., 2014), heuristic algorithms are adopted, and heuristic rules are determined by combining the load importance level and system power flow. Starting from the distributed power source in the island, loads of adjacent nodes are continuously increased to obtain the island recovery scheme. The literature (Wang et al., 2010) proposes a three-phase search method to divide the optimal boundary, which uses power flow tracing and generator grouping information to determine the dividing boundary. The literature (Ding et al., 2013) proposed a two-step clustering control method for island division. The literature (Moreira et al., 2007); (Zare and Shahabi, 2013) proposes the operation mode of distributed power supply for the microgrid after power failure, which effectively reduces the recovery time. The above island recovery methods do not consider the uncertainty of distributed generation and load.
For this reason, the literature (Chen et al., 2005) solves the uncertainty of distributed generation supply and load by the fuzzy algorithm and probability, but the error is large. The literature (Chen et al., 2016a) establishes a two-stage robust recovery model for the distribution network, which can still meet the safe operation standards under harsh conditions. The literature (Chen et al., 2015a) proposed a robust recovery decision method for the distribution network based on the information gap and represented uncertain problems. The above methods solve the uncertainty of the distributed generation supply output and load to a certain extent but fail to fully consider the active operation capability of distributed power supply to form islands (Gautam et al., 2021); (Chen et al., 2016b), and the effectiveness of the island generation scheme has not been verified by power flow.
Three aspects should be considered in the restoration of the distribution network island:
1) The uncertainty of distributed power supply and load should be considered to ensure the reliable operation of the intending island for a long time;
2) Optimize the island scheme to quickly maximize the load recovery;
3) Calculate the island power flow without balanced nodes to verify the effectiveness of the island scheme.
So we put forward a consideration that the distributed power supply uncertainty topology has the right to the directional traversal intending island recovery method through calculating the range trend of distributed power supply and load uncertainty, and the effectively reduced island through the topology has the right to the directional traversal recovery time and can make full use of the distributed generation output to maximize the fault of section recovery. Finally, the effectiveness of the proposed method is verified by an example, and the BFGS trust region algorithm is used to calculate the island power flow without balanced nodes.
Intending Islanding Recovery Model
In the active distribution network, power supply recovery in non-faulty power-loss areas mainly includes three methods: network reconfiguration, intending islanding, and the combination of network reconfiguration and intending islanding. As shown in Figure 1, if B1 is faulty, it is not possible to restore the power supply in the non-faulty power-loss area by closing the tie switch, that is, network reconstruction. It is necessary to divide the intending islandings and use DG2 to restore the power supply of the load in the non-faulty power-loss area.

FIGURE 1. Schematic diagram of the fault recovery method for the active distribution network.
The uncertainty of the output and load of distributed power sources often has a great impact on the distribution network. It is usually necessary to configure distributed power sources with a larger reserve capacity, consider using the interval number to represent the uncertainty problem, and calculate the interval of the power flow to characterize the uncertainty of distributed power and load.
The Objective Function
The goal of distribution network island recovery is to maximize the recovery of load power supply quickly, and priority is given to the recovery of important loads:
where d is the load node, λd is the priority level for load d to restore power supply, Pd is the active power of load d, nops is the number of switch actions, and T indicates the island recovery time.
The Constraint
1) Distributed power supply capacity constraints during island recovery
The total load capacity of the island should be less than the total capacity of the distributed power supply, and the output of the distributed power supply should be within its capacity constraints.
where Pj and Qj are the active power and reactive power of distributed power generation j, respectively; Pd and Qd are the active power and reactive power of load d, respectively; Pld and Qld are the active power loss and reactive power loss in the island, respectively. xsg and xsl are the switching states of distributed power supply and load, respectively. Pj,max and Pj,min are the maximum and minimum values of the active output of the distributed power supply, respectively. Qj,max and Qj,min are the maximum and minimum reactive output values of the distributed power supply, respectively.
2) System power flow constraint
where PGi and QGi are the active and reactive injected powers of the distributed power supply on node i, respectively; Ui and Uj are the voltages of node i and node j, respectively; Gij, Bij, and θij are the conductance, susceptance, and phase angle differences between nodes i and j, respectively.
3) Node voltage constraint
where UiL and UiR are the minimum and maximum values of the voltage range of the system node, respectively; the allowable voltage fluctuation range is ±7%, and Umin is the lower bound of the allowable node voltage range. Umax is the upper bound of the allowable node voltage range.
4) Line capacity constraints
where Sim is the interval maximum of the system line capacity; Simax is the maximum capacity of the line.
5) Network topology constraints: the active distribution network is required to maintain a radial topology.
6) Constraints of the distributed power supply control model: The distributed power supply of the isolated island should include droop control.
Research Ideas of Intending Islanding Recovery Considering the Uncertainty of Distributed Generation Supply
First, the hierarchical relationship of the feeder topology is divided, and the upper and lower relationships of each node and branch are constructed from the outlet of the feeder to the end, thereby obtaining the first and last node matrices FN and EN of each branch in the system, the network hierarchy matrix L, and the association matrix C of branch hierarchy.
In order to ensure that the divided intending islands can operate reliably for a long time, the lower bound value of the interval is taken as the data value of the power flow calculation to divide the islands. According to the divided topological hierarchical relationship, the topology-weighted directional traversal is carried out. That is, take the faulty branch as the starting point and traverse to the end direction to determine the range of non-faulty power loss, and then calculate the interval power flow of the faulty feeder through forward back substitution and obtain the power flow direction when the active and reactive power of the faulty branch is the smallest so as to determine whether the distributed power supply in the non-faulty power-loss area can restore the power supply of all loads. As shown in Figure 2, when the feeder is in normal operation, the external power supply and the distributed power supply connected in the feeder jointly supply power to the load. When a branch in the feeder fails, the power flow of the faulty branch before the failure is used to determine whether the distributed power supply in the non-faulty power-loss area can restore the power supply of all loads. Taking the power to the right as the positive direction, if P > 0 or Q > 0, it cannot be completely recovered; if P ≤ 0 and Q ≤ 0, it can be completely recovered.
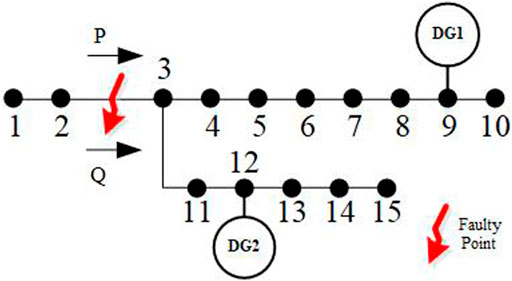
FIGURE 2. Schematic diagram of judging whether the power supply of all loads in the non-faulty power-loss area can be restored based on the results of the interval power flow calculation.
If it cannot be completely recovered, further determine the island recovery plan. By comparing the distributed power sources and the load capacities at all levels in the non-failure power-loss area, priority is given to recovering loads with a higher importance level and a smaller network level.
Due to the limited output capacity of the active and reactive power of a single distributed power supply in an island, the power flow analysis in an island is a power flow calculation without balance nodes, so traditional power flow calculation methods are not applicable. For this reason, the distributed power sources with a stable output in the system all adopt droop control, and the BFGS trust region method is used to calculate the island power flow without balance nodes, which proves the rationality of the island recovery scheme in this paper.
Interval Flow Calculation
By calculating the interval power flow of the feeder before the fault, the power flow direction when the active and reactive power of the fault branch is the smallest before the fault is obtained. The calculation process is described as follows:
First, system parameters such as voltage of the balance node and PQ node and reactive injected power of the PV node are initialized. Then, according to the network hierarchy matrix L, the first and last branch node matrices FN and EN, and the branch hierarchy association matrix C, the power forward and voltage back substitutions are carried out. In this way, the power of each branch and the voltage of each node are obtained, and then the voltage and reactive power of the PV node are continuously updated until the convergence accuracy is met.
where Cj is the set of all nodes associated with node j (except node i); Pij,t+1 and Qij,t+1 are the interval values of active power and reactive power in the i+1 power forward of branch ij, respectively; Pj,t and Qj,t are the interval values of active and reactive power of node j, respectively; ∑Pjk,t+1 and ∑Qjk,t+1 are the sums of all branches associated with node j (except branch ij); ΔPij,t+1 and ΔQij,t+1 are the active and reactive power losses of branch ij, respectively.
The Distribution Network Topology-Weighted Directional Traversal
Using the topology-weighted directional traversal method to allocate the recovery range of intending islandings, the basic idea is as follows:
According to the divided topological hierarchy, all distributed power sources in the non-faulty power-off area are traversed, and the sum of active ∑PG and reactive ∑QG capacity of all distributed power sources in the non-faulty power-off area is calculated, so is the sum of the active and reactive power of all levels of loads in the non-faulty power-off area before the fault. Then, the island recovery scheme is obtained by comparing the distributed power supply and the load capacity of all levels to recover the load with a smaller network level and a higher importance level first.
Calculation of Power Flow for the Island Without Balanced Nodes Based on the BFGS Trust Region Algorithm
A power flow calculation method without balanced nodes is adopted to verify the power flow of the divided island. The basic idea is as follows:
First, a trust region radius Δk (Δk > 0) is given, and then a trust region is obtained with the current iteration point as the center and Δk as the radius. In this trust region, a quadratic model is used to approximate the objective function h(x), and the minimum value point of the quadratic model in the trust region is taken as the next candidate iteration point. If the candidate iteration point can reduce the objective function sufficiently, the candidate iteration point is accepted as the next iteration point; otherwise, it is necessary to reduce Δk and iterate again until the termination condition of the iteration is met.
The core of the BFGS trust region algorithm is the solution of trust region subproblem, that is, the solution of the minimum value of the quadratic model for the objective function in the trust region. The trust region subproblem can be expressed as
where gk is the gradient vector of the objective function h(x) at the iteration point x(k), q(S(k)) is the objective function of the trust region subproblem, Bk is the approximate matrix of the Hessian matrix modified by the BFGS algorithm, and the candidate iteration points can be obtained by solving the trust region subproblem (Eq. 10). An evaluation function is used to determine whether to accept the candidate iteration point as the next iteration point and update the trust region radius.
The Solution Steps of the Intending Islanding Recovery Model
Considering the uncertainty of distributed power generation, the overall idea of the topology-weighted directional traversal intending islanding recovery method is as follows: First, we divide the feeder network level and calculate the losing electricity fault feeder range trend, obtaining the power flow direction when the active and reactive power of the faulted branch is the smallest. Through this way, whether the fault zone of the distributed power supply can recover all losing electricity load power supply can be determined. If not, we continue to compare the distributed power supply and load capacity at all levels, prioritize recovery of loads with higher importance levels and smaller network levels, and determine the island recovery plan.
Step 1: Divide the hierarchical relationship of the feeder topology and obtain the first and last node matrices FN and EN of each branch, the network hierarchy matrix L, and the association matrix C of branch hierarchy.
Step 2: Input the fault signal, and according to the divided topological hierarchical relationship, the traversal direction is determined through the branch hierarchy association matrix C. Starting from the faulty branch, traverse to the end node to determine the range of the non-faulty power-loss area.
Step 3: Calculate the interval power flow of the feeder before the fault, and obtain the power flow direction when the active and reactive power of the faulted branch is the smallest so as to determine whether the distributed power supply in the non-faulty loss area can restore power supply of all loads.
The specific determination method is as follows: if the active or reactive power of the faulted branch before the fault flows into the non-faulty loss area, it cannot be fully recovered; if the active and reactive power flows out of the non-faulty loss area or the active power and reactive power are both 0, it can be fully recovered.
Step 4: Traverse all distributed power sources and primary, secondary, and tertiary loads in the non-faulty power-loss zone, calculating the sum of active and reactive powers of all first-level loads in the non-failure power-off area before failure: ∑PL1 and ∑QL1, the sum of active and reactive powers of all second-level loads: ∑PL2 and ∑QL2, the sum of active and reactive powers of all third-level loads: ∑PL3 and ∑QL3, and the sum of the active and reactive capacities of all distributed power sources: ∑PG and ∑QG.
Step 5: Compare the capacities of the distributed power sources and load at all levels in the non-failure power-loss area, and give priority to restoring the power supply to the loads with higher importance levels and smaller network levels.
The specific comparison process is as follows: if ∑PG>∑PL1 and ∑QG>∑QL1, then the distributed power supply in the non-failure area can recover all the first-level loads and continue to recover the second-level loads; otherwise, it cannot recover all the first-level loads. If ∑PG>∑PL1+∑PL2 and ∑QG>∑QL1+∑QL2, then the distributed power supply in the non-failure area can recover all the first and second level loads, and continue to recover the third level loads; otherwise, it cannot recover all the second level loads, and then, it can only recover all the first-level loads and the second-level loads with a smaller network layer successively through the topology directional traversal. If ∑PG>∑PL1+∑PL2+∑PL3 and ∑QG>∑QL1+∑QL2+∑QL3, then the distributed power supply in the non-failure area can restore the power supply of all the loads; otherwise, it cannot restore the power supply of all the third-level loads, and then only all the first-level and second-level loads and third-level loads with a smaller network layer can be restored Figure 3.
Step 6: Connect distributed power sources in non-faulty power-loss areas to the grid to generate islanding solutions and complete island recovery.
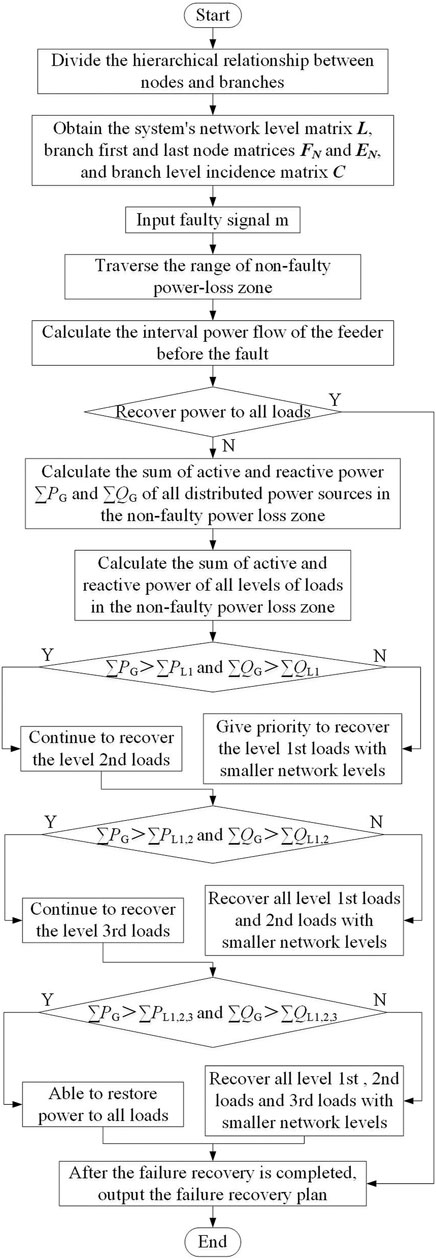
FIGURE 3. Flowchart of intending islanding recovery considering the uncertainty of distributed generation.
The Example Analysis
In order to verify the fastness and effectiveness of the proposed method, the PG&E69 node distribution network system in Figure 4 is used as a simulation example for the interval power flow calculation, and the specific parameters of the interval power flow calculation are referred in the literature (Chen et al., 2015b). The specific parameters of the distributed generation connected to the system are shown in Table 1, the distributed generation with a stable output (including energy storage, the gas generator, and the diesel generator) uses the droop control, and the active and reactive power droop coefficients, respectively, in 300 and 20, take wind turbines and photovoltaics as PQ nodes. Take ±10% for photovoltaic output fluctuations, ±20% for wind turbine output fluctuations, and ±5% for load fluctuations. The allowable voltage fluctuation range is ±7%, and the maximum capacity of the line is 6000 kVA. All the load switches in the system are controllable. MATLAB 2016b is used to verify the method in this paper, Table 2.
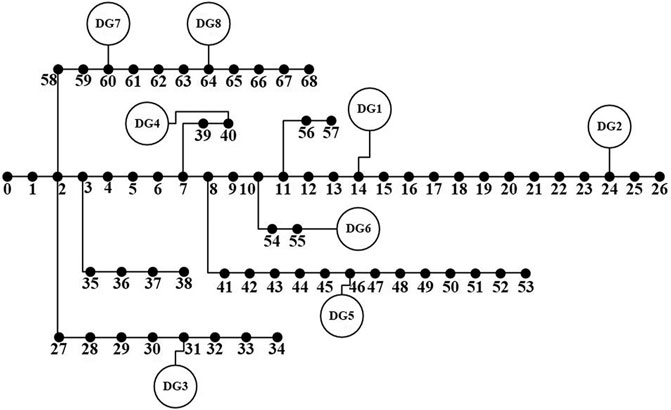
FIGURE 4. PG&E 69-node distribution network system.

TABLE 1. PG&E 69-node system distributed generation parameters.

TABLE 2. Load severity.
The Island Recovery Scheme of the Method in This Paper
Scenario 1: Select the faulty branch as 0–1. According to the island recovery method in this paper, first quickly isolate the faulty branch 0–1, and traverse the faulty branch 0–1 as the starting point to the end according to the divided topological hierarchical relationship. The determined non-faulty power-loss area is shown in Figure 5.
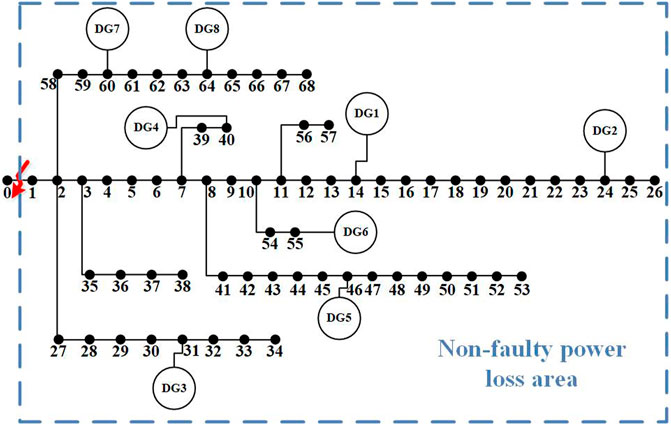
FIGURE 5. Schematic diagram of the non-faulty power-loss area when the faulty branch is 0–1.
Taking the right direction as the positive direction, the per-unit value of the branch 0–1 before the fault is 0.0172 when the active power is the smallest, and the per-unit value when the reactive power is the smallest is 0.0142, so it is impossible to restore the power supply of all loads in the non-faulty power-loss area.
Continue to calculate the sum of the active power per unit value of the primary load ∑PL1 in the non-faulty power-loss zone before the fault is 0.0685, the sum of the reactive power per unit value of the primary load ∑QL1 is 0.0489, the sum of the active power per unit value of the secondary load ∑PL2 is 0.0442, and the sum of the reactive power per unit value of the secondary load ∑QL2 is 0.0355. Traverse the distributed power sources in the non-faulty power-loss area, and calculate the sum of the active capacity per unit value of all distributed power sources in the non-faulty power-loss area ∑PG as 0.1438; the sum of the reactive power capacity per unit value ∑QG is 0.0630, ∑ PG>∑PL1+∑PL2, ∑QG<∑QL1+∑QL2; therefore, the distributed power supply in the non-faulty power-loss zone can restore all primary loads but cannot restore all secondary loads. Take the faulty branch as the starting point and traverse to the end direction, and give priority to recovering the secondary load with the smaller network level.
Scenario 1: Island recovery includes load nodes 1 to 14, 19 to 21, 30, 32 to 34, 39 to 42, 47, 50 to 51, 53 to 54, 58 to 61, and 67. The total recovery load of the island is 887.46 kW, among which the first-level recovery load is 684.51 kW, accounting for 77.13% of the total recovery load.
Scenario 2: Select faulty branches 6–7 and 27–28. First, the topology hierarchical relationship is divided and the interval power flow of the feeder before the fault is calculated. The fault branches 6–7 and 27–28 are respectively taken as the starting point and traversed to the end direction. The determined range of the non-fault power-off area is shown in Figure 6.
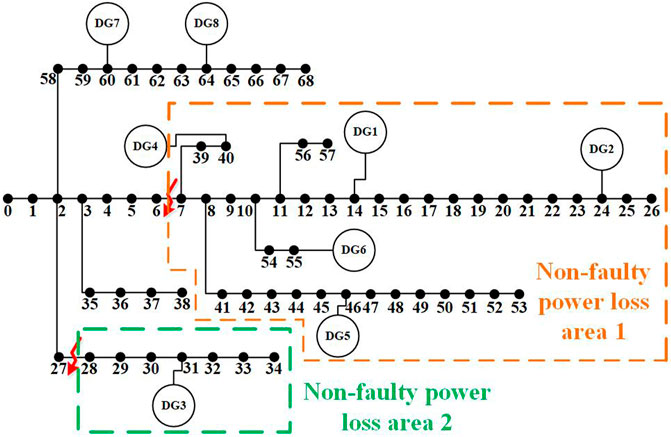
FIGURE 6. Schematic diagram of the non-faulty power-loss area when the faulty branch is 6–7 and 27-28.
As shown in Figure 6, in non-fault power-loss zone 1, the unit value of the branch 6–7 before the fault is 0.0030 for the minimum active power and 0.0022 for the minimum reactive power. Therefore, the power supply of all loads in the non-fault power-loss zone cannot be restored. Continue to calculate the sum of the unitary value of the active power of the first-level load in non-failure area 1 ∑PL1, which is 0.0184, the sum of the unitary value of the reactive power of the first-level load is 0.0131, the sum of the active power of the second-level load is 0.0353, and the sum of the unitary value of the reactive power of the second-level load is 0.0182. The sum of the uncharacteristic value of the active power of the third-level load is 0.0352, and the sum of the uncharacteristic value of the reactive power of the third-level load is 0.0252. The distributed power supply in the non-failure power-loss area is traversed, and the sum of the uncharacteristic value of the active power capacity of all distributed power supply in the non-failure power-loss area is calculated to be 0.0908, and the sum of the uncharacteristic value of the active power capacity of all distributed power supply in the non-failure power-loss area is calculated to be 0.0908.The sum of the unit value of reactive capacity ∑QG is 0.0350, ∑PG>∑PL1+∑PL2+∑PL3, and ∑QG<∑QL1+∑QL2+∑QL3. Therefore, the distributed power supply in the non-failure area can restore all the first and second load power supply but not all the third load power supply. The fault branch is traversed from the starting point to the end, and the third-level load with a smaller network layer is recovered preferentially. Finally, the load recovery nodes in non-fault power-off area 1 include 7 to 21, 39 to 45, 47 to 48, 50 to 51, and 53 to 57.
As shown in Figure 6, DG3 can restore all the load power supply in non-fault power-off area 2. The recovery load nodes in island 2 include 28–34.
In scenario 2, the total recovery load of the island is 794.40 kW, of which the first-level recovery load is 183.91 kW, accounting for 23.15% of the total recovery load.
Comparison With Other Methods of Island Recovery
Table 3 shows the comparison of the four island recovery methods when the faulty branch is 0–1. The island recovery method in this paper has a load loss rate of only 48.61% in the non-faulty power-loss area, which is significantly improved compared to the other three methods. It can restore more load power supply in the non-faulty power-loss area, and the number of switching actions is less.
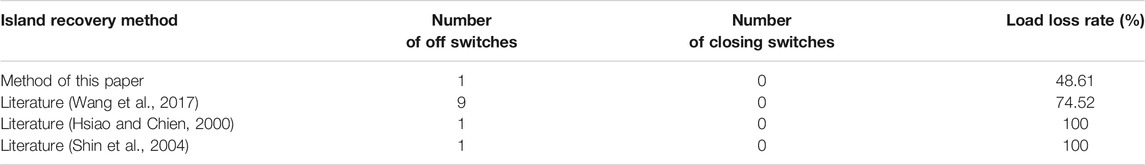
TABLE 3. Comparison of four island recovery methods when the faulty branch is 0–1
Table 4 shows the comparison of the four island recovery methods when the fault branch is 6–7 and 27–28. The calculation time of the island recovery method in this paper is only 0.36s, which has obvious advantages compared with the other three methods. In the literature (Hsiao and Chien, 2000) and (Shin et al., 2004) are intelligent optimization algorithms, which take a long time to calculate and tend to fall into local optimal solutions. The literature (Wang et al., 2017) improves the calculation time to a certain extent and divides islands by search path, but it cannot carry out fast traversal based on the network topology level, and the computational complexity is still large.

TABLE 4. Comparison of four island recovery methods when the faulty branch is 6–7 and 27–28.
By selecting the two island recovery scenarios of fault branches 0–1 and 6–7 and 27–28 and comparing them with the other three island recovery methods, the proposed method can recover more load power supply in the non-fault loss area in a shorter calculation time and has fewer switching operations.
The Power Flow Verification of the Island Recovery Scheme is Presented in This Paper
In order to fully consider the uncertainty of distributed power supply and load and ensure that the distributed power supply in the intending islanding can reliably supply power to the load for a long time, the power flow verification of the island recovery scheme in scenario 1 and scenario 2 is carried out, respectively, in the following two states:
1) State 1: the output of distributed power supply is minimum, and the load is maximum;
2) State 2: maximum output and minimum load of distributed power supply.
Scenario 1: Figure 7 shows the voltage distribution of each node in the island in the two states. The maximum value of node voltage is 0.985, and the minimum value is 0.931. The maximum line load factor is 0.853. The island frequency in state 1 and state 2 is stable at 50.06 and 50.10 Hz, respectively. Therefore, the voltage of each node in the island, the maximum line load rate, and the system frequency all meet the requirements of safe operation.

FIGURE 7. Scenario 1: voltage distribution of each node in the island under the two states.
Scenario 2: Figure 8 shows the voltage distribution of each node in the island in the two states. The maximum unit value of node voltage is 1.016, and the minimum is 0.953. The maximum line load factor is 0.811. The frequencies of island 1 and island 2 in state 1 are 50.10 and 50.17 Hz, respectively. In state 2, the frequencies of island 1 and island 2 are 50.12 and 50.20 Hz, respectively. Therefore, the voltage of each node in the island, the maximum line load rate, and the system frequency all meet the requirements of safe operation.
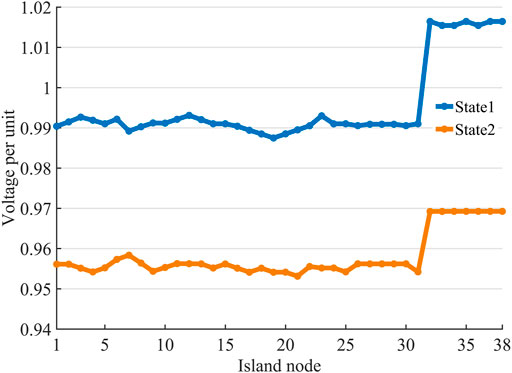
FIGURE 8. Scenario 2: voltage distribution of each node in the island under the two states.
By calculating the island power flow without balanced nodes in scenario 1 and scenario 2, the isolated islands divided by the method in this paper can meet the requirements of safe operation under the two states of a minimum distributed power output with maximum load and a maximum distributed power output with minimum load, which verifies the rationality and effectiveness of the method in this paper.
Conclusion
This paper proposes an intending islanding service restoration method with topology-weighted directional traversal which considers the uncertainty of the distributed generation supply. First, divide the network level of the power failure feeder and calculate the interval power flow of the feeder before the fault. Afterward, determine whether the distributed power supply in the non-faulty power-loss area can restore the power supply of all loads according to the power flow direction when the active and reactive power of the faulty branch is minimum. Then, compare the distributed power supply and the load capacity at all levels to determine the island service restoration plan. Finally, take the PG&E 69-bus system as an example, compare it with other methods, and use the unbalanced node power flow calculation method to verify the island scheme in this paper. The conclusion is as follows:
1) Characterize the uncertainty of the distributed power and load by calculating the interval power flow and the interval trend lower value as the wave of interval data, and ensure the reliable operation of the intending island for a long time;
2) The network topology-weighted directional traversal, which reduces the complexity of network topology traversal, effectively reduces the island service restoration time and makes full use of distributed generation supply to maximize the service restoration of out-of-service areas without faults;
3) By calculating the island power flow of unbalanced nodes, the power flow verification of the island generating scheme is carried out to prove the effectiveness of the island service restoration method in this paper.
Data Availability Statement
The original contributions presented in the study are included in the article/Supplementary Material; further inquiries can be directed to the corresponding author.
Author Contributions
CC: conceptualization, methodology, software, formal analysis, data curation, writing—original draft, writing—review and editing, project administration, and funding acquisition; YW: software, data curation, writing—original draft, and visualization; YC: conceptualization and supervision; SL: writing—review and editing; QY: methodology; WW: conceptualization.
Funding
Project supported by International Science and Technology Cooperation Program of China under Grant (No. 2018YFE0125300), National Natural Science Foundation of China (NSFC) (52007009, 52077189); Hunan Natural Science and Technology Fund Project (2020JJ5574); Outstanding Youth Project of Hunan Provincial Department of Education (19B003).
Conflict of Interest
The authors declare that the research was conducted in the absence of any commercial or financial relationships that could be construed as a potential conflict of interest.
Publisher’s Note
All claims expressed in this article are solely those of the authors and do not necessarily represent those of their affiliated organizations or those of the publisher, the editors, and the reviewers. Any product that may be evaluated in this article or claim that may be made by its manufacturer is not guaranteed or endorsed by the publisher.
References
Basso, T. S., and DeBlasio, R. (2004). IEEE 1547 Series of Standards: Interconnection Issues. IEEE Trans. Power Electron. 19 (5), 1159–1162. doi:10.1109/tpel.2004.834000
Caldon, R., Stocco, A., and Turri, R. (2008). Feasibility of Adaptive Intentional Islanding Operation of Electric Utility Systems with Distributed Generation. Electric Power Syst. Res. 78 (12), 2017–2023. doi:10.1016/j.epsr.2008.06.007
Chen, C., Wang, F., Zhou, B., Chan, K. W., Cao, Y., and Tan, Y. (2015). An Interval Optimization Based Day-Ahead Scheduling Scheme for Renewable Energy Management in Smart Distribution Systems. Energ. Convers. Manage. 106 (14), 584–596. doi:10.1016/j.enconman.2015.10.014
Chen, C., Wang, J., Qiu, F., and Zhao, D. (2016). Resilient Distribution System by Microgrids Formation after Natural Disasters. IEEE Trans. Smart Grid 7 (2), 958–966. doi:10.1109/tsg.2015.2429653
Chen, K., Wu, W., Zhang, B., and Sun, H. (2015). Robust Restoration Decision-Making Model for Distribution Networks Based on Information Gap Decision Theory. IEEE Trans. Smart Grid 6 (2), 587–597. doi:10.1109/tsg.2014.2363100
Chen, W.-H., Tsai, M.-S., and Kuo, H.-L. (2005). Distribution System Restoration Using the Hybrid Fuzzy-Grey Method. IEEE Trans. Power Syst. 20 (1), 199–205. doi:10.1109/tpwrs.2004.841234
Chen, X., Wu, W., and Zhang, B. (2016). Robust Restoration Method for Active_newline Distribution Networks. IEEE Trans. Power Syst. 31 (5), 4005–4015. doi:10.1109/tpwrs.2015.2503426
Ding, L., Gonzalez-Longatt, F. M., and Wall, P. (2013). Two-step Spectral Clustering Controlled Islanding Algorithm. IEEE Trans. Power Syst. 28 (1), 514–521. doi:10.1109/tpwrs.2012.2197640
Gautam, P., Piya, P., and Karki, R. (2021). Resilience Assessment of Distribution Systems Integrated with Distributed Energy Resources. IEEE Trans. Sustain. Energ. 12 (1), 338–348. doi:10.1109/tste.2020.2994174
Hsiao, Y.-T., and Chien, C.-Y. (2000). Enhancement of Restoration Service in Distribution Systems Using a Combination Fuzzy-GA Method. IEEE Trans. Power Syst. 15 (4), 1394–1400. doi:10.1109/59.898118
Lee, C. K., Chaudhuri, B., and Hui, S. Y. (2013). Hardware and Control Implementation of Electric Springs for Stabilizing Future Smart Grid with Intermittent Renewable Energy Sources. IEEE J. Emerg. Sel. Top. Power Electron. 1 (1), 18–27. doi:10.1109/jestpe.2013.2264091
Lei, S., Chen, C., Li, Y., and Hou, Y. (2019). Resilient Disaster Recovery Logistics of Distribution Systems: Co-optimize Service Restoration with Repair Crew and mobile Power Source Dispatch. IEEE Trans. Smart Grid 10 (6), 6187–6202. doi:10.1109/tsg.2019.2899353
Li, Y., Xiao, J., Chen, C., Tan, Y., and Cao, Y. (2019). Service Restoration Model with Mixed-Integer Second-Order Cone Programming for Distribution Network with Distributed Generations. IEEE Trans. Smart Grid 10 (4), 4138–4150. doi:10.1109/tsg.2018.2850358
Moreira, C. L., Resende, F. O., and Lopes, J. A. P. (2007). Using Low Voltage Microgrids for Service Restoration. IEEE Trans. Power Syst. 22 (1), 395–403. doi:10.1109/tpwrs.2006.888989
Shariatzadeh, F., Vellaithurai, C. B., Biswas, S. S., Zamora, R., and Srivastava, A. K. (2014). Real-time Implementation of Intelligent Reconfiguration Algorithm for Microgrid. IEEE Trans. Sustain. Energ. 5 (2), 598–607. doi:10.1109/tste.2013.2289864
Shin, D.-J., Kim, J.-O., Kim, T.-K., Choo, J.-B., and Singh, C. (2004). Optimal Service Restoration and Reconfiguration of Network Using Genetic-Tabu Algorithm. Electric Power Syst. Res. 71 (2), 145–152. doi:10.1016/j.epsr.2004.01.016
Wang, C. G., Zhang, B. H., and Hao, Z. G. (2010). A Novel Real-Time Searching Method for Power System Splitting Boundary. IEEE Trans. Power Syst. 25 (4), 1902–1909. doi:10.1109/tpwrs.2010.2045012
Wang, F., Chen, C., Li, C., Cao, Y., Li, Y., Zhou, B., et al. (2017). A Multi-Stage Restoration Method for Medium-Voltage Distribution System with DGs. IEEE Trans. Smart Grid 8 (6), 2627–2636. doi:10.1109/tsg.2016.2532348
Yang, H., Pan, H., Luo, F., Qiu, J., Deng, Y., Lai, M., et al. (2017). Operational Planning of Electric Vehicles for Balancing Wind Power and Load Fluctuations in a Microgrid. IEEE Trans. Sustain. Energ. 8 (2), 592–604. doi:10.1109/tste.2016.2613941
Yang, Yu., Mi, Z., Guo, X., Niu, X., Zheng, X., and Sun, C. (2018). Control Design and Implementation of a Spiral spring Energy Storage System Connected to a Grid via PMSG. CSEE J. Power Energ. Syst. 4 (3), 339–351. doi:10.17775/cseejpes.2016.00860
Zare, E., and Shahabi, M. (2013). Microgrid Restoration after Major Faults in Main Grid with Automatic and Constant Time Switching. Ijisa 5 (10), 50–58. doi:10.5815/ijisa.2013.10.07
Zhang, K., Zhou, B., Or, S. W., Li, C., Chung, C. Y., and Voropai, N. I. (2021). “Optimal Coordinated Control of Multi-Renewable-To-Hydrogen Production System for Hydrogen Fueling Stations,” in Proceeding of the IEEE Trans. on Ind. Applicat., 30 June 2021 (IEEE), 1. doi:10.1109/TIA.2021.3093841
Keywords: uncertainty of distributed generation, active distribution network, network topology level, non-faulty power-loss area, right to orientation, intending island
Citation: Chen C, Wu Y, Cao Y, Liu S, Tan Q and Wang W (2021) Intending Island Service Restoration Method With Topology-Powered Directional Traversal Considering the Uncertainty of Distributed Generations. Front. Energy Res. 9:762491. doi: 10.3389/fenrg.2021.762491
Received: 22 August 2021; Accepted: 20 September 2021;
Published: 27 October 2021.
Edited by:
Bin Zhou, Hunan University, ChinaReviewed by:
Xubin Liu, Huazhong University of Science and Technology, ChinaWentao Huang, Shanghai Jiao Tong University, China
Cong Zhang, Hunan University, China
Copyright © 2021 Chen, Wu, Cao, Liu, Tan and Wang. This is an open-access article distributed under the terms of the Creative Commons Attribution License (CC BY). The use, distribution or reproduction in other forums is permitted, provided the original author(s) and the copyright owner(s) are credited and that the original publication in this journal is cited, in accordance with accepted academic practice. No use, distribution or reproduction is permitted which does not comply with these terms.
*Correspondence: Chun Chen, Y2hjaDMyNjZAMTI2LmNvbQ==