 Guangjie Peng1*
 Hao Chang
- 1Research Center of Fluid Machinery Engineering and Technology, Jiangsu University, Zhenjiang, China
- 2Xiangyang Wuerwu Pump Co., Ltd, Xiangyang, China
- 3School of Mechanical Engineering, Nantong University, Nantong, China
Slurry pump as an important equipment for transporting coal, which are widely used in power plants, mines and other fossil energy field. Therefore, the improvement of slurry pump performance can effectively reduce the energy loss of fossil energy industry. In this paper, a novel impeller with splitter blade structure was proposed, and the internal flow field of slurry pumps with different impeller structures was analyzed. Meanwhile, according to the shape and structure of the vortex in slurry pump, the vortex can be divided into leading edge vortex, trailing edge vortex and gap leakage vortex by employing the Q criterion, and the generation mechanism of each vortex and relationship between vortex strength and flow condition were analyzed. What is more, the entropy generation theory was employed to study the energy loss of slurry pump. The pressure distribution and wear characteristics of different impeller structures under two-phase flow conditions are studied. The result shows that the energy loss caused by entropy production in the slurry pump can be declined by employing the splitter blades, which can restrain the flow separation at the impeller outlet. Thus, the impeller with splitter blades not only can reduce the energy loss of the slurry pump, but also enhance the wear characteristics of impeller under two-phase flow conditions. Finally, the result can provide the guidelines for the design optimization of slurry pump.
Introduction
Slurry pump as an important equipment for transporting coal, which are widely used in power plants, mines and other fossil energy field. Since the conveyed medium is solid-liquid two-phase flow, the wear characteristic and hydraulic performance of the slurry pump as the important influence factor. Therefore, a lot of investigations were carried out to improve the performance of slurry pump. Wang et al. (2021a) studied the influence of migration characteristics of particles on the flow and wear of the pump based on CFD-DEM coupling algorithm, they found that the intensity and scale of the vortex can be enhanced by increasing particle diameter. Abdolahnejad et al. (2021) studied the influence of slip factor variations on the head of centrifugal pumps, the Newtonian glass bead-water (GBW) and non-Newtonian kaolin water (KW) slurry flows were employed as the analysis medium, the result shows that decrement of slip factor for GBW is more severe than KW. Alawadhi et al. (2021) applied the response surface methodology to optimize the vane and blade geometry parameters of slurry pump. F. Khalil et al. (2013) investigated the impaction of pump performance under different concentrations of fluid. The influence of the solid concentration, specific gravity, and particle size on the head reduction was obtained. Kumar et al. (2014) studied the relationship between the slurry pump performance and the viscosity of conveying fluid by experiment. The result presents that with the decline of conveying fluid viscosity, the head and efficiency of slurry pump are continuously decreased. Meanwhile, Duarte et al. (2015) analyzed the erosion characteristic of solid-liquid two-phase flow in an elbow. They showed that when the particle concentration is higher than 20%, as the particle concentration increases, the growth efficiency of tube wall wear gradually decreases, which results from the buffer effect. Salim et al. (2015) studied the effect of size and slurry concentration on the performance of the slurry pump at different speeds, the result reported that with the increase of particle size, specific gravity, and solid concentration, the head and efficiency gradually decrease, but the input power continuously increases. Sellgren and Addie (2010) analyzed the pump efficiency and head under different particle concentrations by experiment. Results observed that when the weight concentration of solid particles in the conveying fluid is greater than 40%, the decreased amplitude of efficiency is greater than the decreased amplitude in the head. Tarodiya and Gandhi (2019) used the sliding grid method to study the impact of three different particle sizes on the performance of slurry pumps. They found that particles with high specific gravity have little effect on the head and efficiency. Tarodiya and Gandhi (2021) combined an erosion model to analyze the wear of the impeller and volute by simulation. The result presents that surface material removal rate and higher erosion zone were mainly caused by the variation of flow rate and solid particle size. Wang et al. (2012) used the Eulerian multiphase model to study the effect of particle concentration on the performance of slurry pumps. They observed that at high concentrations, the decrease in pump performance is mainly caused by friction loss. Xiao et al. (2019) analyzed the influence of different fluid flow characteristics on erosion by tracking particles in the Lagrangian frame. They found that the flow characteristics and the type of erosion are mainly caused by variations in the geometry of the flow components. Peng et al. (2020) applied the Euler-Euler method to analyze the flow performance of slurry pumps under different particle concentrations and small flow conditions. The result shows that when the slurry pump under part-load flow condition, the internal flow field is unstable and local wear is severe. Wang et al. (2021b) studied the unsteady flow of slurry pumps under different particle diameters, and they found that particles with different diameters have a limited impact on the hydraulic performance of the pump at low concentrations.
It can be seen that much research about the influence of particle properties on pump performance was carried out. However, most research focuses on the effect of different solid-phase particle parameters on the hydraulic performance of slurry pumps, but there are few studies on optimizing the design of slurry pump flow components to improve their service life. In this paper, a new impeller with splitter blade structure was proposed, and the internal flow field of slurry pumps with different impeller structures was analyzed. The pressure distribution, vortex structure, entropy generation are investigated by employing the Q criterion and entropy generation theory, and the wear characteristics of impeller under two-phase flow conditions are studied. Finally, the result of this paper can provide the guidelines for the design optimization of slurry pump.
Computational Methods
Computational Model
In this paper, a splitter blade is designed which arranged at the exit of impeller flow channel, as shown in Figure 1. The number of splitter blades is the same as the blades, and the splitter blades profile is close to the blade profile. The main geometric parameters are shown in Table 1. The arrangement of splitter blades on the hub is shown in Figure 1.
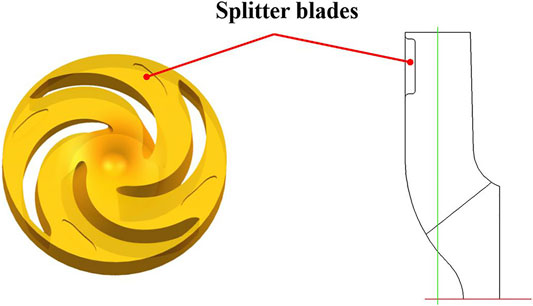
FIGURE 1. The arrangement of splitter blades on the hub of impeller.
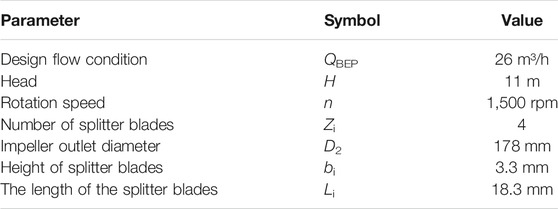
TABLE 1. Main parameters of slurry pump.
Mesh Generation
In this paper, the computational domain of slurry pump is meshed by ICEM-CFD. The quality and quantity of grid have a great influence on the convergence and reliability of the numerical simulation results. The greater number of grids and higher grids quality, which ensure more accurate calculation results can be obtained. However, too many grids will consume a lot of computing resources. Therefore, to ensure the accuracy of the numerical simulation results and rational consumption of computer resources, the grid independence of the computational domain is carried out. The calculation domain of main components is divided into a hexahedral structured grid. The structure grid is shown in Figure 2.
FIGURE 2. Mesh generation of calculation domains. (A) Impeller single channel. (B) Volute.
In this section, five sets of slurry pump models with different grid numbers are selected to carry out the steady flow calculations under optimal flow conditions. Finally, a set of reasonable grid numbers are selected by observing fluctuations in head and efficiency. As shown in Table 2, as the number of grids changes, the fluctuation of the head is within 0.9%, and the fluctuation of the efficiency is within 0.3%. When the grid number at 1.56 million, the fluctuation of the external characteristics is already less than 1.0%. Therefore, the grid number is 1.56 million and the Y+ is less than 30, which can meet the requirements of numerical simulation.
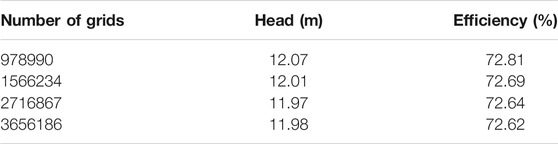
TABLE 2. Performance comparison of different mesh numbers under optimal flow conditions.
Computational Set-Up and Boundary Conditions
In the unsteady calculation process, the 3° rotation of impeller is set as a time step size, and 120-time steps are required for one revolution of impeller. The speed of the impeller is set as n = 1,500 rpm, and the time step is set as t = 3.33×10⁻⁴ s. The number of time steps is set as 1,200 steps, that is, the impeller rotates for 10 cycles in total, and the max iterations per time step is set as 20 steps. In the clean water simulation, the fluid medium is incompressible water at 25°C. The total pressure inflow (1atm), mass flow outflow, and standard k-ε turbulence model are employed for simulation. The impeller is set as the rotating domain and the inlet and outlet sections as the static domain. The convergence accuracy is set to 1.0×10⁻⁵.
Figure 3 is the external characteristic curve of simulation and test of slurry pump. The measurement error of the turbine flowmeter and speed sensor are less than 0.1%, and the measurement error of the torque sensor is less than 0.5%, the measurement error of the inlet and outlet pressure sensor is less than 0.1%, while the measurement of test bench is less than 0.37%. It can be seen from the figure that the numerical simulation results are larger than the experimental data. The main reason is that the leakage loss, disc friction loss, and friction loss between the bearing and sealing device are not considered in the numerical calculation. The maximum error of the head is at Q = 38 m3/h, the error is 3.35%. The maximum error of efficiency is at Q = 17 m3/h, the error is 1.41%. Therefore, the head and efficiency of numerical simulation can satisfy the accuracy of the investigation.
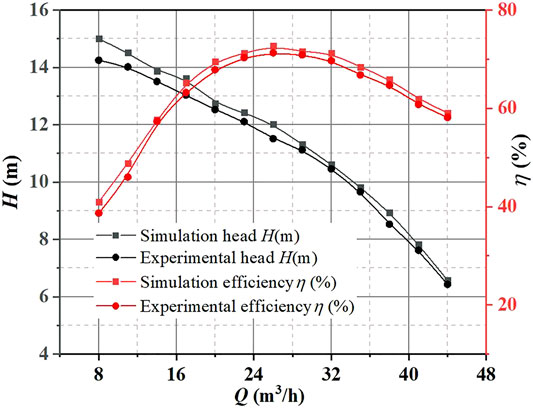
FIGURE 3. Comparison of external characteristics of pumps.
In this paper, an impeller with splitter blades is selected as scheme 1, and an impeller without splitter blades is set as scheme 2 to analyze the influence of impeller structures on the internal flow and wear characteristic of the slurry pump.
Results and Discussions
Pressure Distribution Analysis
According to the unsteady calculation results, the impeller pressure distribution under different flow conditions is shown in Figure 4 and Figure 5. The pressure distribution of the two schemes is similar, pressure gradually increases from the leading edge of the blade to the trailing edge, and the pressure contour is perpendicular to the shroud and hub. Meanwhile, the pressure distribution on the pressure surface and suction surface of the blade is not symmetrically. This phenomenon is attributed to the impeller is symmetrical geometry, while the volute is an asymmetric structure. When the impeller rotates in the volute, under the effect of rotor-stator interaction, which results in the uneven pressure distribution on the blade surface. Due to the continuous increase of the fluid linear velocity along the flow path of impeller, which makes the functional power of the blades gradually increases, thereby realizing the conversion of energy to kinetic energy and potential energy. Therefore, the pressure on the pressure side of the blade is higher than suction side at the same radius of the blade. By comparing the pressure distribution with different flow conditions, the pressure distribution at the outlet of impeller under part-load conditions is not uniform, which is caused by the instability of the impeller internal flow. It can be observed that the minimum pressure appears at the leading edge near the suction surface, where the pump is most prone to cavitation. As the flow rate increases, the impeller pressure gradually decreases, and the pressure distribution gradient becomes more uniform. As shown in Figures 4, 5, the pressure distributions of two schemes are similar, so the difference of head is very small.
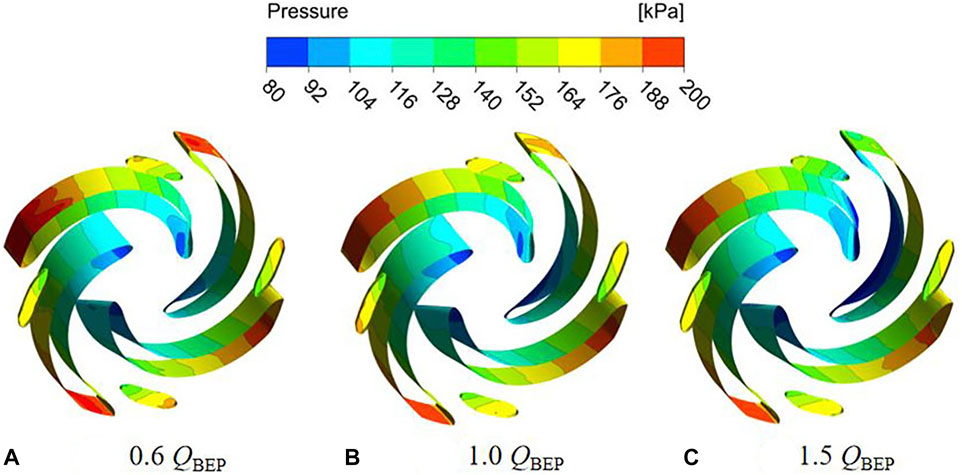
FIGURE 4. Pressure distribution under different flow conditions of scheme 1. (A) 0.6 QBEP. (B) 1.0 QBEP. (C) 1.5 QBEP.
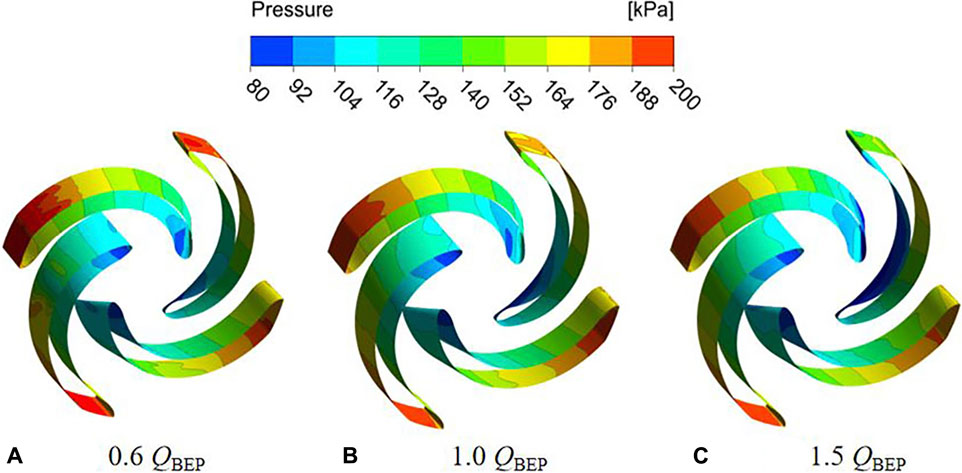
FIGURE 5. Pressure distribution under different flow conditions of scheme 2. (A) 0.6 QBEP. (B) 1.0 QBEP. (C) 1.5 QBEP.
Analysis of Vortex Structure Characteristic
Due to the complex flow in the slurry pump, several different types of vortices are generated in the internal flow, which will destroy the stability of the operation. Hence, in this section, the Q criterion is employed to study the vortex structure and its evolution law. At the same time, the corresponding pressure distribution is loaded on the vortex structure.
The three-dimensional vortex structure distribution inside the impeller of two schemes under the conditions of 0.6QBEP, 1.0QBEP, and 1.5QBEP are depicted in Figures 6, 7. According to the shape and structure of the vortex in the figure, it can be divided into leading edge vortex, trailing edge vortex, and gap leakage vortex. Since the inlet flow is affected by the rotation of the impeller, a small number of leading edge vortices can be observed at the impeller inlet. By comparing the leading edge vortices under different flow conditions, it can be found that as the flow rate increases, the strength of the leading edge vortices gradually increases. At the same time, the gap leakage vortices are mainly generated in the gap between the blade and volute. The overall structure of the gap leakage vortices looks like a rope, which is caused by the pressure difference between the pressure surface and suction surface of blade. Due to the pressure difference, the fluid flows from the gap between pressure surface and volute to suction surface and interacts with the main flow in the impeller channel. The rotation direction of gap leakage vortices is the same as that of the impeller. As the flow rate increases, the pressure difference between the pressure surface and suction surface will be gradually decreased, and gap leakage vortices will also gradually decrease. Furthermore, with the increase of flow rate, the trailing edge vortex will be gradually decreased. By comparing the vortex structure characteristic of two schemes under optimal flow conditions, due to the existence of splitter blades, vortices will be generated when the fluid flows through the splitter blades in the scheme 1. Therefore, the size and strength of the trailing edge vortex and gap leakage vortices are larger than those in scheme 2.
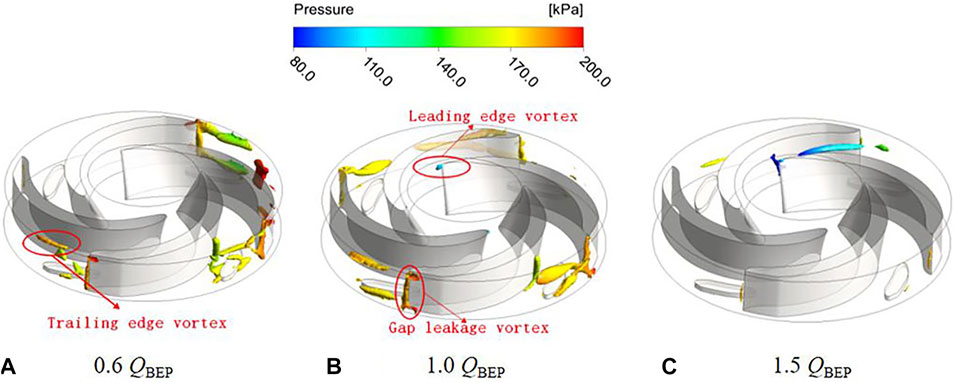
FIGURE 6. Vortex structure distribution under different flow conditions of scheme 1. (A) 0.6 QBEP. (B) 1.0 QBEP. (C) 1.5QBEP.
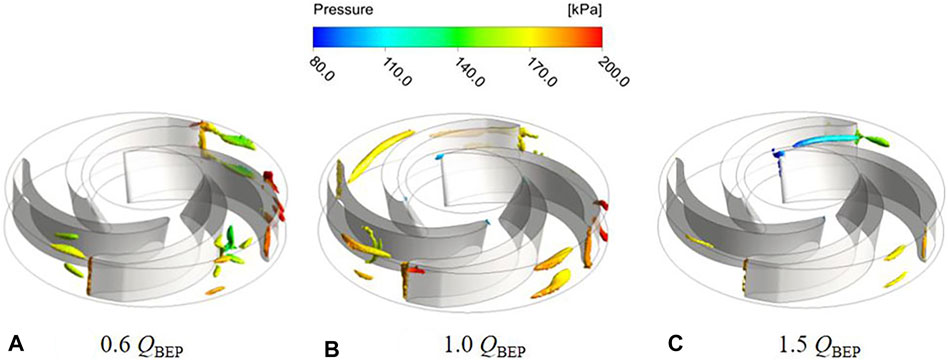
FIGURE 7. Vortex structure distribution under different flow conditions of scheme 2. (A) 0.6 QBEP. (B) 1.0 QBEP. (C) 1.5QBEP.
Entropy Generation Analysis
The unstable phenomenon such as back-flow, secondary flow, rotor-stator interaction is generated during the slurry pump operation, which has a great influence on the performance of slurry pump. In this section, the concept of entropy generation is introduced to calculate the energy loss caused by unstable phenomenon. The analysis method of entropy generation combines the theory of heat conduction and fluid mechanics, which is proposed from the second law of thermodynamics. It can effectively elaborate the consumption of the energy inside the system and the magnitude of the corresponding amplitude. In the numerical calculations of this paper, incompressible water at 25°C is selected as the medium, so the entropy generation transport equation in the system can be expressed as (Chang et al., 2019):
Where, ρ represents the density of 25°C clear water; s represents the entropy production rate, namely, the increment of entropy production in the system per unit time; x, y, and z represent the three directions in the three-dimensional coordinate system, respectively. And u, v, and w, respectively represent the corresponding velocity components of the internal velocity field of the system in the three coordinate directions of x, y, and z; T represents the system temperature (K); Φ represents the energy dissipation variable;
Since the instantaneous motion is superimposed by the time-averaged and pulsating motion. Therefore, the system entropy production caused by energy dissipation is processed by the Reynolds time average. It can be expressed as:
Where,
Where,
However, in the actual calculation process, the pulsation velocity is difficult to obtain by direct measurement. Hence, Herwig et al. (2008) proposed a new calculation method to directly solve the turbulent energy dissipation entropy generation by using the turbulent energy dissipation rate, the calculation formula between the entropy production of turbulent kinetic energy and the rate of turbulent energy dissipation can be expressed as:
Where, ε represents the turbulent energy dissipation rate, T represents the system temperature (K).
At the same time, considering the system entropy production generated by heat transfer between temperatures, Duan et al. (2014) found that the entropy production caused by heat transfer between time-average temperature differences is consistent with the entropy production caused by heat transfer between fluctuating temperature differences. Therefore, the entropy production of heat transfer between temperature differences can be obtained. The calculation formula can be expressed as:
Where λ represents the thermal conductivity, λeff represents the effective thermal conductivity, which can be calculated by the following formula:
Where λt represents the turbulent thermal conductivity, which can be calculated by the following formula:
Where cp represents the specific heat capacity at constant pressure, μt represents the turbulent viscosity, and Prt represents the turbulent Prandtl number.
At the same time, the viscous entropy production and the turbulent kinetic energy entropy production in the calculation domain are respectively integrated and calculated. Therefore, the total viscosity entropy production and total turbulent kinetic energy entropy production can be obtained as follows:
The total entropy production of the system can be obtained by integrating the viscous entropy production and turbulent kinetic energy entropy production in the computational domain grid volume by Eqs 9, 10. Because the slurry pump is simulated under normal temperature and pressure, the simulated water temperature is 298K, considering that the temperature change in the simulation process is minimal, so the entropy production caused by the temperature difference can be ignored. In the simulation process, only viscous entropy production and turbulent kinetic energy entropy production are analyzed.
Figure 8 shows the total entropy production of the two pumps and the corresponding entropy production in different areas under different flow conditions. Where Spro.s represents the total entropy production, Spro.imp represents the entropy production in the impeller, and Spro.vol represents the entropy production in the volute, Spro.inlet represents the entropy production in the inlet section. It can be seen from figure that the total entropy production of two schemes shows the same variation trend. The total entropy production of different regions presents first decrease and then increase with the increase of flow rate. Finally, reaching the minimum value under optimal flow conditions. Among them, the entropy production of the volute, the impeller, and the inlet section decreases sequentially. The total entropy production of scheme 1 under optimal flow conditions is 0.42W/K, and the total entropy production of scheme 2 under the optimal flow conditions is 0.46W/K. Namely, the energy loss caused by entropy production in the slurry pump can be declined by employing the splitter blades.
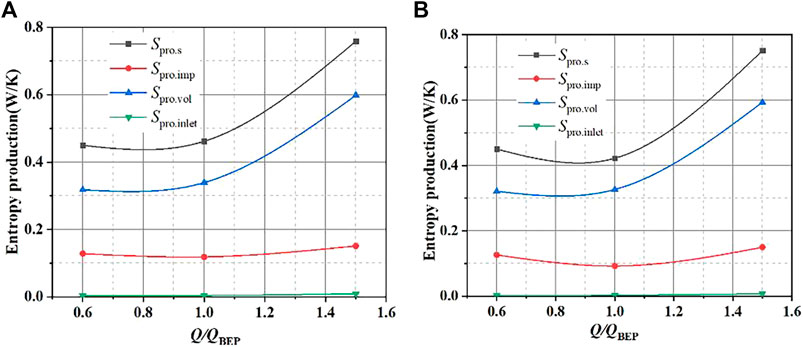
FIGURE 8. Entropy production analysis. (A) Scheme 1. (B) Scheme 2.
The total entropy production analysis of the expanded cross-section on impeller span = 0.5 is shown in Figures 9, 10. It can be seen from the figure that the internal losses of the impeller are mainly concentrated at the trailing edge and leading edge of the blade. When the fluid enters the impeller, obvious impaction is generated at the leading edge of blade. As the flow rate increases, the fluid velocity increases which intensifies the fluid shock, resulting in a greater impact loss at the leading edge of blade. At the same time, the energy loss at the trailing edge of blade is caused by the rotor-stator interaction between impeller and volute. Due to the splitter blades restrain the flow separation at impeller outlet, therefore, the entropy production of scheme 1 is less than scheme 2. From the previous analysis of the vortex structure, an obvious vortex structure is generated at the leading edge and trailing edge of blade, and the vortex structure will form energy loss and further generate entropy production. The entropy production near the suction surface of the blade is greater than the entropy production near the pressure surface of the blade, and the total entropy production is larger at the trailing edge of blade.
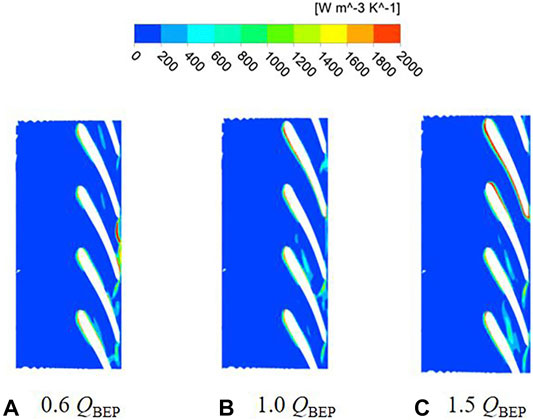
FIGURE 9. scheme 1 entropy production distribution. (A) 0.6 QBEP. (B) 1.0 QBEP. (C) 1.5 QBEP.
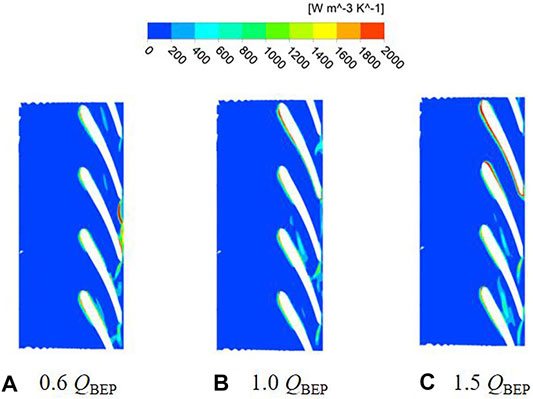
FIGURE 10. scheme 2 entropy production distribution. (A) 0.6 QBEP. (B) 1.0 QBEP. (C) 1.5 QBEP.
However, under part-load flow conditions, the total entropy production distribution of each flow channel in the impeller is different. This phenomenon is attributed to the flow of each channel in impeller is significantly different under part-load flow conditions. As the flow rate increases, the entropy production is concentrated on the suction surface of blade, which results from the positive attack angle of blade was employed. With increasing flow rate, the angle of attack at the leading edge of the blade enhances, thereby causing a greater energy loss in the area of the suction surface of the blade.
Wear Analysis of Different Impeller Structures
The abrasion of the slurry pump is an important factor, which affects its efficient operation when conveying solid-liquid two-phase slurry, and it directly determines the service life of slurry pump. Therefore, research on the wear of slurry pumps is an important part of optimizing the slurry pump impeller. In this section, solid-liquid two-phase flow analysis of slurry pumps with different impeller structures is carried out.
The external characteristic curve of the slurry pump with different concentrations is shown in Figure 11, the brown aluminium oxide is employed as the solid particles, and the diameter of the solid particles is 0.6 mm, the density of brown aluminium oxide is 2900 kg/m3. It can be seen from figure that as the concentration increases, the head and efficiency of the pump present a declining trend. The descent rate of the head gradually improves with the increase of concentration. Whereas the descent rate of head gradually declines with the increase of the concentration. It found that the external characteristics of impeller with splitter blades are slightly higher than scheme 1. When the solid phase volume concentration improves to CV = 25%, the head of scheme 1 drops by 8.77%, and the efficiency drops by 10.01%, and the head of scheme 2 drops by 8.97% and the efficiency drops by 10.11%. Therefore, to analyze and compare the wear characteristic of the slurry pump impeller, the solid phase two-phase flow simulation of the slurry pump impeller under CV = 15% and particle diameter with 0.6 mm are selected for further research.
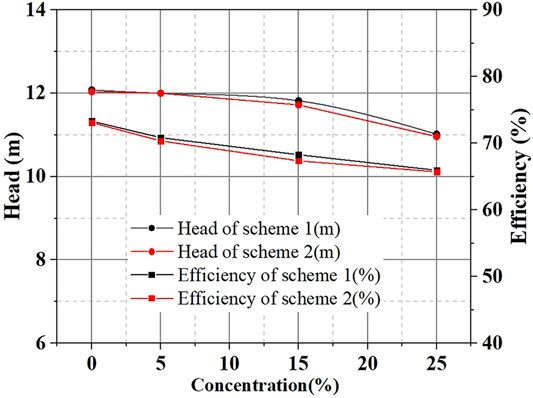
FIGURE 11. External characteristics with different concentrations.
Figure 12 present the solid phase volume fractions distribution of two schemes under optimal flow conditions. It can be seen from figure that the solid phase volume fraction distribution on the blade surface is not uniform, and the solid phase volume fraction is relatively high at the leading edge of the blade, the junction between the blade pressure surface and hub, and the junction between the suction surface of the blade and shroud. This phenomenon is attributed to the solid particles enter the impeller, under the effect of inertial force and centrifugal force, obvious impaction is generated at the junction between the blade pressure surface and hub. The volume fraction of the solid phase between suction surface of the blade and shroud is smaller than the junction of the pressure surface and hub. Due to the inertial force of the particles, more solid particles move to the hub.
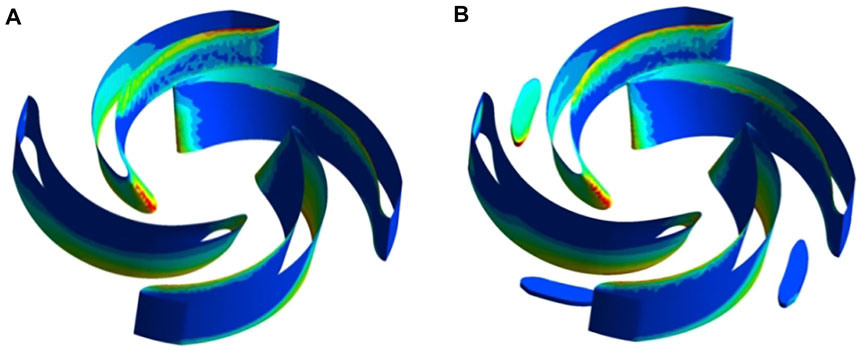
FIGURE 12. Solid volume fraction distribution on the blade. (A) Scheme 1. (B) Scheme 2.
Furthermore, the solid phase volume fraction and solid-phase slip velocity on the blade middle section are analyzed to compare the wear characteristic with different impeller structures. As shown in Figures 13, 14, the solid-phase slip velocity on the blade pressure surface first declines and then increases, which reaches the maximum at the trailing edge. It results from that the dual effect of centrifugal force and inertial force, which lead to the velocity of solid particles first decreases and then increases. At the same time, with the increase of the flow rate, the solid-phase slip velocity on the suction surface is gradually higher than the pressure surface, and the wear of the suction surface is aggravated. What is more, due to the effect of splitter blades, the slight fluctuations in the solid-phase slip velocity are generated at the trailing edge of the pressure surface, while the splitter blades have almost no effect on the sliding velocity of solid particles on the suction surface.
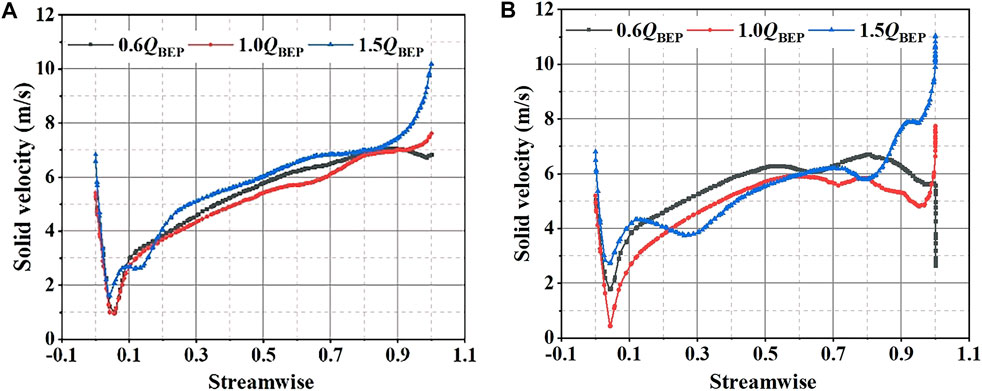
FIGURE 13. The solid velocity of blade pressure surface. (A) Scheme 1. (B) Scheme 2.
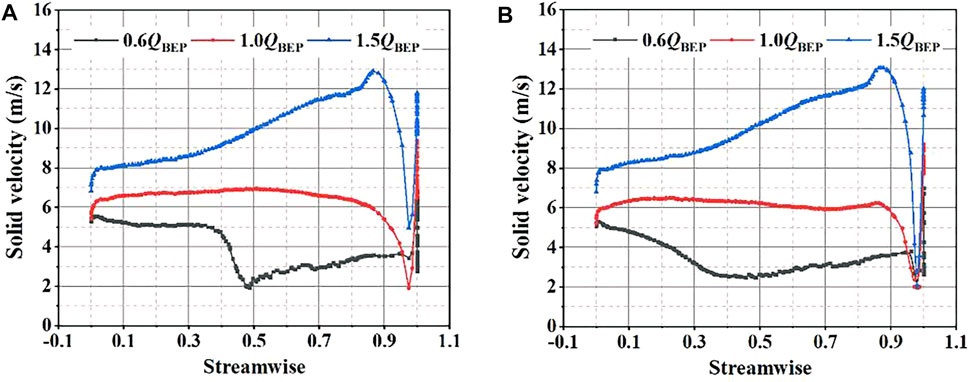
FIGURE 14. The solid velocity of blade suction surface. (A) Scheme 1. (B) Scheme 2.
The solid volume fraction distribution on the middle section of the blade is shown in Figures 15, 16. It can be seen from the figure that the volume fraction of the solid phase at the leading edge of blade is relatively large. This mainly results from that the particle impact at the impeller inlet, and under the interaction effect of centrifugal force and inertial force, which will cause the particles accumulation on the leading edge of blade. It can be found that the solid particles are more likely to accumulate due to the lower speed of the solid particles driven by the liquid under 0.6QBEP. As the flow rate increases, the volume fraction of the solid phase on the blade continuously declines, and the volume fraction of the solid phase on the pressure surface of the blade is greater than the suction surface. What is more, in scheme 1, when the streamwise of the blades is between 0.9 and 1.0, the blockage is generated by the splitter blades of particle impaction, resulting in the accumulation of solid particles, which makes the solid phase volume fraction of scheme 1 larger than in the scheme 2. Therefore, the wear characteristic of scheme 1 with splitter blades is better than scheme 2.
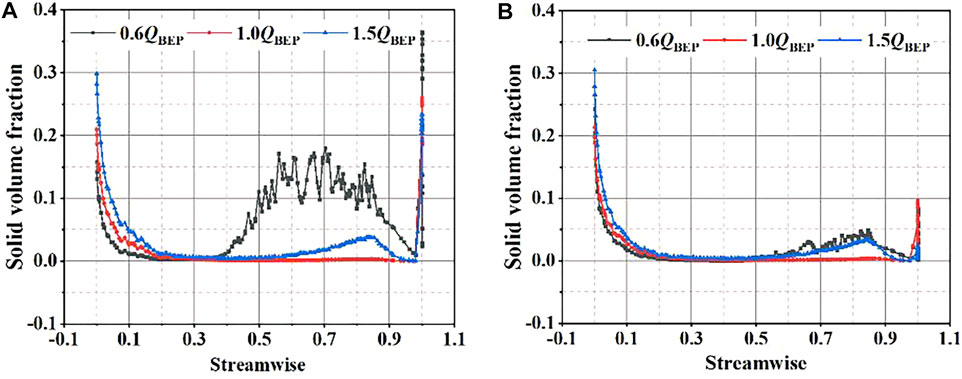
FIGURE 15. The solid volume fraction of blade pressure surface. (A) scheme 1. (B) scheme 2.
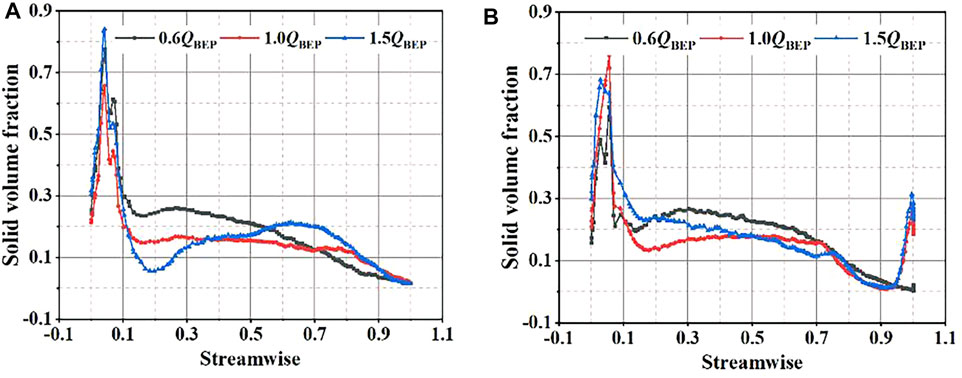
FIGURE 16. The solid volume fraction of blade suction surface. (A) scheme 1. (B) scheme 2.
Conclusion
In this paper, the internal flow field of slurry pumps with different impeller structures was analyzed. The pressure distribution, vortex structure, entropy generation are investigated by employing the Q criterion and entropy generation theory, and the wear characteristics of the impeller under two-phase flow conditions are studied. The following conclusions can be obtained:
1) A new impeller with splitter blades arranged at the exit of impeller flow channel was proposed. The pressure distribution of different impeller structures under diverse flow conditions was analyzed. Due to the continuous increase of the fluid linear velocity along the flow path of impeller, which makes the functional power of the blades gradually increases. Therefore, the pressure on the pressure side of blade is higher than suction side at the same radius of the blade. As the flow rate increases, the impeller pressure gradually decreases, and the pressure distribution gradient becomes more uniform.
2) According to the shape and structure of the vortex in the slurry pump, it can be divided into leading edge vortex, trailing edge vortex, and gap leakage vortex by employing the Q criterion. The generation mechanism of each vortex was analyzed. Meanwhile, as the flow rate increases, the strength of the leading edge vortices gradually increases, but the trailing edge vortex and gap leakage vortex continuously decline. By comparing the vortex structure characteristic of two schemes under optimal flow conditions, due to the existence of splitter blades, the blockage will be generated when the fluid flows through the splitter blades in scheme 1. Therefore, the size and strength of the trailing edge vortex and gap leakage vortices are larger than those in scheme 2.
3) Entropy production theory was introduced to investigate the energy loss of the slurry pump. The main energy loss is generated by viscous entropy production and turbulent kinetic energy entropy production. The total entropy production of different regions presents first decrease and then increase with the increase of flow rate. Finally, reach the minimum value under optimal flow conditions. And the total entropy production of scheme 1 under optimal flow conditions is 0.42W/K, and the total entropy production of scheme 2 under the optimal flow conditions is 0.46W/K. Namely, the energy loss caused by entropy production in the slurry pump can be declined by employing the splitter blades, which can restrain the flow separation at the impeller outlet.
4) The wear characteristics of the slurry pump were studied, with the increase of the flow rate, the solid-phase slip velocity on the suction surface is gradually higher than the pressure surface, and the wear of the suction surface is aggravated. What is more, due to the effect of splitter blades, the slight fluctuations in the solid-phase slip velocity are generated at the trailing edge of the pressure surface, while the splitter blades have almost no effect on the sliding velocity of solid particles upon the suction surface. When the streamwise of the blades is between 0.9 and 1.0, the blockage is generated by the splitter blades of particle impaction, resulting in the accumulation of solid particles, which makes the solid phase volume fraction of scheme 1 larger than in scheme 2. Therefore, the wear characteristic of scheme 1 with splitter blades is better than scheme 2.
Data Availability Statement
The raw data supporting the conclusion of this article will be made available by the authors, without undue reservation.
Author Contributions
This is a joint work and the authors were in charge of their expertise and capability: GP for investigation, analysis, writing and revision; JD and HC for methodology and revision; QC for validation and revision; JL and CP for data analysis; YY for manuscript revision.
Funding
Open Research Fund Program of State key Laboratory of Hydro-science and Engineering grant number: sklhse-2020-E-01; Open Research Subject of Key Laboratory of Fluid Machinery and Engineering (Xihua University) grant number LTJX2021-003; Open Research Subject of Hubei Key Laboratory of Hydroelectric Machinery Design and Maintenance (China Three Gorges University) grant number 2020KJX07; The 69th batch of general funding from the China Postdoctoral Science Foundation grant number: 2021M691298; Priority Academic Program Development of Jiangsu Higher Education Institutions (PAPD).
Conflict of Interest
Author GP is employed by Jiangsu University.
The remaining authors declare that the research was conducted in the absence of any commercial or financial relationships that could be construed as a potential conflict of interest.
Publisher’s Note
All claims expressed in this article are solely those of the authors and do not necessarily represent those of their affiliated organizations, or those of the publisher, the editors and the reviewers. Any product that may be evaluated in this article, or claim that may be made by its manufacturer, is not guaranteed or endorsed by the publisher.
References
Abdolahnejad, E., Moghimi, M., and Derakhshan, S. (2021). Experimental and Numerical Investigation of Slip Factor Reduction in Centrifugal Slurry Pump [J]. J. Braz. Soc. Mech. Sci. Eng. 43 (4), 1–14. doi:10.1007/s40430-021-02831-x
Alawadhi, K., Alzuwayer, B., Mohammad, T. A., and Buhemdi, M. H. (2021). Design and Optimization of a Centrifugal Pump for Slurry Transport Using the Response Surface Method. Machines 9 (3), 60. doi:10.3390/machines9030060
Chang, H., Shi, W., Li, W., and Liu, J. (2019). Energy Loss Analysis of Novel Self-Priming Pump Based on the Entropy Production Theory. J. Therm. Sci. 28 (2), 306–318. doi:10.1007/s11630-018-1057-5
Duan, L., Wu, X., and Ji, Z. (2014). Application of Entropy Generation Method for Analyzing Energy Loss of Cyclone Separator[J]. J. Chem. Industry Eng. 65, 583–592.
Duarte, C. A. R., de Souza, F. J., and dos Santos, V. F. (2015). Numerical Investigation of Mass Loading Effects on Elbow Erosion. Powder Tech. 283, 593–606. doi:10.1016/j.powtec.2015.06.021
F. Khalil, M., Z. Kassab, S., A. Abdel Naby, A., and Azouz, A. (2013). Performance Characteristics of Centrifugal Pump Conveying Soft Slurry. Ajme 1 (5), 103–112. doi:10.12691/ajme-1-5-1
Herwig, H., Gloss, D., and Wenterodt, T. (2008). A New Approach to Understanding and Modelling the Influence of wall Roughness on Friction Factors for Pipe and Channel Flows. J. Fluid Mech. 613, 35–53. doi:10.1017/s0022112008003534
Kumar, S., Gandhi, B. K., and Mohapatra, S. K. (2014). Performance Characteristics of Centrifugal Slurry Pump with Multi-Sized Particulate Bottom and Fly Ash Mixtures. Particulate Sci. Tech. 32 (5), 466–476. doi:10.1080/02726351.2014.894163
Peng, G., Huang, X., Zhou, L., Zhou, G., and Zhou, H. (2020). Solid-liquid Two-phase Flow and Wear Analysis in a Large-Scale Centrifugal Slurry Pump. Eng. Fail. Anal. 114, 104602. doi:10.1016/j.engfailanal.2020.104602
Salim, B., Bajawi, H. Y., and Suhaibani, Z. (2015). Performance of a Centrifugal Slurry Pump with Clinker Slurry [J]. Indian J. Sci. Tech. 8 (12), 1. doi:10.17485/ijst/2015/v8i12/56300
Sellgren, A., and Addie, G. (2010). Effects of Highly Concentrated Slurries on the Performance of Centrifugal Pumps. [J] 78 (4), 764–769.
Tarodiya, R., and Gandhi, B. (2021). Numerical Investigation of Erosive Wear of a Centrifugal Slurry Pump Due to Solid-Liquid Flow [J]. J. Tribology 143, 1–24. doi:10.1115/1.4049596
Tarodiya, R., and Gandhi, B. K. (2019). Numerical Simulation of a Centrifugal Slurry Pump Handling Solid-Liquid Mixture: Effect of Solids on Flow Field and Performance. Adv. Powder Tech. 30 (10), 2225–2239. doi:10.1016/j.apt.2019.07.003
Wang, P. W., Zhao, J., Zou, W. J., and Hu, S. G. (2012). Experimental Study and Numerical Simulation of the Solid-phase Particles' Influence on outside Characteristics of Slurry Pump. IOP Conf. Ser. Earth Environ. Sci. 15 (6), 062057. IOP Publishing. doi:10.1088/1755-1315/15/6/062057
Wang, R., Guan, Y., Jin, X., Tang, Z., Zhu, Z., and Su, X. (2021). Impact of Particle Sizes on Flow Characteristics of Slurry Pump for Deep-Sea Mining. Shock and Vibration 2021, 1–13. doi:10.1155/2021/6684944
Wang, Y., Chen, B., Zhou, Y., Ma, J., Zhang, X., Zhu, Z., et al. (2021). Numerical Simulation of Fine Particle Solid-Liquid Two-phase Flow in a Centrifugal Pump. Shock and Vibration 2021 (20), 1–10. doi:10.1155/2021/6631981
Keywords: slurry pump, energy loss, entropy production, wear characteristic, energy-saving technology
Citation: Peng G, Du J, Chang H, Chen Q, Li J, Pan C and Yang Y (2021) Numerical and Experimental Analysis of Influence of Impeller Structures on Slurry Pump Performance. Front. Energy Res. 9:762159. doi: 10.3389/fenrg.2021.762159
Received: 21 August 2021; Accepted: 27 September 2021;
Published: 22 November 2021.
Edited by:
Lin Teng, Fuzhou University, ChinaCopyright © 2021 Peng, Du, Chang, Chen, Li, Pan and Yang. This is an open-access article distributed under the terms of the Creative Commons Attribution License (CC BY). The use, distribution or reproduction in other forums is permitted, provided the original author(s) and the copyright owner(s) are credited and that the original publication in this journal is cited, in accordance with accepted academic practice. No use, distribution or reproduction is permitted which does not comply with these terms.
*Correspondence: Guangjie Peng, cGdqQHVqcy5lZHUuY24=; Hao Chang, Y2hhbmdoYW9AdWpzLmVkdS5jbg==