
94% of researchers rate our articles as excellent or good
Learn more about the work of our research integrity team to safeguard the quality of each article we publish.
Find out more
ORIGINAL RESEARCH article
Front. Energy Res., 01 October 2021
Sec. Wind Energy
Volume 9 - 2021 | https://doi.org/10.3389/fenrg.2021.756733
This article is part of the Research TopicAdvanced Anomaly Detection Technologies and Applications in Energy SystemsView all 64 articles
 Peiwen Yu1
 Anping Lin2*
Wind power ramp events are typical harmful anomaly events in wind engineering, which bring new threat to the safety operation of power systems. To in-depth understand ramps and mitigate their harms, suitable ramp characteristics are crucial in many studies, e.g., ramp definition, classification, prediction and so on. However, due to ramps’ specificity on event feature, more profound characteristics are needed besides basic ramp morphological characteristics. In this paper, an approach for extracting and selecting ramp characteristics is proposed for ramp study. First, according to ramps’ causation on energy change, wavelet transformation is introduced to analyze ramp categories, and used to extract ramp energy characteristics. Then, heuristic feature selection methods are proposed to select ramp characteristics based on specific ramp application contexts. The objective of feature selection is to remove redundant characteristics, and to improve ramp studies’ performance. Finally, combining basic ramp characteristics and wavelet characteristics, ramp studies on category classification and prediction of appointed characteristics are implemented on industrial data. The computational results validate the usefulness of wavelet characteristics, the feasibility of the proposed approach, and that performance of ramp study could be improved by using ramp characteristics in this paper.
The generation of energy from wind is growing across the world, especially in China where large-scale and highly-concentrated wind projects prevail (Ouyang et al., 2017a). Due to the renewability feature, wind energy offered lots of opportunities, e.g., proving clean energy and reducing environment pollution. On the other hand, due to wind’s fluctuation and intermittent, serious anomaly challenges threaten the safety and stability of power grid. For example, wind power ramp events are typical anomaly events bringing one of the greatest threat, which is namely the large and unexpected changes of wind power over a short time period (Wang et al., 2017). In 2008, a down-ramp event was reported in the State of Texas causing serious economic loss to the grid operated by Electric Reliability Council of Texas (ERCOT) (Francis, 2008). Therefore, it is significantly important to study ramp events for mitigating their negative impacts.
Ramp study mainly involves definitions, detection, prediction and classification. Generally, ramp definition and ramp detection are the basis of ramp study. While ramp events are usually detected by combining ramp definitions and specific detection methods. For example, dynamic programming recursion and the swinging door algorithm were proposed to detect ramp events from wind power data in (Florita et al., 2013; Sevlian and Rajagopal, 2013; Ouyang et al., 2017b). In (Xiong et al., 2017), a data mining method using affinity of weather data was also proposed for ramp detection. However, the mainstream definitions up to now mainly focus on three characteristics (Zha et al., 2016) (e.g., ramp amplitude, ramp duration, and ramp rate) which are superficial characteristics from ramp events’ basic forms. Copying with complex power system operations in the future, more targeted and effective control strategies need to be made, which are essentially based on study of more profound ramp characteristics. On the other hand, ramp prediction and classification are two major objectives of ramp study. Generally, ramp prediction can be divided into event prediction and ramp’s categories prediction which is actually ramp classification. Nowadays, ramp classification has been studied via many data mining algorithms, e.g., k-means, support vector machine (SVM), extrema learning machine (ELM), neural networks (NN) and so on (Couto et al., 2013; Florita et al., 2013; Tang et al., 2020; Shen et al., 2021). Ramp classification combined with weather regimes was also studied in (Chen et al., 2018). No matter ramp prediction or classification, proper input features are the premise of constructing high-performance models. However, most of these studies are based on superficial characteristics, no profound physical characteristics are considered to improve ramp studies’ performance. Therefore, it is significant useful for studying extraction and selection of ramp characteristics in wind power ramp researches.
In modeling process, determination of input features is primarily based on original data points. Sometimes feature extraction, selection and transformation are involved according to specific criterions. For example, principal component analysis (PCA) is a commonly-used method to reduce dimension of feature space, which was also used in feature analysis for wind forecasting (He et al., 2013a). Other methods based on mathematical transforms were also useful to extract characteristics, e.g. wavelet-transform was utilized in wind power forecasting (Singh and Tewari, 2015). Moreover, Pearson correlation coefficient, Gini index, wavelet transformation and other intelligent tools were also applied to feature processing in engineering (Huang et al., 2018). Nowadays, with more industrial signals are collected from complicated systems and more un-researchable objects are analyzed, these situations lead to the urgent requirement of profound characteristics reflecting structural or physical features in modeling. Study on wind power ramp events is a representative problem among these issues. According to ramps’ concept, ramp events involve a period of wind power values and variance, and they don’t always have a unified time duration (Tang et al., 2021). Based on the traditional tools, basic characteristics (e.g., ramp amplitude, duration and ramp rate) could be obtained from wind power data. However, ramps’ harmful effect on power grid is not just identified by ramp duration and amplitude. The difference of ramp amplitude, ramp rate, energy storage and other factors may also affect the stability of power system at different degree. Therefore, besides the basic ramp characteristics, how to acquire more profound characteristics is an urgent topic in ramp study, such as in ramp classification and prediction.
According to the outlined problems above, the objective of this paper is to propose an approach to extract and select ramp characteristics for wind power ramp study. Considering ramp events involves the variance of time series and energy change process of wind power, three basic ramp characteristics are extracted based on definitions firstly. These characteristics are able to distinguish ramps and non-ramp events. Then, a method transforming time series into energy forms is proposed to extract extra characteristics. Wavelet transformation has been applied for feature expression in literatures due to its superior description ability at both time and frequency domains. For example, the wavelet transform was utilized to analyze the features of ramp events in (Gallego et al., 2013). On the other hand, wavelet decomposition has the property of multiresolution which is helpful to study the allocation of ramp event’s energy. Summarizing these two properties, wavelet transformation is proposed to extract profound characteristics for distinguishing refined ramp categories in depth. Moreover, for reducing dimension, mitigating noise’s influence, improving computation efficiency, a heuristic intelligent algorithm is proposed in the feature selection. Finally, based on the refined characteristic vector, ramp studies (classification, prediction) on industrial datasets are discussed, and validate the approach in extracting and selecting ramp characteristics. The framework of the major work in this paper is sketched in the following figure.
In Figure 1, the identification of historical ramp events is implemented through ramp definitions and detection. Class labels of ramp events are determined by a given classification environment which could be based on weather sceneries, control requirement and so on. The other characteristics are energy characteristics extracted by wavelet transformation in this paper, and fn represents the nth characteristic in the formed characteristic vector in Figure 1. According to the above description, we can conclude the novelties of this paper as following three points:
i) This paper proposes to consider characteristics of ramp events from multiple aspects, including the basic morphological characteristics from time domain and characteristics in frequency domain. Moreover, due to ramp events’ specificity, characteristics are also extracted in terms of energy. This is the first time to consider ramp events’ energy characteristics.
ii) Wavelet transformation is proposed to extract ramp characteristics. By utilizing the frequency and multiresolution properties in wavelet decomposition, ramp energy characteristics are expressed by energy at different frequency spaces. Meanwhile, these energy characteristics are selected and refined. Its purpose is to delete the energy of noise which may affect ramp classification.
iii) Heuristic intelligent algorithms are tried in the selection process, e.g., the sequential forward floating search (SFFS) and sequential backward floating search (SBFS) methods. The heuristic feature selection could refine the characteristic vector in related studies more effectively than unsupervised methods reducing dimension.
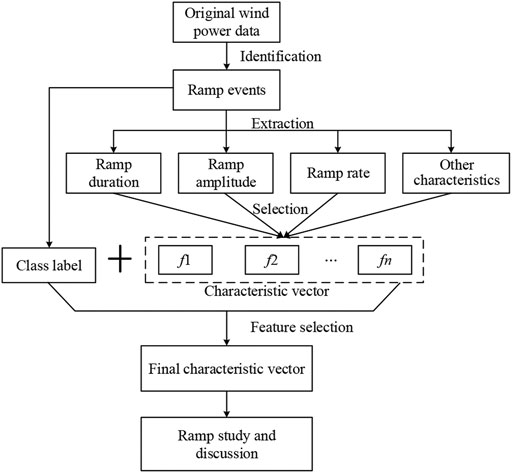
FIGURE 1. Framework of the study in this paper.
Besides the above introduction, rest of this paper is organized as follows. Feature Extraction addresses the processes of extracting ramp characteristics, including the basic ramp characteristics based on ramp definitions, and ramp energy characteristics based on wavelet transformation, for ramp studies are also extracted. Feature Selection proposes the feature selection approach which is based on dispersion matrix and heuristic method. The detailed processes are also presented in this section. Ramp Anomaly Analysis and Evaluation aims at designing ramp studies, e.g., ramp classification and ramp prediction. It also gives out some indicators for evaluating ramp study. In Experiments and Discussion, industrial wind power data is utilized in case study. Performance on ramp classification and prediction are compared with models using different feature sets and that using PCA for feature selection. Computational results validate the feasibility of wavelet characteristics and the proposed feature selection method. Finally, Conclusion concludes this paper.
Wind power ramp events bring great harm to system operation as more and more wind power integrated into power grid. Copying with these new events, a series of studies has been carried out, such as ramp definition, ramp prediction and classification. Currently, there are four mainstream definitions widely used in ramp analysis (Zha et al., 2016). These definitions are defined as follows.
Definition 1. When the change of wind power in time duration ∆t exceeds a given threshold Wpval, there is a ramp event occurring, as expressed as below.
where: Wp(t+∆t) and Wp(t) are wind power values at time t+∆t and t, respectively; Wpval represents the threshold of ramp amplitude. When the criterion in Eq. 1 meets under a given time period, a ramp event is identified.
Definition 2. When the largest difference of wind power in time duration ∆t exceeds the given threshold Wpval, then a ramp event is regarded as occurring.
where,
Definition 3. When the average change of wind power in a given time duration ∆t exceeds the given threshold Wpval, a ramp event is identified.
where, h is the time horizon in ramp identification.
Definition 4. When the ratio between the wind power change |Wp(t+∆t)-Wp(t)| and time duration ∆t exceeds a given threshold Rval, then a ramp event is regarded as occurring.
where, this definition in Eq. 4 pays more attention on ramp rate while that in Eq. 1 emphasizes only ramp amplitude. Summarizing the above four definitions, we can see they mainly focus on three major characteristics (Zha et al., 2016), such as ramp amplitude Var, ramp duration T, and ramp rate R. Based on these three characteristics, the variance of wind power in a given period could be determined as ramps or non-ramps. Therefore, they consist of the initial characteristic vector in ramp study, as Cv0 = [Var, T, R]. As we know, sometimes ramp direction is also used in characteristic analysis. However, through above numerical definitions, ramp direction is not necessary, and could be expressed by sign of R when needed. Considering that ramp analysis in some cases needs the detailed information about power range rather than only fluctuation amplitude, so we replace ramp amplitude Var with maximum and minimum values. Assuming there are N studied ramp events in dataset, the initial characteristic matrix X0 is expressed as below.
where, Wpi,min and Wpi,max represent the minimum and maximum value of wind power in the ith studied ramp event.
As the research on ramp events get more in depth, profound characteristics are needed to describe ramps’ formation and categories. For example, the initial characteristics in Eq. 4 is used to identify the basic formation of ramps and non-ramps. The detailed fluctuation inside ramps needs structural characteristics, and the essence of ramps’ occurrence involves energy characteristics. In order to extract more profound information in ramp study, wavelet transformation is applied in this paper. Wavelet transformation is an advanced mathematical technique in signal analysis (Mohanty et al., 2015). It has advantages at decomposing a signal into various time and frequency domains, so it is useful to study the structural characteristics of ramps in different domains. Wavelet transformation also has advantages at detecting abrupt changed values (e.g., in edge detection) and analyzing signal in a specific time window. While ramp events certainly have large power charge in finite time durations, so it is relatively suitable to utilize wavelet transformation in ramp analysis (Escalante Soberanis and Mérida, 2015). On the other hand, due to the multiresolution feature of wavelet decomposition, energy of a given signal could be allocated into different frequency spaces. In this way, we are inspired to extract characteristics for expressing ramps’ energy characteristics. This is also a key reason for considering wavelet transformation in extracting ramp characteristics.
The theory of discrete wavelet transformation is described as below. Assuming a discrete signal (e.g., wind power time series of a ramp event) is expressed as {x(t); t = 1,2, ⋯, T}, it could be reconstructed by elements of wavelet transformation, as expressed below.
where: x(t) is actually the signal of wind power; δj,k is the wavelet coefficient; ψj,k is the child wavelet transformed from mother wavelet, denoted as follows.
where: j and k represent the scale and shift parameters of child wavelet ψj,k; ψ(t) is the mother wavelet function; a and b are real parameters. From Eqs 6, 7 it implies that the reproduction of original signal could be realized by the weighted sum of wavelet components at different scales.
To in-depth explain the meaning of each wavelet component in Eq. 6, we could operate wavelet decompose step by step. Assuming the original signal with finite energy is projected on a space L, x(t) with one-level-decomposition could be expressed as below.
where, x1(t) is the estimation of the original signal reflecting variation in time domain;
Similarly, we could utilize a series of wavelet functions to describe signal xj(t), as
where, the auxiliary function ϕ is called father wavelet; cjn,k is the coefficients of wavelets
On the other hand, by corresponding each wavelet component to a frequency space, we could also divide the space L to series of energy subspaces. As shown in Figure 2, Vj0 represents the original signal space L with a frequency band (0∼f). According to Eq. 10, the frequency band is also divided step by step. For example, Vj0 could be divided as orthogonal sum of a low-frequency space Vj1 (0∼f/2) and a high-frequency space Wj1 (f/2∼f). The relationship reflecting the division of frequency spaces in wavelet transformation is presented as below.
where:

FIGURE 2. The orthogonal decomposition of the space L.
Considering signal’s energy is generally expressed at frequency subspaces, therefore we could utilize the multi-resolution of wavelet decomposition to analyze the energy distribution of a signal (Ashrafian et al., 2017), as described in the following formula.
where: |P{x}|2 represent the energy of the given signal {x(t)};
Moreover, when the number of decomposition levels is high (e.g., jn→∞), the value of cjn,k is small, which implies the energy of Vjn becoming small to be ignored. In that case, the energy characteristics of Wj are mainly selected into the characteristic vector for ramp study in this paper.
where: Pj represents the jth energy characteristic and j is the decomposition level. Cv is the characteristic vector combining initial vector Cv0 and Pj. By utilizing this vector including basic ramp characteristics and wavelet energy characteristics as inputs, some advanced ramp study could be implemented besides the identification of ramps and non-ramps.
According to the above wavelet decomposition, jn energy characteristics are extracted. Generally, the more the number of decomposition levels, the better the description ability of wavelet characteristics. In Eq. 13, the energy in frequency space Vjn is excluded since Vjn is the lowest frequency and its cjn,k is very small. However, when more fine-sorted energy characteristics Pj are generated, it is unavoidable to lead to many superfluous characteristics in a specific study case. Therefore, excluding basic ramp characteristics, feature selection is also necessary in ramp study.
Feature selection could not only select optimal energy characteristics for specific study, but also improve computing performance by reducing data dimension. Generally, feature selection methods are based on specific indicators or criterions to rank all characteristics, then realize selection through ranking scores. Most of these methods do not care about the application context in ranking. The other commonly used methods on dimension reducing is through feature transformation, such as PCA, LDA. This type of methods weakens the physical meaning of selected characteristics, and also ignore actual context. Therefore, in this paper we propose to utilize heuristic selection criterion which combining selection indicators and the application context (e.g., specific ramp study).
First, we propose to utilize dispersion matrix (Gu et al., 2017) to create selection indicator. Dispersion matrix is a mathematic tool based on feature distances of different classes, its elements are denoted as below.
where: W and B are the dispersion matrix representing intra-class and inter-classes, respectively; xg,k is characteristic vector of the kth ramp in the gth class; μg and μo represent the average vector of the gth class and all classes, respectively; ng and N are the number of ramps the gth class and all classes, respectively; G is the number of classes. A Wilks criterion function λp could be selected as the reference indicator in feature selection, it is defined as below.
where: T is total dispersion matrix, calculated as T = B + W; p is the dimension of feature space. When the value of λp is small, implying a small value of |W| and a large value of |T|, it illustrates that the characteristic is effective to distinguish different classes of samples. Generally, the statistical indicator λp is assumed to obey the Wilks distribution. By deciding a testing level α and its corresponding threshold λ(α), the hypothesis testing of λp could be implemented. For the convenience of calculation, the value of Wilks distribution function could be estimated by the following two common distribution functions.
1) Bartlett approximation.
2) Rao approximation.
Through the above two approximation methods, the hypothesis testing of Wilks distribution could be realized by formulas in Eqs 16, 17.
Combining the selected Wilks indicator λp and ramps’ categories information, a supervised heuristic method could realize high-performance feature selection. In this paper, we propose to utilize SFFS (sequential floating forward search) and SFBS (sequential floating backward search) algorithms (Gan et al., 2014) which retain the strengths and improve the weakness of SFS (sequential forward selection) and SBS (sequential backward selection).
Considering the specificity of ramp studies, the basic characteristic vector Cv0 contains basic ramp characteristics identifying ramps and non-ramps, so it is necessary included in the characteristic subset. Actually, the task of feature selection is to select optimal newly-extracted characteristics in ramp study.
Therefore, in this paper the initial subset is X0, the characteristics that need to be processed are wavelet energy characteristics Pi (i = 1,2, ⋯, jn). Assuming after the mth selection step, the feature subset is denoted as Xm. If we consider to add a new characteristic xr at the (m+1)th step by SFFS algorithm, the updated dispersion matrix could be calculated as below.
where, W11 and T11 are the intra-class and the total dispersion matrix of Xm, respectively; The rest of sub-matrix are newly introduced matrix related with xr, calculated as the following formulas.
Based on calculation of these sub-matrixes, the updated indicator λm+1 could be calculated as below.
By substituting Eqs 15–18, the expression
where: pm is the number of characteristics in set Xm. If F1r>Fα(g-1, N-pm-g) at given testing level α, then the hypothesis is correct and xr is added into characteristic vector.
Similarly, if we utilize the SFBS algorithm to delete a characteristic xr form the set Xm, the final testing value is defined as F2r, expressed as below
If the formula F2r ≤ Fα(g-1, N-(pm-1)-g) is satisfied at a given level α, then the variable xr is regarded as invalid and removed from Xm.
By taking the selected ramp characteristics as inputs and different types of data as output, we could construct models for different ramp study, e.g., ramp classification and ramp prediction. In this paper, we only do some simple experiments on these two studies for evaluating the selected ramp characteristics.
In ramp classification study, class labels of historical ramp events are taken as the output. The classification model can be constructed by data mining algorithms. To accurately classify ramp events, four data mining algorithms are applied to train ramp classification model, including support vector machine (SVM), neural networks (NN), random forests algorithm (RF) and boosted trees (BT) (Chen et al., 2017; Ouyang et al., 2017c; He et al., 2017; Ouyang, 2021). The optimal classification model could be determined by the comparison of their performance.
To evaluate the classification performance, the confusion matrix introduced from information retrieval (IR) field is widely applied (He et al., 2013b). The detailed expression is presented in the following table.
In Table 1, four types of events are defined, such as true positive event (TP), false negative event (FN), false positive event (FP) and true negative event (TN). Based on these events, several indicators could be defined to evaluate classification performance. Four representative indicators are defined as below.
where, numX represents the number of the specific event X; Pre represents precision indicator implying the percentage of TP in classified true events; Rec represents recall indicator implying the percentage of TP in observed true events; Acc is the classification accuracy, and Err is the classification error. By utilizing these four indicators, we could complete selection of the optimal classification model and the evaluation of classification performance.

TABLE 1. Confusion matrix.
Ramp prediction is usually divided into two types: event prediction and regression prediction. Event prediction includes ramp detection and ramp classification study. Regression prediction mainly focus on utilizing traditional regression models to predict ramp characteristics, e.g., the ramp rate prediction in (Zheng and Kusiak, 2009). In this paper, we consider predicting two characteristics: ramp amplitude and ramp rate, which implies values of these two characteristics are taken as the output in modeling. Since the above study on ramp characteristics’ extraction and selection are based on historical ramp events which randomly occur in wind power time series. Therefore, we propose to utilize these characteristics extracted from wind power in a given time window as inputs, then predict one appointed characteristic in the predicted time window, e.g., to predict ramp amplitude or ramp rate in the future 1-h horizon. Since this type of prediction is still based on regression models, the performance indicator could be decided by the commonly used root-mean-square error (RMSE), which is defined as below.
where, yk and
In this paper, the industrial wind power data from Bonneville Power Administration (BPA) website (bpa.gov/transmission, 2013) is taken as the studied case. The data set spanning from 01/01/13 00:00 to 12/31/13 23:55 totally has 105,120 data points with a sampling interval of 5 min. First, we need to detect historical ramp events from wind power time series for the following ramp characteristics study. According to the definitions in Eqs 1–4, the forth definition can reflect three basic ramp characteristics more conveniently, so that it is selected to identify historical ramps in this paper. In (Tang et al., 2021), the value of Rval was chosen as 50% of the installed capacity within 4 h, so the value of Rval is computed by considering the capacity of 4,500 MW in the studied case, as below.
Considering ramps always have a duration larger than 0.5 h, so we assume the minimum threshold as ∆t = 0.5 h there are totally 526 ramp events are detected from data of former 6 months. One part of ramp identification results is shown in Figure 3. The subpicture 1) and 2) depict historical wind power and ramp events, respectively. In Figure 3B, up-ramps and down-ramps are expressed by lines above and below the X-axis, respectively, their durations are reflected by values in Y-axis. It is seen than most of ramps have duration around hours, some even reach 6 h.
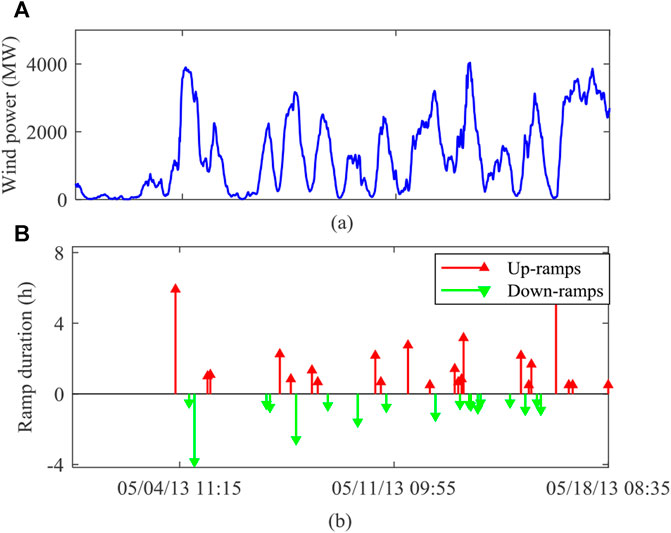
FIGURE 3. Identification of (A) historical wind power (B) ramp events in May.
Historical wind power and ramp events are depicted in Figure 3A and Figure 3B, respectively. In Figure 3B, up-ramps and down-ramps are expressed by lines above and below the X-axis, respectively, their durations are reflected by values in Y-axis.
Through analysis on ramp definitions, basic ramp characteristics (amplitude, duration, and ramp rate) could be extracted, as (5). These basic characteristics could be used to identify ramps and non-ramps, as two typical signals in Figure 4. To identify more detailed division of ramp categories, wavelet transformation is proposed to extract profound characteristics.
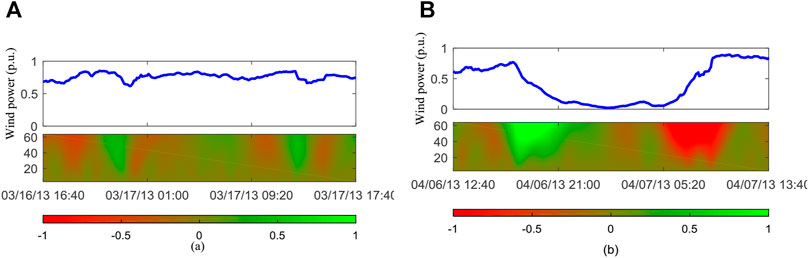
FIGURE 4. Wavelet analysis of ramps and non-ramps; (A) non-ramp signal; (B) ramp signal.
In order to illustrate the feasibility of wavelet characteristics, we firstly utilize wavelet coefficients as an index to qualitatively analyze ramps and non-ramps.
In Figure 4, the two typical ramp and non-ramp events are identified by characteristics in Eq. 5. The function applied here is Haar wavelet which was validated useful in ramp analysis (Gallego et al., 2013). It is seen from Figure 4 that wavelet coefficients which reflect signal’s energy could obviously distinguish ramps and non-ramps. For example, ramps have larger coefficients than non-ramps. It verifies the validity of wavelet transformation in ramp characteristics analysis, therefore we could further extract more profound wavelet characteristics for ramp recognition.
According to the heuristic methods in selecting characteristics, the class labels are required. Therefore, we propose to construct ramp classification according to a specific context. Considering wind process are formed by different meteorological phenomena, so the categories of ramp events are related to division wind processes to some extent. In (Wang et al., 2013), five types of wind process are discussed, namely small wind, small fluctuation wind, large fluctuation wind, double peak wind and multi-peaks wind. However, there are a few ramp events attributed to the small wind. Double peaks wind can be regarded as a special type of multi-peaks wind. Based on these assumptions, we can group historical ramp events into the following category library L, denoted as below.
Combing with the description of wind process in (Wang et al., 2013) and the constructed library L, historical ramp events of training set are classified into three classes, as presented below.
Table 2 shows the statistical results of ramp events belonging to three categories in L, where number 1, 2 and 3 are defined as the class labels of A, B, C. It is seen that most ramp events are associated with the large fluctuation wind, a few of ramp events associated with the small wind and multi-peak wind. These results agree with the concept of ramp events involving a large change of wind power. Therefore, the constructed application context is reasonable for studying ramp characteristics. Based on the constructed library of ramp categories, then the extraction and selection of ramp characteristics could be implemented.

TABLE 2. Number of ramps in three categories.
Assuming each signal is decomposed into five wavelet layers, the energy of each wavelet layer is extracted as ramp characteristics by Eq. 13, expressed as P = [P1,P2,P3,P4,P5]. Here, the number of decomposition layers is set as 5 since ramp events have only three categories in this paper. In other application context which requires more refined ramp classification, the level of decomposition could be higher. As the description in Feature Selection, the purpose of feature selection is to delete redundant characteristics, reduce dimension and computation cost. Combining ramp basic characteristics and extracted wavelet energy characteristics, the characteristic vector is expressed as Cv = [Wpmax, Wpmin, T, R, P1, P2, P3, P4, P5]. For all historical ramp events, the feature set constructed by Cv is denoted as Xp0. Then, according to the selection algorithm in Feature Selection, the process is shown in the following table.
At each step of Table 3, the value of λp is calculated for the rest characteristics Pi first. Then the minimum one is applied for Fr testing based on Eqs 15, 16. If the result is satisfied, adding the corresponding characteristic into characteristic vector Cv. It is seen from Table 3 that P3 and P4 is selected, so the final characteristic is re-written as Cvp = [Wpmax, Wpmin, T, R, P3, P4], and the final feature set for all ramp events as Xp.
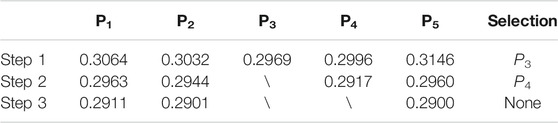
TABLE 3. Process of featue selection.
By taking the feature set Xp as inputs and the class labels from Table 2 as output, five data mining algorithms (SVM, NN, RF, BT, ELM) are applied in ramp classification modeling. The classification results of three categories of ramps are shown in following figure.
For the convenience of presentation, Figure 5 utilizes two characteristics (Wpmax×P3) to show ramp classification results, as X-axis representing values of Wpmax and Y-axis representing values of P3. Red, blue and green points represent ramps of Class1, Class2 and Class3, respectively. Black points represent ramp events classified into incorrect class. Based on these classification results, the performance indicators defined in Eq. 23 could be calculated, as presented below.
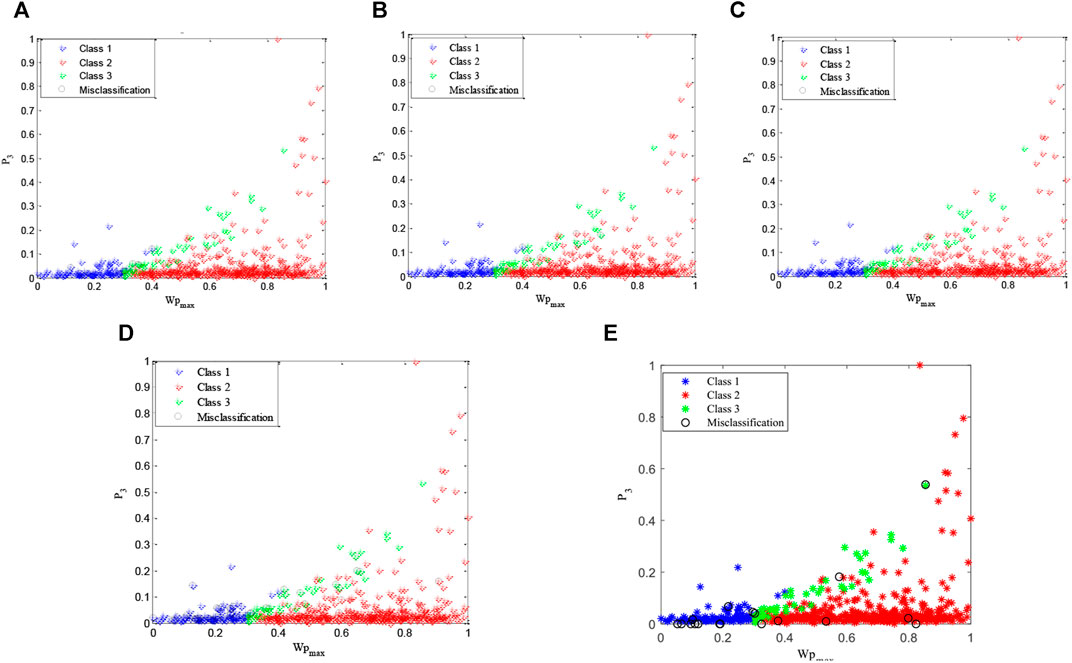
FIGURE 5. Ramp classification based on four data mining algorithms; (A) SVM; (B) NN; (C) RF; (D) BT; (E) ELM.
Table 4 presents values of four performance indicators in classification of three ramp categories. According to the definitions of four matrixes, a classification system performs well with large value of Pre, Rec, Acc, and small value of Err. In Table 4, it is seen that NN, RF and ELM algorithms outperform on three classes, respectively. However, it is difficult to choose the best to classify all three ramp categories. To determine the final optimal model in ramp classification, the receiver operating characteristic curve (ROC) is introduced to compare performance further. ROC space is constructed by Recall (Rec) in the X-axis and false alarm (F) in the Y-axis. The definition of F is also based on Table 1, as expressed below.
where, F calculates the percentage of FP in observed false events. According to these two indicators’ definitions, it is easily comprehended that a classifier having a large Rec and a small F performs better, which implies the upper-left corner of the ROC space means the better performance. For a discrete classification system, a classifier is usually represented by a point in ROC space. Therefore, points representing all classifiers in Table 4 are shown in the following figure.
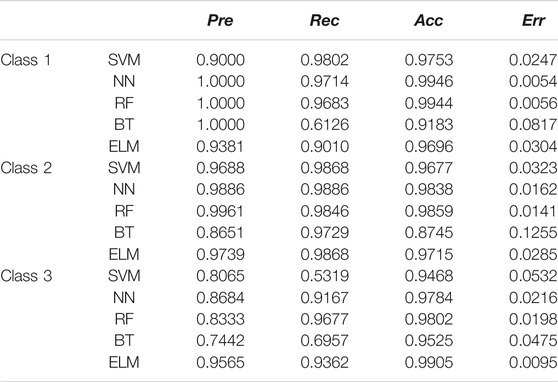
TABLE 4. Performance of ramp classification.
In Figure 6, three points having the same type present classifiers of three classes by a same algorithm. The points representing SVM and BT perform worse than the other three algorithms again. By comparing the points of NN, RF and ELM, it is seen that points of RF obviously are concentrated and closer to the upper-left corner, implying their classifiers have a better performance. Therefore, RF algorithm is finally chosen for modeling ramp classification in this paper.
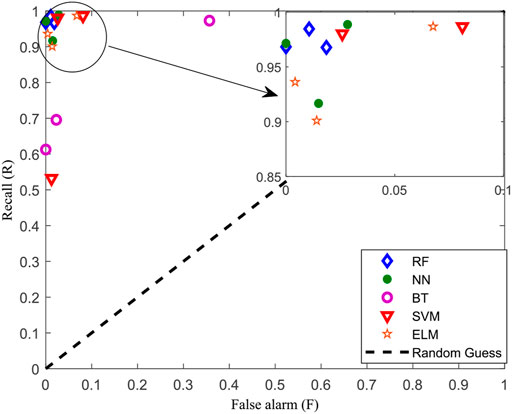
FIGURE 6. Four data mining models in ROC space.
Then, taking these trained RF models as ramp classifiers, 100 ramp events are selected from July to December as testing samples. To discuss the performance with and without wavelet characteristics in ramp classification, three different input sets are considered in the case study, such as initial feature set X0 consisting of vector Cv0, feature set Xp0 consisting of vector Cv = [Cv0, P] which contains basic ramp characteristics and all wavelet characteristics, refined feature set Xp consisting of Cvp = [Cv0, P3, P4] which reduces dimension by feature selection. Classification performance of testing data is presented in the following table.
Table 5 shows values of four indicators at classification of three ramp categories. Since three ramp categories have imbalance distribution as Table 2II, so the classification performance of Class 2 is the best. By comparing classification performance of using three feature sets, it is seen that using Xp0 has better performance than using X0, having an average improvement of 10.17% (8.14% on Pre, 14.77% on Rec, 1.80% on Acc, 15.98% on Err). These results imply wavelet characteristics are useful in ramp classification. Also, using Xp improves a little again (with an average improvement of 6.05%) than using Xp0, which implies that the proposed feature selection approach is feasible and effectual in ramp classification. While, for comparing with other feature selection methods, the commonly used PCA is applied. After the analysis of PCA on P = [P1, P2, P3, P4, P5], two principal components are selected to keep a same dimension with Xp, these two components contribute 84.00% explanation in classification, and consist of the feature set Xpca. Table V also presents the performance of Xpca. By comparing Xp and Xpca, it is seen that using Xp has an average outperformance of 3.69% than using Xpca. Summarizing all these results, the proposed approach on selecting wavelet characteristics is validated to be feasible.
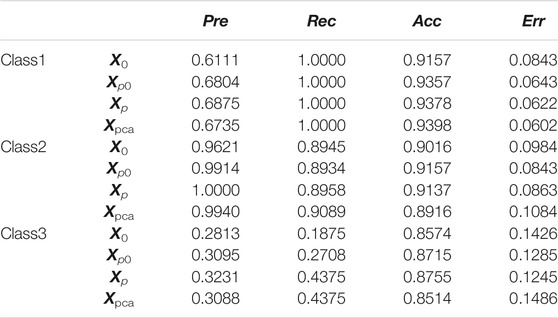
TABLE 5. Classification performance of different feature sets.
On the other hand, by utilizing these selected ramp characteristics, we could do some try on the study of ramp prediction. Since ramp classification has validated the effectiveness on distinguishing different categories, so two basic ramp characteristics are taken as target output in prediction, such as ramp amplitude (Var) and ramp rate (R). As the design of ramp prediction in Ramp Anomaly Analysis and Evaluation, the historical feature extraction window and the predicted time window are set as the same for convenience. In this paper, ramp prediction is designed to predict two variables (Var and R) within future horizon of 1, 2, ⋯, 5 h, the prediction performance is presented in the following table.
Table 6 shows the performance of ramp prediction by RMSE of two ramp characteristics. In these two variables’ prediction, a typical NN with three layers is used in modeling. For comparison study, four feature sets discussed in Table 5 are also utilized as inputs of prediction models. It is seen from results of Table 6 that models using feature sets containing wavelet characteristics (e.g., Xp0, Xp, Xpca) outperforms than that only containing basic ramp characteristics (e.g., X0). Through the proposed feature selection in this paper, the model using Xp has an improvement of 5.97% than using X0, 1.29% than using Xp0, and 2.70% than using Xpca on prediction of Var. Similarly, using Xp has an improvement of 16.30% than using X0, 8.24% than using Xp0, and 13.07% than using Xpca on prediction of R. Through the discussion on results of Table VI, it is concluded that the proposed approach on extracting and selecting ramp characteristics is also useful for constructing inputs of ramp prediction, and acquires good prediction performance.
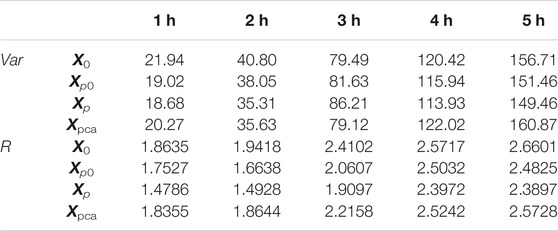
TABLE 6. Performance of ramp prediction.
The study in this paper focus on extracting and selecting profound ramp characteristics for in-depth ramp researches. First, based on wavelet transformation’s properties on time-frequency domains and multiresolution, wavelet decomposition is validated useful in analyzing ramps and non-ramps, also different categories of ramps. Then, ramp characteristics are extracted based on the energy decomposition at different wavelet layers. Combining with given ramp categories from wind process, heuristic feature selection methods (e.g., SFFS, SFBS) are applied to select valid characteristics, to remove redundant characteristics and reduce feature dimension. Based on basic ramp characteristics and selected wavelet characteristics, ramp studies on classification and prediction acquire better performance than that without wavelet characteristics and that using PCA in feature selection. Therefore, the conclusion could be summarized in this paper that wavelet transformation is useful to extract profound ramp characteristics, and that selecting ramp characteristics by the proposed approach is feasible to improve performance of ramp studies.
However, besides the above conclusions, there is also a number of conceptual alternatives worth discussing and pursuing: 1) ramp categories in this paper are determined by wind process. Therefore, the selected wavelet characteristics are not completely applicable to other ramp contexts. The approach involving feature extraction and selection in this paper could be still referential. 2) Ramp events generally involve complicated weather movement, it is reasonable that considering meteorological variables in ramp studies could improve the performance. While, for the limitation of data sources in this paper, we only consider ramp characteristics from wind power data. More work on exogenous variables will be studied in future. 3) Based on the selected ramp characteristics and results of some ramp studies, power system’s operation associated with ramp events could be studied further. Besides these points, more studies are needed to in-depth understand ramp events.
The original contributions presented in the study are included in the article/Supplementary Material, further inquiries can be directed to the corresponding author.
PY write the paper and implement the experiments. AL supervises the whole process.
This work is supported by Scientific Research Fund of Hunan Provincial Education Department (20A460).
The authors declare that the research was conducted in the absence of any commercial or financial relationships that could be construed as a potential conflict of interest.
All claims expressed in this article are solely those of the authors and do not necessarily represent those of their affiliated organizations, or those of the publisher, the editors and the reviewers. Any product that may be evaluated in this article, or claim that may be made by its manufacturer, is not guaranteed or endorsed by the publisher.
Ashrafian, A., Mirsalim, M., and Masoum, M. A. (2017). An Adaptive Recursive Wavelet Based Algorithm for Real-Time Measurement of Power System Variables during Off-Nominal Frequency Conditions. IEEE Trans. Ind. Inform. 14, 818–828. doi:10.1109/TII.2017.2727222
bpa.gov/transmission (2013). http://transmission.bpa.gov/Business/Operations/Wind/WindGenTotalLoadYTD_2013.xls.
Chen, Z., Zhang, L., Cao, Z., and Guo, J. (2018). Distilling the Knowledge from Handcrafted Features for Human Activity Recognition. IEEE Trans. Ind. Inform. 14, 4334. doi:10.1109/tii.2018.2789925
Chen, Z., Zhu, Q., Soh, Y. C., and Zhang, L. (2017). Robust Human Activity Recognition Using Smartphone Sensors via CT-PCA and Online SVM. IEEE Trans. Ind. Inf. 13 (6), 3070–3080. doi:10.1109/tii.2017.2712746
Couto, A., Costa, P., Rodrigues, L., Lopes, V. V., and Estanqueiro, A. (2013). “Impact of Weather Regimes on the Wind Power Ramp Forecast,” in 12th International Workshop on Large-Scale Integration of Wind Power into Power Systems as well as on Transmission Networks for Offshore Wind Power Plants, London, United Kingdom, October 22–24, 2013.
Doucoure, B., Agbossou, K., and Cardenas, A. (2016). Time Series Prediction Using Artificial Wavelet Neural Network and Multi-Resolution Analysis: Application to Wind Speed Data. Renew. Energ. 92, 202–211. doi:10.1016/j.renene.2016.02.003
Escalante Soberanis, M. A., and Mérida, W. (2015). Regarding the influence of the Van der Hoven spectrum on wind energy applications in the meteorological mesoscale and microscale. Renew. Energ. 81, 286–292. doi:10.1016/j.renene.2015.03.048
Florita, A., Hodge, B. M., and Orwig, K. (2013). “Identifying Wind and Solar Ramping Events,” in IEEE 5th Green Technologies Conference, Denver, CO, 4-5 April 2013 (IEEE). doi:10.1109/GreenTech.2013.30
Francis, N. (2008). Predicting Sudden Changes in Wind Power Generation, 58. Honolulu: North American Wind Power.
Gallego, C., Costa, A., Cuerva, Á., Landberg, L., Greaves, B., and Collins, J. (2013). A Wavelet-Based Approach for Large Wind Power Ramp Characterisation. Wind Energy 16 (2), 257–278. doi:10.1002/we.550
Gan, J. Q., Awwad Shiekh Hasan, B., and Tsui, C. S. L. (2014). A Filter-Dominating Hybrid Sequential Forward Floating Search Method for Feature Subset Selection in High-Dimensional Space. Int. J. Mach. Learn. Cyber. 5 (3), 413–423. doi:10.1007/s13042-012-0139-z
Gu, B., Sun, X., and Sheng, V. S. (2017). Structural Minimax Probability Machine. IEEE Trans. Neural Netw. Learn. Syst. 28 (7), 1646–1656. doi:10.1109/tnnls.2016.2544779
He, M., Vittal, V., and Zhang, J. (2013). Online Dynamic Security Assessment with Missing Pmu Measurements: A Data Mining Approach. IEEE Trans. Power Syst. 28 (2), 1969–1977. doi:10.1109/tpwrs.2013.2246822
He, S., Li, K., and Zhang, M. (2013). A Real-Time Power Quality Disturbances Classification Using Hybrid Method Based on S-Transform and Dynamics. IEEE Trans. Instrum. Meas. 62 (9), 2465–2475. doi:10.1109/tim.2013.2258761
He, Y., Kusiak, A., Ouyang, T., and Teng, W. (2017). Data-driven Modeling of Truck Engine Exhaust Valve Failures: a Case Study. J. Mech. Sci. Technol. 31 (6), 2747–2757. doi:10.1007/s12206-017-0518-1
Huang, H., Liu, F., Zha, X., Xiong, X., Ouyang, T., Liu, W., et al. (2018). Robust Bad Data Detection Method for Microgrid Using Improved ELM and DBSCAN Algorithm. J. Energ. Eng. 144 (3), 04018026. doi:10.1061/(asce)ey.1943-7897.0000544
Mohanty, S. R., Kishor, N., Ray, P. K., and Catalao, J. P. S. (2015). Comparative Study of Advanced Signal Processing Techniques for Islanding Detection in a Hybrid Distributed Generation System. IEEE Trans. Sustain. Energ. 6 (1), 122–131. doi:10.1109/tste.2014.2362797
Ouyang, T. (2021). Feature Learning for Stacked ELM via Low-Rank Matrix Factorization. Neurocomputing 448, 82–93. doi:10.1016/j.neucom.2021.03.110
Ouyang, T., Kusiak, A., and He, Y. (2017). Modeling Wind-Turbine Power Curve: A Data Partitioning and Mining Approach. Renew. Energ. 102, 1–8. doi:10.1016/j.renene.2016.10.032
Ouyang, T., Zha, X., and Qin, L. (2017). A Combined Multivariate Model for Wind Power Prediction. Energ. Convers. Manag. 144, 361–373. doi:10.1016/j.enconman.2017.04.077
Ouyang, T., Zha, X., Qin, L., and Kusiak, A. (2017). Optimisation of Time Window Size for Wind Power Ramps Prediction. IET Renew. Power Generation 11 (8), 1270–1277. doi:10.1049/iet-rpg.2016.0341
Sevlian, R., and Rajagopal, R. (2013). Detection and Statistics of Wind Power Ramps. IEEE Trans. Power Syst. 28, 3610–3620. doi:10.1109/tpwrs.2013.2266378
Shen, X., Ouyang, T., Yang, N., and Zhuang, J. (2021). Sample-Based Neural Approximation Approach for Probabilistic Constrained Programs. IEEE Trans. Neural Netw. Learn. Syst., 1–8. doi:10.1109/TNNLS.2021.3102323
Singh, K., and Tewari, A. (2015). Classification of Power Quality Disturbances Using Wavelet Transform and Neural Network. Int. J. Eng. Res. Tech. 4 (05), 1423. doi:10.17577/ijertv4is051331
Tang, Z., Zhao, G., and Ouyang, T. (2021). Two-phase Deep Learning Model for Short-Term Wind Direction Forecasting. Renew. Energ. 173, 1005–1016. doi:10.1016/j.renene.2021.04.041
Tang, Z., Zhao, G., Wang, G., and Ouyang, T. (2020). Hybrid Ensemble Framework for Short-Term Wind Speed Forecasting. IEEE Access 8, 45271–45291. doi:10.1109/access.2020.2978169
Wang, L., Zhang, Z., Long, H., Xu, J., and Liu, R. (2017). Wind Turbine Gearbox Failure Identification with Deep Neural Networks. IEEE Trans. Ind. Inf. 13 (3), 1360–1368. doi:10.1109/tii.2016.2607179
Wang, Z., Wang, W., Liu, C., and Feng, S. (2013). Uncertainty Estimation of Wind Power Prediction Result Based on Wind Process Method. Power Syst. Tech. 37 (1), 242–247.
Xiong, Y., Zha, X., Qin, L., Ouyang, T., and Xia, T. (2017). Research on Wind Power Ramp Events Prediction Based on Strongly Convective Weather Classification. IET Renew. Power Generation 11 (8), 1278–1285. doi:10.1049/iet-rpg.2016.0516
Zha, X., Ouyang, T., Qin, L., Xiong, Y., and Huang, H. (2016). Selection of Time Window for Wind Power Ramp Prediction Based on Risk Model. Energ. Convers. Manag. 126, 748–758. doi:10.1016/j.enconman.2016.08.064
Keywords: wind power ramp events, wavelet transform, feature selection, anomaly detection, feature exaction
Citation: Yu P and Lin A (2021) Heuristic Feature Selection for Wind Power Anomaly Events Study. Front. Energy Res. 9:756733. doi: 10.3389/fenrg.2021.756733
Received: 11 August 2021; Accepted: 14 September 2021;
Published: 01 October 2021.
Edited by:
Tinghui Ouyang, National Institute of Advanced Industrial Science and Technology (AIST), JapanReviewed by:
Zhenhao Tang, Northeast Electric Power University, ChinaCopyright © 2021 Yu and Lin. This is an open-access article distributed under the terms of the Creative Commons Attribution License (CC BY). The use, distribution or reproduction in other forums is permitted, provided the original author(s) and the copyright owner(s) are credited and that the original publication in this journal is cited, in accordance with accepted academic practice. No use, distribution or reproduction is permitted which does not comply with these terms.
*Correspondence: Anping Lin, YW5waW5nNzE5QDEyNi5jb20=
Disclaimer: All claims expressed in this article are solely those of the authors and do not necessarily represent those of their affiliated organizations, or those of the publisher, the editors and the reviewers. Any product that may be evaluated in this article or claim that may be made by its manufacturer is not guaranteed or endorsed by the publisher.
Research integrity at Frontiers
Learn more about the work of our research integrity team to safeguard the quality of each article we publish.