- School of Electrical Engineering, Vellore Institute of Technology, Vellore, India
Electrification in rural areas is relatively costly compared to urban areas. Therefore, the aim of this research is to identify the best combination of hybrid renewable energy systems (HRESs) to satisfy the load demand in a sustainable and cost-efficient way. The techno-economic study of stand-alone hybrid photovoltaic–wind turbine–diesel–battery-converter energy systems based on the hybrid optimization model for electric renewable (HOMER) simulation has been analyzed for various locations in the Tamil Nadu state, India. Various combinations of the systems have been compared and analyzed based on the performance of their technical parameters, costs, the electrical power production of each source, and unmet load. The findings indicated that the off-grid solar–wind–diesel–battery configuration is the most economical for all the sites among other system configurations. Comparing with conventional diesel generators among all the locations, a combination of solar/wind/diesel/battery is the economically best design for Thoothukudi, with the least and most reliable solution in terms of net present cost and cost of energy. Also, the impact of intermittent variables becomes significant, so sensitivity analysis for the various parameters has been carried out. The study finds that the least cost of electricity and the net present cost of electricity for Thoothukudi are achieved at 0.266 $/kWh and 138,197 $, respectively. This is economical compared to a stand-alone diesel system where the obtained COE is $1.88 and the NPC is $977523. In the stand-alone diesel operating mode, 41854 kg of CO2 is produced, which is higher than CO2 emissions associated with any other renewable energy systems. According to the results, the Kanyakumari location outperforms in terms of producing environmental pollutants with emission of 1,020 kg/y CO2 at their best. Moreover, the results of the proposed study imply that the proposed renewable energy system in remote sites could be a more economical measure.
Introduction
In the past few years, increasing sustainable growth in the industrial sector and global population have increased energy demand. Presently, conventional power systems mainly rely on the usage of nonrenewable resources such as oil, gas, and coal. Therefore, utilization of these fossil fuels contributes to several negative effects on the environment due to the emission of greenhouse gases (Chua and Oh, 2010). The availability of grid facilities to connect the load is available for all places. However, this arrangement remains the greatest challenge in rural areas to access electricity. For scattered communities, grid extension is not economical and offers high transmission losses and light loading conditions. Moreover, due to limited availability of fossil resources and increasing fuel prices, high grid extension investments are required (Mamaghani et al., 2016). Rural areas are the backbone of India, which relies on agro sectors. Moreover, rather than basic residential loads, it requires electricity to pump water for machines to harvest crops, to run mills, etc. However, in India, approximately 18% of the population does not have the access to continuous and reliable power supply. Hence, the existing poor service of power supply has been considered as a steady problem for rural locations in India (Kumar et al., 2019). Currently, India relies on 76% of coal as a sustainable and potential fuel for power generation (Laha et al., 2020). As the fossil fuel dependency has major drawbacks, India has been planning to entail its power capacity from 40% renewable sources till 2030 (MNRE, 2018). The global percentage of population with access to electricity increased from 83% in 2010 to 87% in 2015 and is estimated to reach 92% by the current rate till 2030. As the target is 100% till 2030, the remaining 8% gap is achieved by sustainable development goal (SDG) 7 by 2030 (Mawla and Khan, 2020). Also, energy production from conventional fossil fuels acts as a driver of climate change, accounting for about nearly 70% of overall global greenhouse gas emissions (Sustainable development goals, 2020). Goal 7 of the SDGs seeks to close the energy access gap and to avoid the worst impacts on environmental climate change and also to ensure affordable, reliable, and modern energy services for all by 2030 (Closing the Energy Access Gap, 2020). The global percentage of renewable energy share to total energy consumption gradually increased from 16.6% in 2010 to 17.5% in 2016 and is expected to reach 21% by the current rate till 2030 (Economic and Social Council, 2019). Renewable energy sources (RESs) made up 26.2% of global electricity generation in 2018 and are expected to rise to 45% by 2040. Most of the increment is likely to come from solar, wind, and hydropower (Center for Climate and Energy Solutions, 2020). Therefore, RESs will play an important role in the future, which hopes to meet the energy demand reliably, especially in remote areas having low demands. However, RES associates with some restrictions such as its intermittent nature and uncertainties, which inevitably affect its reliability and ultimately might not yield the adequate power generation if RESs are employed as stand-alone sources to meet the demand. To encounter the above-mentioned weaknesses and to exploit RESs effectively, integration of two or more RESs has to be employed as hybrid renewable energy systems (HRESs). In spite of vulnerable outcomes due to limitations of renewable sources, they are able to obtain holistic efficiency of renewable sources by utilizing the advantages effectively (Vendoti et al., 2021). Currently, developing countries are struggling with three central problems. 1) Millions of the population still do not have electricity access, so it is necessary to accomplish basic electricity needs; 2) environmental insecurity is still raising more and hence needs to preserve the global by less carbon emission systems; and 3) serious worries on the energy crisis, which stifle global economic growth.
In India, energy sectors have been increasing at the greatest pace and are estimated to acquire a crucial drive in the growth of energy demand and globally expected as 16% energy demand rise by 2035. In India, coal will continue its shares likely to around 65% in the total energy generation up to the year 2035. However, capacities of power generation will not be sufficient for load demand as a gap still exists between generations and demand with nearly 40% (Deb and Kumar, 2018). The only state in India where one-third of generated electricity originates from the renewable resources is Tamil Nadu. This state is blessed with a diverse class of renewable forms such as wind, solar, biomass, biogas, and hydro. Tamil Nadu’s current average electricity consumption is between 14,500 and 15,500 MW. With a total installed capacity of 31,894 MW, Tamil Nadu has India’s most diverse power-generating portfolio, with 50% renewable energy (Energy department of Tamil Nadu, 2020). Economic feasibility of implementing the solar PV–wind–diesel composite system for telephone transceiver stations, which is located in the far-flung rural place of Tamil Nadu, is presented by Kumar and Manoharan (2014a). The result of the simulation is hopefully helped to select the ideal place for installing an absolute off-grid hybrid network within Tamil Nadu in different climatic zones. Due to limited consumers and higher transportation costs, the cost of utility is increasing in rural areas of Madhya Pradesh in India, so the author developed an optimal renewable energy system that comprises solar and wind (Sawle and Gupta, 2014). For different geographical regions of Greece, the technical and financial assessment of four hybrid networks that have at least one renewable source of energy to meet all local loads has been evaluated. For these regions, HOMER has provided optimal solutions in terms of installation, fuel, operational, and replacement costs (Panapakidis et al., 2012). A techno-economic viability study for the multiple combinations of wind turbines, photovoltaics (PVs), and diesel generator engines has been examined in Colombia for energy generation in several off-grid parts of the country under various climate features, and the best energy and cost configuration has been identified (Mamaghani et al., 2016). Electrified Indian villages undergo a daily power failure of 15 h or more. The investigators examined a feasibility study of three separate hybrid systems such as solar PV–fuel cells, wind–fuel cells, and PV–wind–fuel cells. The results show that the hybrid PV–fuel cell system under specific meteorological conditions for residential remote areas in the Sunderbans, India, is more cost-efficient and suitable than the other networks (Dey et al., 2016). In the study of Sawle et al. (2018a), a techno-economic feasibility study is performed through a genetic algorithm (GA) and particle swarm optimization (PSO) techniques on case-I (PV–wind–biomass HRES) and case-II (PV–wind HRES) with load flow and cycle charging strategies. For both cases, the most effective and reliable solution has been obtained with CCS as compared to LFS. In the study of Thirunavukkarasu and Sawle (2020), an off-grid PV/diesel/battery hybrid system is designed to provide power supply for rural areas in Vellore, Tamil Nadu, India. For this system, optimal sizing and economic analysis are performed using HOMER. The author has modeled six different configurations of hybrid green energy systems for Barwani, Madhya Pradesh, India. By using HOMER, optimization has been done for all six combinations, and the results suggested that the PV/wind turbine (WT)/biomass/diesel generator (DG)/battery system (BS) hybrid configuration is the most feasible design for this location (Sawle and Thirunavukkarasu, 2020). The author modeled and analyzed an off-grid hybrid system for an isolated remote location in Northern Manitoba. Three different scenarios were examined and compared with the existing diesel generator system to determine the most promising optimal one. Optimization results have revealed that the hybrid photovoltaic–diesel–battery would be a notable role with a cost of energy (COE) of 0.5121 (Canadian Dollar/kWh) and 22% of fuel savings while comparing with the existing diesel system (Kaluthanthrige et al., 2019). The authors have implemented hybrid binary particle swarm optimization and the shuffled frog leap (BPSO-SLFA) technique for optimal placement and sizing of distributed generations to minimize power loss and improve the voltage stability in 33 and 69 bus radial distribution networks (Hassan et al., 2020). A hybrid energy system-based electric vehicle charging station employing real-time data in HOMER software has been created and optimized. Furthermore, after modeling the suggested model, the findings show that the hybrid charging station system successfully meets a specified load need and reserves a significant quantity of power for the charging of electric vehicles (Nandi et al., 2018). The authors employed renewable energy systems to power rural health clinics, reduce electricity and fuel costs, and improve health and life quality in such distant coastal locations (Kumar and Manoharan, 2014b). The HOMER computational tool was utilized to analyze the hybrid energy sources with the combination of solar and wind and suggests that the proposed system would effectively satisfy the electrical demand for a health-care building (Karthick et al., 2021). A microgrid for buildings is designed by the author, which is technical and cost-effective. The analysis is performed for a case trial utilizing actual data from a building in South India (Kumar and Bhimasingu, 2014). The authors discussed the architecture and integration of the smart grid, as well as various objectives and constraints related to the grid components (Thirunavukkarasu and Sawle, 2021). Table 1 lists a few case studies developed in the Indian scenario.
However, studies were based on the literature providing analysis for locations where there is a possibility of accessing grid power and do not project more comprehensive analysis for unelectrified sites. People living in the selected rural areas do not have access to grid-connected power. These communities are still without power since supplying energy is challenging owing to location and economic issues. For isolated regions, the cost of installing and maintaining distribution lines is too expensive. There will also be a significant rise in transmission line losses in addition to poor power supply dependability. Extensions of the power grids are often subject to costly capital investments, low demand, poor voltage control, and frequent power supply disruptions at remote and nonelectrified sites. As a result, an accessible, cost-effective, and reliable source of power is critical to the development of any rural region. As a result, off-grid renewable energy generation is chosen for unelectrified sites and encouraged to overcome all the shortcomings of the standard method of power generation and transmission.
Research Gap
Based on the literature, it has been identified that the integrated renewable sources act as bridging to electrify remote locations, and in recent days, the Ministry of New and Renewable energy (MNRE) of India has guided to undertake off-grid electrification through renewable sources for poorly electrified remote rural communities. Furthermore, focusing on single renewable energy generators still provides a gap between load and demand, along with poor economical and low renewable penetration. In this context, to improve economical and renewable penetration, this article has attempted to design an electrification system for the remote village in the Tamil Nadu regions, which has a high degree of solar and wind renewable resources. So far, there are few comprehensive analyses that have been carried out on techno-economic assessment for PV/wind/battery hybrid systems in Tamil Nadu, India, for domestic load. Therefore, the key purpose of this study is to investigate off-grid HRES configurations in different locations of Tamil Nadu, India, and to seek the best combination of available renewable energy sources to deliver electricity reliably and sustainably.
Contribution of the Research
The main contributions to this work are as follows:
• A novel off-grid hybrid renewable energy system is developed for the size and cost-effective optimization problems in rural remote areas of Tamil Nadu.
• System performance of different locations is evaluated based on the minimum value of net present cost (NPC) and cost of energy (COE).
• Sensitivity analysis is performed for the variation in diesel fuel price, solar radiation, wind speed, nominal discount rate, and scaled annual average load per day.
• The proposed system has to achieve reasonable environmental benefits, more renewable fractions, and less emission.
Organization
The remaining study is arranged in five sections, including the Introduction as follows: Section II describes the study area. Section III explains the methodology utilized in this work. Sector IV presents the results and discussion, followed by the conclusion.
Study Area
Description
There are several deposits of minerals in the Tamil Nadu state, and the main minerals include limestone, bauxite, gypsum, lignite, magnetite, and iron metal. In the northcentral part of India, opencast lignite mines in Neyveli are one of the largest in India, used as a fuel for Neyveli fuel plants. This plant provides a significant part of the total power of the state. The corporations in Tamil Nadu are heavily involved in the manufacturing of car parts, textiles, leather, sugar, electronic device, etc. The total installed power capacity (MW) in Tamil Nadu (includes allocated shares in the private and central zones) is coal-fired (11,832.99), lignite (1,790.75), natural gas (1,027.18), diesel (211.70), nuclear power (1,448), hydropower (2,178.20), and renewable energy (16,532) as shown in Figure 1 (All India installed capacity, 2020). Figure 2 shows the total installed capacity of various resources in percentage in Tamil Nadu with allotted shares through the private and central sectors. More study on clean energy deployment in Tamil Nadu has been required for offsetting the carbon emission with the coal burn. An extract from a study conducted by the Tamil Nadu energy development agency reported that the position is projected to raise renewable energy by setting green energy goals and carbon neutrality targets under the Paris agreement.
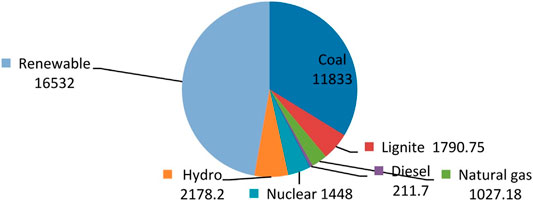
FIGURE 1. Total installed capacity (MW) in Tamil Nadu (including allotted shares in joint and central sectors).
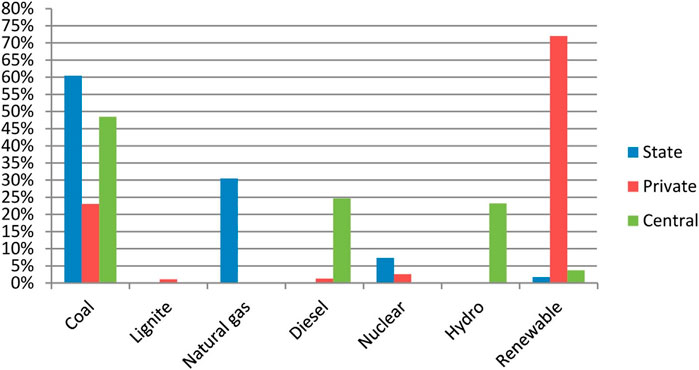
FIGURE 2. Installed capacity of various resources in Tamil Nadu (including allotted shares in joint and central sectors).
The energy consumption sectors in Tamil Nadu require high energy as demand is increasing day by day, particularly in the residential sector, and hence give rise to an action for research into renewable energy sources in the residential sector. The use of green energy sources, including solar, biomass, and wind, has the potential to achieve sustainability, eco-friendliness, energy efficiency, and reduction of carbon emission. Tamil Nadu has plenty of opportunities to support and leverage renewable sources, such as solar PV, wind, and biomass for household and organizational applications in more remote regions.
Issues With Renewable Energy in the Study Area
Financial expenditure, subsidies, tariffs, market models, and different policies are certain conditions contributing to clean energy implementation. The renewable technology investment cost is more than ever before. Carbon emission goals, ensuring long-term energy sources, and reducing reliance on fossil fuels are the factors driving this expenditure. The risks inherent in owning, building, and operating such plants also increase as the investment in renewable energy plants rises. The political, regulatory, and economic risks are now becoming more acute as economic prospects deteriorate in many countries. Moreover, as wind farms begin to increase their investments, the volume of risk relating to weather is especially salient. Thus, these risks are raising critical concerns regarding the potential growth of worldwide green energy (Risk Management in renewable energy and sustainability in India, 2019). Moreover, in Tamil Nadu, power generated from coal fired has a significant impact on the environment and health impacts, and also, the energy consumption and CO2 emission from the coal-fired thermal power plant till 2030 have been expected as 26.9 GW and 250 million tons, respectively (Coal Kills Health Impacts of Air Pollution from India’s Coal Power Expansion, 2020). Hence, in Tamil Nadu, several attempts are being made to use clean renewable energies effectively by implementing stand-alone and grid-integrated renewable systems. A scheme called environmental protection and renewable energy development fund has been established by the state government to promote, mitigate, and provide corrective measures to reduce the effects of climate change in the state (Environment Protection and Renewable Energy Development, 2020).
Methodology
For modeling, simulation, and analysis of the hybrid energy system, HOMER software is utilized, which is developed by the National laboratory for renewable energy, United States. It is an effective system design tool for all purposes that make it simpler to design an off-grid system design or a system directly connecting the grid. It includes the use of inputs such as load, wind, and solar profiles for a specific area, diesel costs, system control parameters, and technical and component costs. It executes hourly based simulation to achieve the optimum relationship between load and supply to design the optimum device. It provides a list of viable device configurations sorted by cost efficiency and offers an optimum setup dependent on the lowest net present cost (Sawle et al., 2016). Figure 3 describes the flow chart of HOMER (Tazay, 2021).
The sensitivity analysis method implements multiple optimizations in a variety of inputs such as wind speed, solar radiation, diesel prices, nominal discount rate, etc., to determine the effect of variability or uncertainty in the model inputs. In particular, HOMER keeps executes the optimizing procedure for each sensitive parameter that is defined when sensitivity variables are listed as inputs.
Methodology
Data Collection
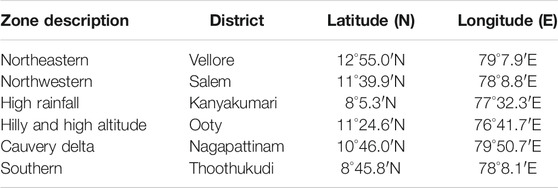
The renewable potential assessment locations in this study were chosen from six different climatic geopolitical areas in Tamil Nadu, India. The zones considered for the study are Vellore, Salem, Kanyakumari, Ooty, Nagapattinam, and Thoothukudi as listed in Table 2. Climate details including wind velocity and PV radiation used for this study have been collected from National Aeronautics and Space Administration (NASA). According to NASA, monthly averaged global solar radiations for sites were collected over 22 years on a horizontal plane from NASA, and at the anemometer height of 10 m, the wind speed data are recorded for 30 years. The daily radiations of solar and clearness index for a year at various coordinates in Tamil Nadu are shown in Table 3, where Hav represents the average monthly exposure of solar radiation in kWh/m2 day and KT represents the index of clearness. Further, Table 4 indicates an average monthly air velocity for one year, where WS represents the average rate of wind speed every month in m/s. This study lays out a techno-economic viability review and efficiency evaluation for an optimum scale of the combined PV/WT/DG/BS power grid for providing electricity to off-grid applications using HOMER.

TABLE 3. Meteorological data of solar radiation and clearness index for various Tamil Nadu locations.
Load Profile
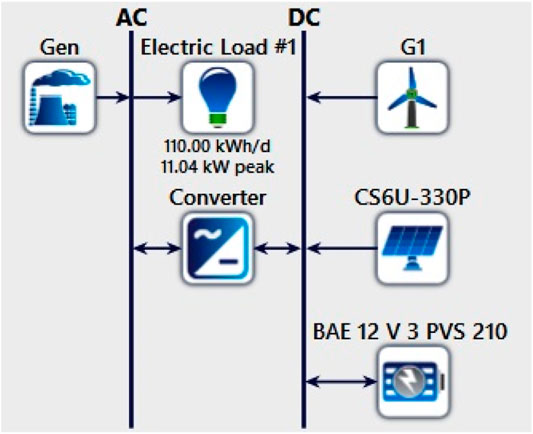
The load data were collected from 10 residential houses located in Tamil Nadu for 24 h. The hybrid system is considered to provide power to the estimated load profile, such as lamps, mobiles, fans, televisions (TVs), and radios. All these pieces of equipment are run for all days, but it is assumed all these are not using at the same time per day. A total of 10 houses (out of a total of 100 in the villages) were surveyed, and it was found that the preponderance of the households’ energy demand profiles is identical. For each household, domestic appliances such as lights, fans, TVs, radios, mobile phone chargers, and others require electricity. Table 5 depicts the load demand for a single household. The total load demand comes out with approximately 110 kWh/day and a peak load of 11.04 kW with a day-to-day random variability of 10%. Figure 4 depicts the load profile for a residential load (HOMERpro3.14, 2020b).
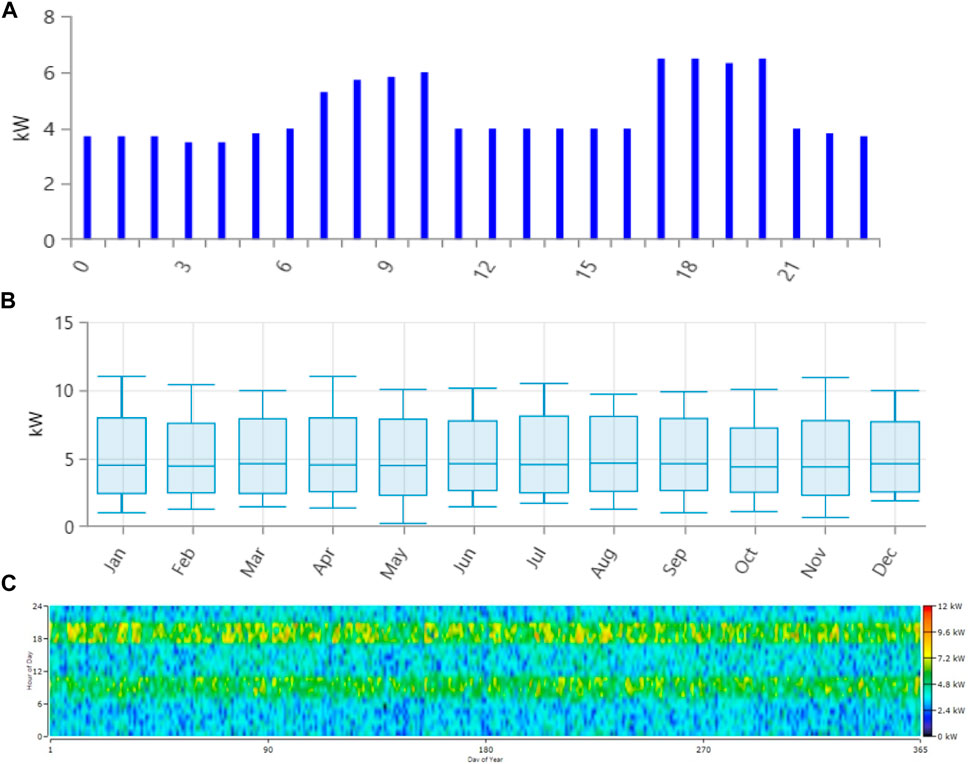
FIGURE 4. (A) Daily load profile for a residential load (Hours/day). (B) Monthly load profile for a residential load. (C) DMAP of the yearly load profile for a residential load
Components of the Proposed Configuration
It is seen from Figure 5 that the combination of the systems includes solar systems, wind turbines, batteries, and a diesel generator for backup. In the hybrid system, electrical demand is coupled at the alternating current (AC) bus side, the wind sources and diesel generator are attached to the side of the AC network, and the solar systems as well as energy storage devices are paired to the side of a direct current (DC) link. The solar PV and wind system are combined to provide renewable energy, while the diesel generator serves as an auxiliary unit to fulfill the electric demand during unforeseen fluctuation of sunshine and wind speed. The energy storage device is used to maintain constant power for high loads even in low resource times and to ensure the highest reliability of electricity at the load terminals. The role of a power converter is to process and control electricity flow in the form suitable for consumer loads. The cost details of each component including initial capital, substitution, and operation and maintenance (O and M) costs are shown in Table 6 (Baruah et al., 2021; Olatomiwa et al., 2015).
Modeling of the Proposed System
Solar System
Solar power is an immense limitless energy source. Irradiance is the amount of solar radiant energy that falls on a surface per unit area and time. Solar cells have been developed to convert solar radiation into electrical energy as part of satellite and space travel technologies. In contrast to traditional collectors converting solar radiation to heat, photovoltaic solar cells use the energetic photons for direct electricity produced by the incipient solar radiation. For designing, CS6U-330P polycrystalline cells having a nominal maximum power of 0.330 kW have been chosen with a derating factor, and ground reflectance was applied as 88 and 20%, respectively. HOMER user must include a report on the solar resource to the venue. The report of solar resources indicates how much solar energy hits the surface of the earth over a year. The ratio of measured local irradiation concerning calculated extraterrestrial irradiation at that location is termed as the clearness index. The solar array is designed by HOMER to produce DC electricity accurately proportionate to global solar radiation regardless of temperature and voltage. The PV output performance is determined by Eq. 1. It provides the maximum PV array output (Sinha and Chandel, 2015).
where YPV defines the solar power capacity in kW, Fspv defines the solar derating factor, Gt represents the solar radiation incident on the PV array (kW/m2), GSTC represents the incident solar radiation under standard test conditions (1kW/m2), αp defines the temperature coefficient based on power, TC is the temperature of the cell, and TC,STC represents the solar PV cell temperature under standard test conditions (25°C).
Wind System
Wind power has been used widely since the Medieval Era. The indirect manifestation of solar energy is wind power. Wind is formed as a result of two things: 1) solar energy absorption on the surface of the earth and in the atmosphere and 2) the earth’s rotation around its axis as well as its orbit around the sun. A wind turbine is a mechanical device that transforms the kinetic energy of flowing air into mechanical motion, often in the form of a spinning shaft. This mechanical action has the potential to create electricity. The benefit of the use of wind energy is that it has a reasonably good potential as an energy source and does not cause pollution. A generic 12 model of a 1 kW wind turbine with a hub height of 17 m was selected and modeled by HOMER to transform the wind’s kinetic energy into AC or DC electric energy based on the power curve. The HOMER user must have the information about the wind resource, showing the range of the speeds of wind that will occur during a normal year for modeling a structure that contains one or more wind turbines. In a four-phase process, HOMER calculates the wind turbine power output of each hour. First of all, by representing wind resource data, the average hourly wind speed is determined by the anemometer height. Second, using either the logarithmic law or the power law, the resulting strong wind level at the height of turbine hub is measured. Next, the power curve of the turbine is used to measure its power output at that wind speed by assuming the standard air density. Finally, by multiplying the value of output power by the ratio of air density, the ratio of real air density with standard air density is determined. By the application of the power rule, HOMER calculates strong wind levels at the height of the turbine hub by Eq. 2 (HOMER, 2020).
where WS is the speed of wind in m/s at the level of hub height, WS,anem is the speed of wind in m/s at the level of anemometer height, Zhub is the height of the hub in meter, Zanem is the height of the anemometer in meter, and α is the exponent of the power law. The maximum power output of a wind turbine is determined by Eq. 3 (HOMER, 2020).
where Pwtg is the maximum output power from a wind turbine in kW, ρ is the definite density of air in kg/m3, ρ0 is the density of the wind at standard temperature and pressure, and Pwtg,stp is turbine power output in kW at standard temperature and pressure.
Generator System
Due to low cost, simplicity of installation, and ease of operation, diesel generators are often employed for distant electrification. The most reliable source of backup electricity is provided by diesel generators. When compared to other technologies, one of the most significant and distinguishing characteristics of diesel-powered generators is their short response time, which allows them to start quickly. A number of generators, such as internal combustion engine-based generators, microturbines, fuel cells, Stirling drives, thermophotovoltaics, and thermoelectric drive generators, can be modeled using the HOMER generator module. Diesel generators (auto-size generator set) with a 13 kW rated power with a minimum load ratio of 25% of the rated capacity are considered for this research. The fuel curve is considered to be a straight line with an intercept Y using Eq. 4 for the engine fuel usage (Ani and Abubakar, 2015).
where F0 is the intercept coefficient of the fuel curve, F1 is the slope of the fuel curve, Ygen is the rated power of the generator (kW), and Pgen is the power output of the generator (kW).
HOMER measures the fixed and marginal energy costs of the generator and uses it to model the operation of the device. Fixed energy costs are the expenses of operating the generator per hour without electricity generation. HOMER measures the generator’s energy cost (Gec) at a fixed rate by using Eq. 5 (Lambert, 2006).
where Com,g denotes the generator service and repair expenses per hour, Crep,g denotes substitute prices, Rg is the generator lifespan in hours, F0 is the intercept coefficient of the fuel curve, Yg is the generator power capability in kW, and Ceff,fc is the effective fuel cost.
The incremental energy cost is the extra energy output cost per kilowatt-hour per generator. HOMER calculates the marginal energy cost of the generator with the Eq. 6 (Kim, 2013).
where F1 is the slope of the fuel curve and Ceff,fc is the effective fuel cost.
Battery
The storage technology is used to collect and store electricity as another type of energy (chemical, thermal, and mechanical) and then release it for usage as necessary. Energy storage enables flexible energy utilization at different periods from the moment it is generated. This can improve the system efficiency and stability by matching supply with demand and can enhance power quality. Battery energy storage systems are rechargeable batteries that can store and smooth the output of renewable power generation sources. HOMER develops a standard battery to hold an enough quantity of electrical power on a specified round trip energy efficiency, with restrictions on how shortly it can be charged or released, and defines how intensively without significant loss it can release the energy and also measures the amount of power handled until it is substituted. The kinetic battery model was used for this study, and its lifetime is considered to be 5 years. The minimum state of charge is 20%, and the initial charge is 100%. The estimation of the charge status can be described by Eq. 7 (Ladide et al., 2019).
where Cb is the capacity of the battery and Cm represents its maximum capacity.
The depth of charge is expressed by Eq. 8 (Ladide et al., 2019).
where DOC is the depth of charge and SOC is the state of charge. According to Eq. 9 (Ladide et al., 2019), the battery is protected against deep charging and overcharging
where Ct is the instantaneous battery charge capacity and Cmax and Cmin are the maximum and minimum battery capacities, respectively.
Economic Modeling
HOMER includes capital, replacement, maintenance and fuel expenses, rescue rate, and all other expenses for the annualized estimated expense. These values are important since HOMER uses them to estimate the two key economic estimates of the system, which reflects gross current net expense and electricity cost.
Net Life Cycle Cost
To reflect the expense of a system life cycle, HOMER calculates the total net current cost. With potential cash flows, weighed down by the discount rate, the net NPC consolidates both costs and benefits over the lifespan of the project in one lump sum at the current price. HOMER uses Eq. 10 to determine the gross net current expenditure (Sawle et al., 2018b).
where Cann,tot is total annualized expense, i is the real discount rate, Rproj is lifespan of the project, and CRF is the re-capitalization factor. Capital recovery factor is represented by Eq. 11 (Sawle et al., 2018b).
where N is the number of years and i is the real discount rate.
Real Discount Rate
This research uses the United States dollar ($) as the currency for all cost figures. The considered main economic variables are the nominal discount rate (NDR) set to 8%, the expected inflation rate at 2%, the real discount rate at –5.88%, and the project lifetime at 25 years. For the conversion between one-time costs and annualized costs, the real discount rate is used. From the nominal discount rate and predicted inflation rate inputs, HOMER calculates the annual actual discount rate. To calculate discount variables and annualized costs from NPC, HOMER uses the actual discount rate. Capital recovery factor is represented by Eq. 12 (HOMERpro3.14, 2020a).
where i' is the nominal discount rate and f is the expected inflation rate.
Cost of Energy Expenses
The average price of usable power per kilowatt-hour provided by the network is referred to as the energy cost levied. To calculate the energy cost, HOMER uses Eq. 13 as (Hiendro et al., 2013).
where Cannual,total is the system total annualized cost, Eprimary and Edeferrable are the total amounts of primary and deferrable load served by the system for a year, respectively, and Egrid,sales is the amount of electricity supplied every year to the grid. In Eq. 13, the denominator indicates the cumulative volume of utilitarian energy by the system created annually.
Environmental Criteria
The environmental concerns related to carbon emissions are one of the indispensable problems in any hybrid device configuration. The amount of CO2 emissions can be calculated based on Eq. 14 (Ladide et al., 2019).
where Tco2 is the total measure of CO2 emissions, Vf is the fuel consumption in liter, Fhv is the heating value of fuel (MJ/L), Fcef is the carbon emission factor (ton carbon/TJ), and Xc is the oxidized carbon fraction.
Renewable Fraction
The fraction of electricity supplied to the demand from renewable sources is termed as renewable fraction. Using Eq. 15, HOMER computes the renewable fraction (Sawle et al., 2017).
where Frenewable is termed as renewable fraction, Enonren is termed as nonrenewable electrical power production (kWh/yr), Hnonren is termed as nonrenewable thermal energy production (kWh/yr), Eserved is total electrical load served by the sources (kWh/yr), and Hserved is the total thermal load served (kWh/yr).
Results and Analysis
Location: Vellore
Configuration: PV/Wind/Diesel/Battery
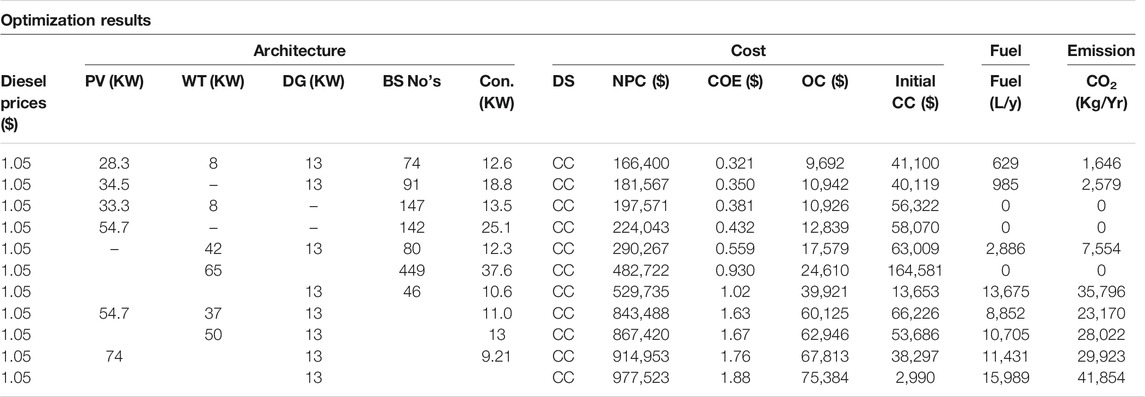
Table 7 presents the HOMER optimization results of the PV/wind/diesel/battery system for the location of Vellore. The optimum option at a 5.14 kWh/m2 per day average global solar radiation, a 5.07 m/s annual average wind speed, and a $1.05/L diesel price comprised a 28.3 kW PV array, a 8 kW wind turbine, a 13 kW diesel generator, a 74 unit battery, and a 12.6 kW converter. With a renewable fraction of 94.7%, the COE of this model is $0.321/kWh. The initial investment of the said structure was $41,100, and the maximum NPC of $166,400, on the other hand, is $977,523 for the stand-alone diesel system, which is greater than 488% higher than the proposed design. The configuration of this system remains therefore viewed as a cost-effective alternative to the diesel system. It should have been noted that the total budget of the project for the PV array is almost 40.96% of the total NPC, of which the initial investment is approximately 90%. The battery cost for 74 units is 27.21% of the entire system NPC, followed by the diesel generator and wind turbine cost, which accounts for approximately as 15.41 and 14.78%, respectively. A converter, which represents 1.64% of the total NPC, is the lowest possible cost item.
Figure 6 clearly shows total electrical power generation from the PV/wind/battery system. Solar energy generates approximately 75.8%, while 20.5% is generated by wind turbines and 3.68% is generated from diesel out of the overall annual output. Power generation from solar gradually increases from the initial month of January to April and gradually comes down for three months from May to almost July as solar power is not available as much. Moreover, wind generation leads to play a vital role to balance the lack of solar power from solar generation. The electricity production from the wind turbine is limited due to the lower wind speed at the site to the months from September to November, but the solar system and diesel generator contribute to meet the demand during this period.
The generator produces 2,130 kWh every year with 629 L of fuel for 174 h/year with the capacity factor of 1.87%, but with contrast, the base case diesel system consumes 15,989 L per year and produces 40,784 kWh/year of electricity, run for 8,760 h. In the months of September, October, and November, diesel contributions are significant, but in the months of March, April, and May, they are nil. When there is a supply shortage from PV and wind, the diesel generator kicks in automatically. The morning hours (12:00 a.m.–09:00 a.m.) are when most diesel power is produced, and the generators in this hybrid power system produce an average of 12.2 kW. The primary drawback of using diesel generators in power systems is the contamination of the environment, high running costs, and noise. The use of renewable energy reduces atmospheric emissions of CO2, CO, SO2, NOX, and particulate matter. In the period of uncertainty of solar radiation and wind speed, the diesel generator makes a significant contribution to satisfying demand. The excess electricity of this hybrid system is 20.9%. The massive quantities of generated electricity can be used for the dumping load or agreed to sell to the grid. As the wind turbines share the demand, this configuration provides electricity at a lower cost of $0.321 and leads ahead in terms of economics when compared to other configurations. The next choice of configuration is the PV/diesel/battery, which differs from the first case without the inclusion of a wind system. From the above results, the first case is considered as the best economic design due to the inclusion of the wind system, and also, the diesel generator has operated for fewer hours and emits low pollutants.
Location: Salem
Configuration: PV/Wind/Diesel/Battery
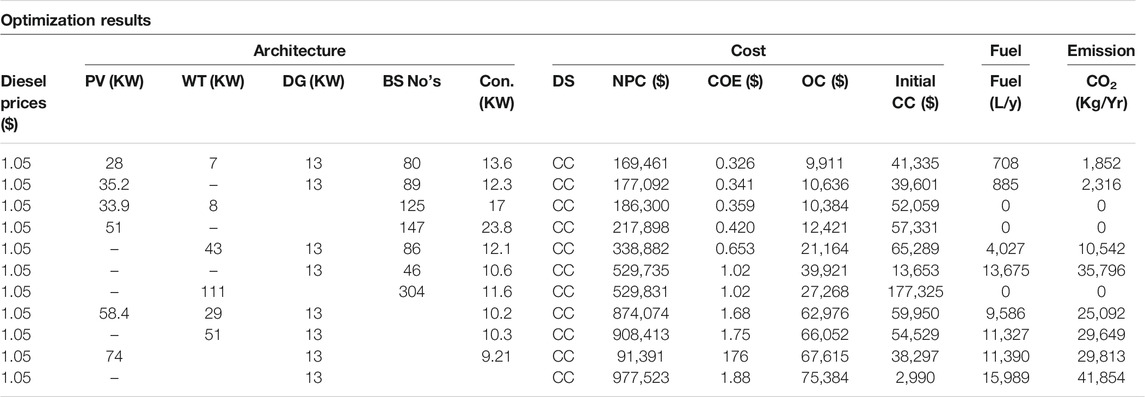
The process is based on net present costs, which amount to gross construction costs, O and M costs, replacement costs, and recovery costs, for all hybrid device elements over the life cycle of a project. The quite plausible HRES designs are shown in Table 8. The cost summary of the best optimal system has the lowest $169,461 NPC and $0.326 COE per kWh, with a 28 kW solar photovoltaic, a 7 kW wind generator, a 13 kW source of diesel power, 13.6 kW converters, and 80 battery power storage. The average solar system cost is comparatively higher, accounting for about 39.81% of the net present aggregate system cost, and follows a 28.88% battery system, a generator with 16.87%, a wind energy system with 12.70%, and a converter with 1.74%. The energy content provided by the entire year hybrid power system is 54,826 kWh to provide 40,150 kWh of primary AC load per year.
Electricity generation is higher during periods of high solar radiation striking the earth’s surface, with March receiving the highest amount of irradiation. From May until the end of August, PV power generation is lower than that in the other months. A daily average maximum solar power output of 21.42 kW is registered in March, and a minimum daily average solar power output of 15.99 kW is registered in July. Wind generation peaks in June and July, with a daily average of more than 5 kW, and there are low contributions in April and October, with a daily average of less than 2 kW. In the months of February, March, June, and July, the diesel component of the system is dormant since solar and wind loads have satisfied these loads sufficiently. As shown in Figure 7, 28 kW of PV is produced with an average annual output of 120 kWh/day at the penetration level of 109%. The wind turbine generates the amount of 8,590 kWh/year energy, which seems to have a 21.4% penetration rate. The diesel fuel engine runs about 196 h/year and has 76.5 years of life expectancy. The power bank with 24,260 kWh vitality intakes, 20,698 kWh of vitality produced, and 3,646 kWh of vitality lost per year provides autonomy of 33.7 h. Its storage capacity is almost predicted to be five years. The 13.6 kW inverters have a capacity factor of 32.9% with 8,577 h of operation in a year. For a year, the vitality intake, outputs, and losses by the inverter are 41,357 kWh, 39,289 kWh, and 2,068 kWh, respectively. The 13.6 kW rectifiers with a capacity factor of 1.22% have been operating for 183 h in one year. For a year, the vitality intake, outputs, and losses by the rectifiers are 1,534 kWh, 1,457 kWh, and 76.7 kWh, respectively. It is completely obvious here that hybrid PV/diesel generator/battery arrangement is the second optimum combination into this location, with 35.2 kW photovoltaic arrays, a 13 kW diesel generator, 89 battery strings, and 12.3 kW converters.
Location: Kanyakumari
Configuration: PV/Wind/Diesel/Battery
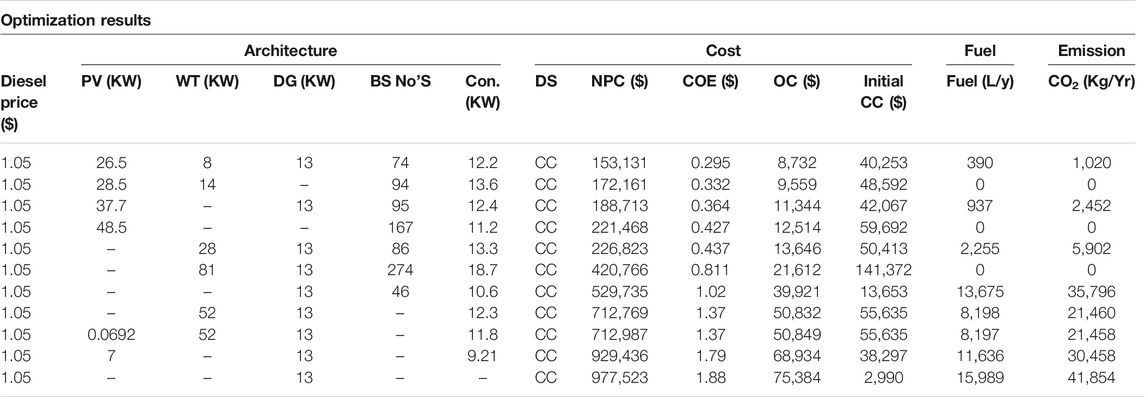
The optimal system for Kanyakumari consists of a 26.5 kW solar system, a wind system of 8 kW, a converter group of 12.2 kW, a diesel generator of 13 kW that consumes a total of 398 L/yr, and 74 batteries. The NPC of this system is $153,131, and the COE is 0.295 $/kWh; Table 9 provides further information on the various expenses.
The PV/wind/diesel generator/battery system presents the excess of electricity of 15,475 kWh/year (15%), with a renewable fraction of 96.7% as shown in Figure 8.
The optimization result indicates that the monthly energy growth rate from the windmill substation has steadily increased and is approximately nearly equal to solar generation. Thus, wind substations have noticed a significant part in the Kanyakumari district to meet the load demand. Also, the contribution of the diesel substation has been recorded as the lowest due to the high potential of wind. As a result, there is a decrease in NPC, COE, and prevailing carbon emission. It is revealed that wind energy is advantageous in Kanyakumari. The combination of PV/wind turbine/battery is the second optimal system with a COE of 0.332 $/kW and an NPC of $172,167, with 94 batteries connected in a series of an operating voltage level of 12 V supply. There are relatively high installation costs for WECS, and supplying the load along with a wind/battery combination is a highly expensive affair compared with alternative setups that can also include PV/diesel systems. As a result, we promote the wind/PV/diesel/battery arrangement as the best option for the chosen site.
Location: Ooty
Configuration: PV/Wind/Diesel/Battery
Ooty is a hill station in Southern India known for its cool climatic conditions, and most of the people living here are dependent on agriculture for their livelihood. People in this area enjoy the continuous daylight during the year despite the low level of solar radiation throughout the winter months. The wind speed in this region is favorable for producing limited amounts of electricity but enough to satisfy domestic demand during the dry season. It will generate electricity cheaper than other uses for power in this specific region. Based on the HOMER modeling, the best optimum approach for this location is a hybrid PV/WT/diesel generator/battery configuration, with 33.3 kW of solar, a 7 kW wind generator, a 13 kW diesel generator, 89 batteries, and a 11.3 kW power converter with a COE of 0.345 $/kW and an NPC of $178,815 as shown in Table 10. This optimal system uses 96.1% renewable energy, of which 86.5% of electricity comes from the solar source (50,917 kWh/yr) and 10.9% of electricity comes from the wind source (6,392 kWh/yr), as shown in Figure 9. The annual electricity production from the optimal hybrid system is 58,888 kWh with an excess electricity of 21.9%. The contribution of the solar PV is limited from May to September, but it is desirable for the remaining whole year. It is evident that the maximum share of load demand was fulfilled by the PV.
The wind turbine can provide the electrical power when the solar PV system is not in operation during the period of the night, cloudy, and rainy seasons. However, a diesel generator is used when wind and solar PV are not dependable enough to satisfy the demand. The integration of solar and wind systems to generate electricity is possible to fulfill the existing demand. The integration of the solar system/diesel generator/battery is the second least design with a COE of $0.361 kW/h. The wind resource at the chosen location is still poor, and operating a wind turbine is not cost-effective. From Table 10, it has also been observed that the hybrid systems of PV/WT/battery and the PV/battery system have zero emissions, which do not include diesel generators.
Location: Nagapattinam
Configuration: PV/Wind/Diesel/Battery
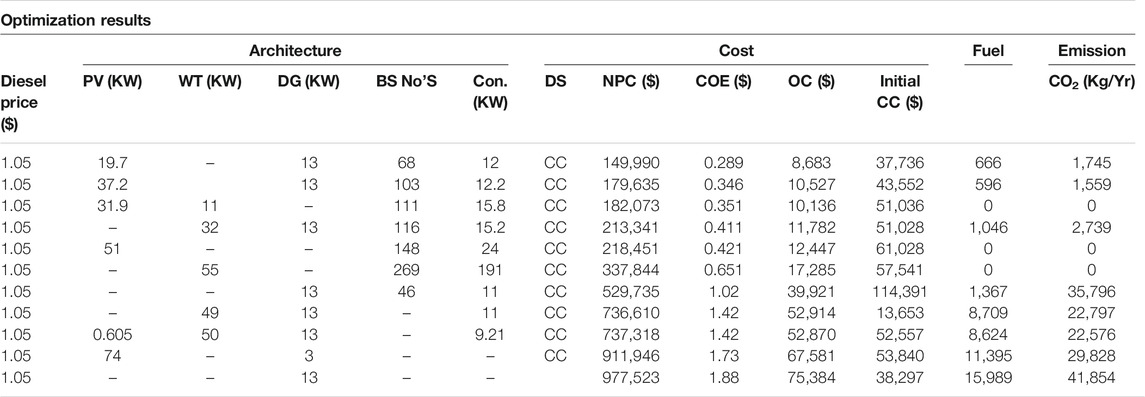
According to the results of the optimization process, the best optimum energy system comprises 19.7 kW PV modules, a wind turbine of 10 kW, a 13 kW diesel generator, a 12 kW converter, and 68 batteries. The cost of energy of the studied systems is 0.289 $/kWh, whereas the initial capital required and net present costs are 37,736 $ and 149,990 $, respectively, as shown in Table 11.
This optimal system uses 94.4% renewable fraction, in which 52.4% electricity comes from the solar source (30,584 kWh/yr) and 41.8% electricity comes from the wind source (23,536 kWh/yr), as shown in Figure 10. The results demonstrate that this area has a good solar and wind capacity, and therefore, hybridization of both PV and wind systems covers household energy needs during the year and provides a large amount of energy that can be stored in battery storage for use at peak hours of electricity. The next optimal combination consists of a PV array/diesel generator/battery/converter, and the energy cost of this hybrid system is $0.346/kWh. The solar and wind resources at the chosen location are considerably fancy in this location, and it has been observed that the hybrid systems of stand-alone PV/battery, wind/battery, and PV/WT/battery have zero emissions, which do not include diesel generators.
Location: Thoothukudi
Configuration: PV/Wind/Diesel/Battery
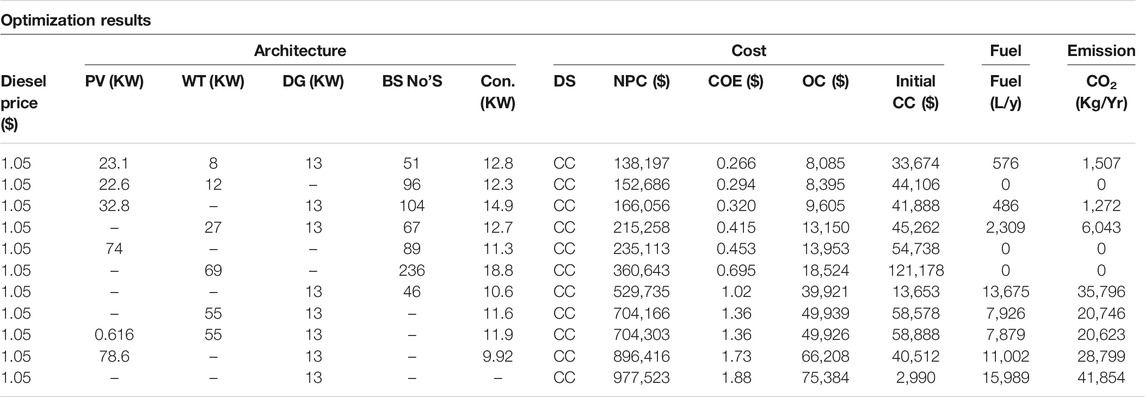
It is seen that a PV, wind, a diesel generator, and a battery hybrid system is the best economically feasible system with a minimum cost of energy of 0.266$/kWh and a minimum net present cost of $138,197, as shown in the Table 12. The hybrid system composed of a 23.1 kW PV array, an 8 kW wind system, a diesel generator with a rated power of 13 kW, and 51 storage batteries in addition to 12.8 kW converters is found to be the most feasible system. The total NPC for the stand-alone diesel system is $977523, which is a 607.34% increase compared to the PV/wind/diesel generator/battery configuration.
The simulation result recommends that this system has a renewable fraction of 95.2% and enough to fulfill the total load demand of 40,150 kWh/yr with an excess of electricity 25.8%, as shown in Figure 11. Solar and wind power is regarded as a significant renewable source in this region, and these hybrid setups have the lowest electricity cost compared to other possible wind-free configurations. The second best optimal combination comprised a 22.6 kW PV array, a 12 kW wind system, and 96 batteries with a total net present cost of $152,686, a cost of energy of $0.294/kWh, and an operating cost of $8,395 per year. However, the cost of electricity is slightly higher when compared to that of the PV/WT/battery/converter, but the amount of emissions produced is 0.
Comparison of the Optimal Hybrid System (PV/WT/DG/Battery) Among all Sites
The results of the combination (PV/WT/diesel generator/battery) compared with all possible configurations were found to be minimum NPC with a lower COE and fulfill the energy demand needed in the area of analysis. The comparative performance of the off-grid connected solar PV/wind/battery hybrid system among all the selected cities is presented in this section. Technical and economical aspects along with power generation are compared for the proposed study, and pollutant emissions are then included in study areas.
Power Generation by Various Sources
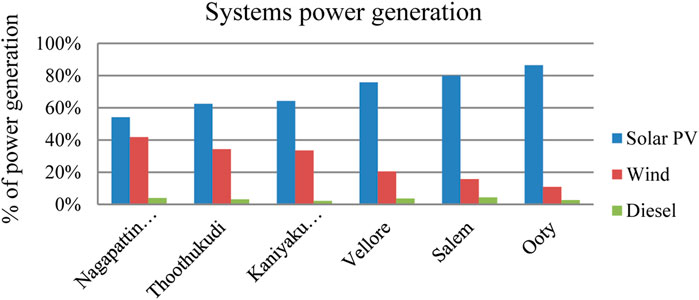
The percent of renewable energy generated in kWh/yr is represented in Figure 12. The annual output of solar power in the town of Ooty accounts for around 86.5% of the total generated energy. In Nagapattinam, the lowest solar generation is 54.2%, which shows that the Nagapattinam site demand is fulfilled by the vast majority of the wind output. Solar and wind systems are in contrast to diesel systems the most favored source of energy for the entire power generation. This is attributed to strong solar radiation and wind speed at all.
Economic Analysis
This study reveals that the stand-alone PV/wind/diesel generator/battery system has provided the lowest NPC between the different setups. The outcome indicates that a strong correlation exists between NPC and solar radiation and wind speed. The reality is that the output from PV/wind supply has been increased because of high irradiance and wind speed, and this limits the working hours of the diesel generator. It contributes to a decreased diesel usage and diesel cost, which is thereby directly linked to low NPC. For a diesel price of 1.05, the economic analysis of the feasible system configurations in the selected sites is shown in Figure 13. It is estimated based on the projected life of 25 years for the entire design. For a diesel price of 1.05, the lowest NPC is $138,191 and the COE is $0.266/kWh, which is obtained for Thoothukudi, located in the southern region. The wind system has met the demand because of the high wind speed relative to other areas, which in turn decreases the NPC system. However, for Ooty, NPC and COE have the highest value as $178,815 and COE $0.345/kWh, respectively.
Emission Analysis
The primary source of energy is the diesel power plant at the chosen remote locations. As a result, the diesel power sector remains the most common cause of CO2 emissions. The annual emissions of CO2 are closely proportional to the number of liters of fuel consumed each year by the diesel engine. Figure 14 shows the amount of carbon dioxide emissions in kg/yr that can be minimized when considering the green hybrid method. Only from the diesel system, the annual CO2 emission of 41854 kg/yr is produced, which proves that the renewable system has a sustainable contribution to reduce CO2 emissions. The effectiveness of the hybrid renewable system in the Kanyakumari city has reduced CO2 emissions by almost 63%, equivalent to 1,020 kg/yr and subsequent to Ooty and Thoothukudi, respectively, as seen from the figure. A combination of ash, soot, and liquid droplets is particulate matter. The particulate matter emission factor of the generator is the amount of particulate matter emitted by the generator per unit of fuel consumed. The amount of particulate matter (PM) generated by the diesel system depends on its output, type of utilizing fuel, and operating strategy. It tends to cause respiratory issues and induces haze in the atmosphere. By incorporating green energy into the system, one can lower the percentage of pollutant emission. Hence, inclusions such as PV and wind renewable energy resources in the existing diesel system would be economically viable alternatives for providing electricity to the selected remote rural areas. Also, this hybrid renewable configuration would therefore help to reduce the incidence of global warming arising from the emission of greenhouse gases into the atmosphere.
Sensitive Analysis
It is vital to examine the effect of variation of certain variables on the output performance of the system. Hence, sensitivity analysis has been carried out, following the simulation and optimization process to the best location (Thoothukudi) among the selected sites. This study examines the effect of diesel fuel cost, intermittent nature of solar and wind, and nominal discount rate, and the scaled average load per day for sensitive analysis was determined for the values listed in Table 13.
The typical wind speed ranges have been selected from 5.5 m/s to 7.5 m/s, while the levels of solar radiation are from 4.5 kWh/m2/day to 7 kWh/m2/day. As shown in Figure 15, each value of annual average solar radiation and wind speed is plotted on the x-axis and y-axis, respectively, and NPC of the optimal hybrid PV/Wind/diesel generator/battery system is plotted on the surface plot superimposed with COE. The graph reveals that as solar radiation increases, the COE declines from $0.290/kWh to $0.248/kWh (at a 6.45 m/s wind speed), whereas the NPC value falls from around $150623 to $128540. To the variation in the range of wind speed from 5.00 m/s to 7.00 m/s (at solar radiation of 5.56 kWh/m2/day solar radiation), the results show that there is a decrement in COE from $0.292/kWh to $0.246/kWh, and also, NPC lowers from $151335 to $127683. It has been economically viable as the NPC and COE values of the optimal system decrease with the increment in the levels of solar radiation and wind speed.
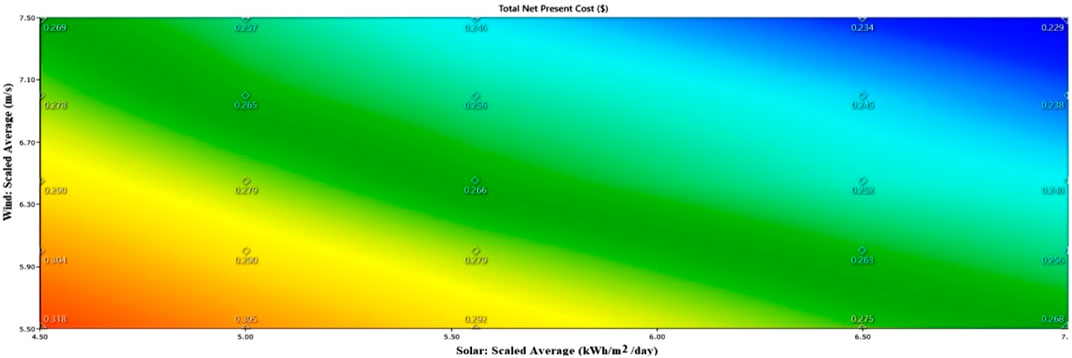
FIGURE 15. Sensitivity analysis: solar radiation vs. wind speed. Surface plot: NPC, superimposed: COE.
Figure 16 shows the impact of nominal discount rate and scaled annual average electric load on the optimal system type for a lifetime project of 25 years. For constant solar radiation and wind speed, the annual average electric loads are entered from 110 to 270 kWh/day, and the values of NDR are set from 8 to 10%. For all the considered cases, the PV/WT/diesel generator/battery hybrid system is the most preferred system.

FIGURE 16. Optimal system type: scaled annual average electric load vs. NDR at a project lifetime of 25 years; superimposed: COE.
In Figure 17 incremental diesel prices are entered in the x-axis, and wind speed is taken along the y-axis, with percentage of the excess electrical power superimposed with the CO2 emissions surface plot for the hybrid PV/wind/diesel generator/battery system. From the plot, the lowest CO2 emission has been obtained at 31% of excess electrical power.
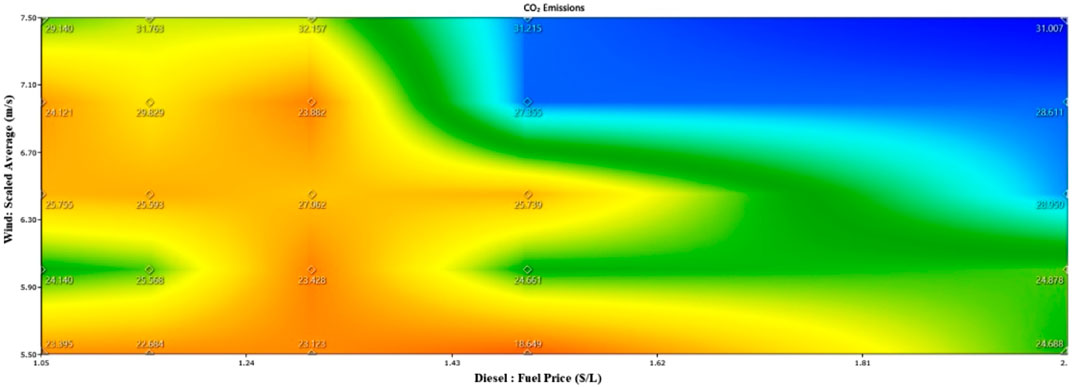
FIGURE 17. Sensitivity analysis: diesel fuel price vs. wind speed. Surface plot: CO2 emission; superimposed: % of excess electrical power.
Furthermore, Figure 18 represents the maximum renewable fraction of around 98–99%, obtained at 28% of excess electricity, for the plot of diesel price placed on the x-axis and solar radiation on the y-axis (at a solar radiation of 6.45 kWh/m2/day). Therefore, from the sensitivity analysis, it has been concluded for the Thoothukudi location that the hybrid PV/wind/diesel generator/battery system is cost-effective in comparison to the diesel generator systems due to the high potential of solar and wind resources.
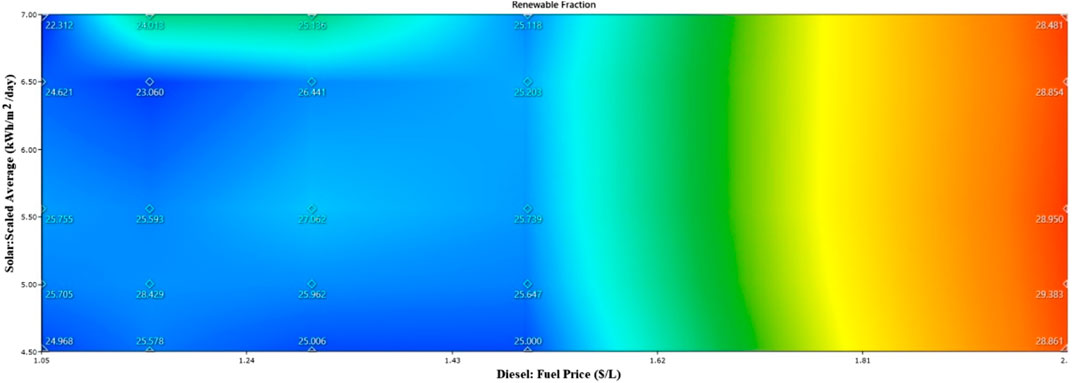
FIGURE 18. Sensitivity analysis: diesel fuel price vs. solar radiation. Surface plot: renewable fraction; superimposed: % of excess electrical power.
Conclusion
This research has put studies on the techno-economic viability of the off-grid integrated HRES system in six different areas of Tamil Nadu, India. According to the available potential of solar PV and wind, simulation results of all the selected sites have been concluded as the diesel-only system provides electricity with the largest net cost of energy ($1.88/kWh) and emits 58,362 kg of CO2 per year, which would create a detrimental impact on the atmosphere. Effects of the simulation for a windmill-related configuration have tended to be more cost-efficient and effective choices than the base case for NPC simulation. The PV/wind/diesel/battery hybrid system setup is deemed as most suitable for concerning load and installations at all locations. Thus, this type of hybrid power system design would depend on the green energy potential efficiency at all the sites to satisfy its load. This configuration has the lowest NPC and COE of all the sites considered. It is interesting to mention that Thoothukudi in India has a relatively low NPC and COE as compared to other sites considered because of the high solar and wind energy efficiency. This configuration has more than half of the overall electricity output of the system from the solar and wind turbines. As the selected locations have a lot of wind and solar resources, it is good to incorporate renewable energy systems to stand-alone diesel power supply systems to enhance the remote community’s life. Combining solar, wind, and diesel power is more efficient and eliminates reliance on one form of energy, and the size of battery capacity is often minimized. It is observed that the designs of hybrid systems provide stronger NPC outcomes relative to the base case result in all the six zones. Also, it would help in the future to achieve the maximum renewable output, in turn ultimately minimizing diesel usage and overall CO2 production. With system resilience and simplicity of operation considering, off-grid technologies for rural electrification are increasingly attractive. In addition, the overall NPC and COE as well as diesel usage are reduced considerably by the hybrid system. The optimum hybrid system also lowers the amount of fuel required for the diesel system, therefore lowering the greenhouse effect on the environment. They are also suggested in comparison to stand-alone diesel systems for environmental friendliness. Moreover, it costs considerably more to utilize the stand-alone diesel systems in distant locations far from the grid since diesel fuel costs increase daily. Finally, it has also become clear that the PV/wind/diesel systems with batteries may be widely used in distant regions with no power network access to replace or enhance current stand-alone diesel systems. The results of this study are extremely important for policymakers and investors as a reference for investment in renewable energy systems across chosen areas. Government incentives and tariff discounts would promote the usage of hybrid systems in Tamil Nadu to improve the potential of renewable energy sources for making a greater contribution to the total energy mix and also to fight poverty on fossil fuels and to foster CO2 pollution control on the environment.
Data Availability Statement
The original contributions presented in the study are included in the article/Supplementary Material, and further inquiries can be directed to the corresponding author.
Author Contributions
TM contributed to the conception and design of the study.
Conflict of Interest
The authors declare that the research was conducted in the absence of any commercial or financial relationships that could be construed as a potential conflict of interest.
Publisher’s Note
All claims expressed in this article are solely those of the authors and do not necessarily represent those of their affiliated organizations or those of the publisher, the editors, and the reviewers. Any product that may be evaluated in this article or claim that may be made by its manufacturer is not guaranteed or endorsed by the publisher.
References
All India installed capacity (2020). All India Installed Capacity. [Online]. Available at: https://cea.nic.in/old/reports/monthly/installedcapacity/2020/installed_capacity-11.pdf.
Ani, V. A., and Abubakar, B. (2015). Feasibility Analysis and Simulation of Integrated Renewable Energy System for Power Generation: A Hypothetical Study of Rural Health Clinic. J. Energ. 2015, 802036. doi:10.1155/2015/802036
Baruah, A., Basub, M., and Amuleya, D. (2021). Modeling of an Autonomous Hybrid Renewable Energy System for Electrification of a Township: A Case Study for Sikkim, India. Renew. Sustain. Energ. Rev. 135, 110158. doi:10.1016/j.rser.2020.110158
Center for climate and energy solutions (2020). Center for Climate and Energy Solutions. [Online]. Available at: https://www.c2es.org/content/renewable-energy/(Accessed October 2, 2020).
Chua, S. C., and Oh, T. H. (2010). Review on Malaysia's National Energy Developments: Key Policies, Agencies, Programmes and International Involvements. Renew. Sustain. Energ. Rev. 14 (9), 2916–2925. doi:10.1016/j.rser.2010.07.031
Closing the Energy Access Gap (2020). Closing the Energy Access Gap: Sustainably Addressing Energy Poverty. [Online]. Available at: https://www.theworldmind.org/home/2019/3/1/closing-the-energyaccess-gap-sustainably-addressing-energy-poverty (Accessed October 2, 2020).
Coal Kills Health Impacts of Air Pollution from India’s Coal Power Expansion (2020). Coal Kills Health Impacts of Air Pollution from India’s Coal Power Expansion. [Online]. Available at: http://www.indiaairquality.info/wpcontent/uploads/docs/Air%20Pollution%20from%20India%20Coal%20TPPs%20-%20LowRes.pdf (Accessed October 20, 2020).
Deb, K., and Kumar, M. (2018). “India’s Energy Demand and Supply. India Studies in Business and Economics,” in Low Carbon Pathways for Growth in India. Editors R. Kathuria, S. Ray, and K. Bandyopadhyay (Singapore: Springer), 7–13. doi:10.1007/978-981-13-0905-2_2
Dey, S., Dash, R., and Swain, S. C. (2016). “Optimal Design and Feasibility Study of Renewable Hybrid Energy Systems,” in 2016 International Conference on Emerging Trends in Engineering, Technology and Science (ICETETS) (Pudukkottai, India: IEEE). doi:10.1109/ICETETS.2016.7603083
Economic and Social Council (2019). Progress towards the Sustainable Development Goals Report of the Secretary-General, United Nations, Economic and Social Council, Special Edition, 2019 Session 26 July 2018–24 July 2019. United states: UN Chronicle.
Energy department of Tamil Nadu (2020). Energy Department of Tamil Nadu, Policy Note 2020-2021, Demand 14. [Online]. Available at: https://cms.tn.gov.in/sites/default/files/documents/energy_e_pn_2020_2021.pdf (Accessed October 10, 2020).
Environment Protection and Renewable Energy Development (2020). Environment Protection and Renewable Energy Development. [Online]. Available at: https://www.environment.tn.gov.in/epred (Accessed October 20, 2020).
Hassan, A. S., Suna, Y., and Wangb, Z. (2020). Multi-Objective for Optimal Placement and Sizing DG Units in Reducing Loss of Power and Enhancing Voltage Profile Using BPSO-SLFA. Energ. Rep. 6, 1581–1589. doi:10.1016/j.egyr.2020.06.013
Hiendro, A., Kurnianto, R., Rajagukguk, M., Simanjuntak, Y. M., and Junaidi, M. (2013). Techno-economic Analysis of Photovoltaic/wind Hybrid System for Onshore/remote Area in Indonesia. Energy 59, 652–657. doi:10.1016/j.energy.2013.06.005
HOMER (2020). HOMER Pro 3.14.HOMER Calculates Wind Turbine Power Output. [Online]. Available at: https://www.homerenergy.com/products/pro/docs/latest/how_homer_calculates_wind_turbine_power_output.html (Accessed October 23, 2020).
HOMERpro3.14 (2020a). How HOMER Calculates the Annual Real Discount Rate [Online]. Available at: https://www.homerenergy.com/products/pro/docs/latest/real_discount_rate.html (Accessed October 25, 2020).
HOMERpro3.14 (2020b). HOMER Generates Load Profiles According to Load Data. Available at: https://www.homerenergy.com/products/pro/docs/latest/load_profile_menu.html (Accessed October 2, 2020).
Kaluthanthrige, R., Rajapakse, A. D., Lamothe, C., and Mosallat, F. (2019). Optimal Sizing and Performance Evaluation of a Hybrid Renewable Energy System for an Off-Grid Power System in Northern Canada. Technol. Econ. Smart Grids Sustain. Energ. 4. doi:10.1007/s40866-019-0061-5
Karthick, A., Chinnaiyan, V. K., Karpagam, J., Chandrika, V., and Kumar, P. R. (2021). “Optimization of PV-Wind Hybrid Renewable Energy System for Health Care Buildings in Smart City,” in Hybrid Renewable Energy Systems. Editor U. Sahoo (Hoboken and Beverly: John Wiley & Sons and Scrivenger). doi:10.1002/9781119555667.ch8
Kim, C. (2013). Micro-power System Modeling Using HOMER. [Online]. Available at: http://www.mwftr.com/homer2/KT7HOMER1.pdf (Accessed October 25, 2020).
Kumar, J., Suryakiran, B. V., Verma, A., and Bhatti, T. S. (2019). Analysis of Techno-Economic Viability with Demand Response Strategy of a Grid-Connected Microgrid Model for Enhanced Rural Electrification in Uttar Pradesh State, India. Energy 178, 176–185. doi:10.1016/j.energy.2019.04.105
Kumar, S., and Manoharan, P. S. (2014). Optimization and Cost of Energy of Renewable Energy System in Health Clinic Building for a Coastal Area in Tamil Nadu, India Using Homer. J. Eng. Appl. Sci. 9, 210–216. doi:10.19026/rjaset.8.1197
Kumar, U. S., and Manoharan, P. S. (2014). Stand Alone Wind/PV/Diesel Hybrid System for Telephone Transceiver Station in Tamil Nadu Rural Areas. Int. J. Appl. Eng. Res. 9 (24), 8437–8445. doi:10.13140/RG.2.2.30483.17442
Kumar, Y. V. P., and Bhimasingu, R. (2014). “Optimal Sizing of Microgrid for an Urban Community Building in South India Using HOMER,” in 2014 IEEE International Conference on Power Electronics, Drives and Energy Systems (PEDES), Mumbai, India, December 16–19, 2014 (IEEE), 1–6. doi:10.1109/PEDES.2014.7042059
Ladide, S., El Fathi, A., Bendaoud, M., Hihi, H., and Faitah, K. (2019). Flexible Design and Assessment of a Stand-Alone Hybrid Renewable Energy System: a Case Study Marrakech, Morocco. Int. J. Renew. Energ. Res. (Ijrer) 9 (4), 2003–2022.
Laha, P., Chakraborty, B., and Østergaard, P. A. (2020). Electricity System Scenario Development of India with Import Independence in 2030. Renew. Energ. 151, 627–639. doi:10.1016/j.renene.2019.11.059
Mamaghani, A. H., Escandon, S. A. A., Najafi, B., Shirazi, A., and Rinaldi, F. (2016). Techno-Economic Feasibility of Photovoltaic, Wind, Diesel and Hybrid Electrification Systems for Off-Grid Rural Electrification in Colombia. Renew. Energ. 97 (Nov), 293–305. doi:10.1016/j.renene.2016.05.086
Mawla, M. R., and Khan, M. Z. R. (2020). “A Study on Sustainable Development Goal 7: Future Plan to Achieve the Affordable and Clean Energy-Bangladesh Perspective,” in 2020 IEEE Region 10 Symposium (TENSYMP), Region 10 Symposium (TENSYMP), June 2020 (IEEE), 421–426.
MNRE (2018). Year-End Review 2018 – MNRE, Press Information Bureau, Government of India (10-Dec-2018) [Online]. Available at: https://pib.gov.in/newsite/PrintRelease.aspx?relid=186228 (Accessed October 2, 2020).
Nandi, C., Bhattacharjee, S., and Reang, S. (2018). An Optimization Case Study of Hybrid Energy System Based Charging Station for Electric Vehicle on Mettur, Tamil Nadu. Int. J. Adv. scientific Res. Manage. 3 (11), 225–231.
Olatomiwa, L., Mekhilef, S., Huda, A. S. N., and Sanusi, K. (2015). Techno-economic analysis of hybrid PV-diesel-battery and PV-wind-diesel-battery power systems for mobile BTS: the way forward for rural development. Energy Sci Eng 3, 271–285. doi:10.1002/ese3.71
Panapakidis, I. P., Sarafianos, D. N., and Alexiadis, M. C. (2012). Comparative Analysis of Different Grid-independent Hybrid Power Generation Systems for a Residential Load. Renew. Sustain. Energ. Rev. 16 (1), 551–563. doi:10.1016/j.rser.2011.08.021
Risk Management in renewable energy and sustainability in India (2019). Risk Management in Renewable Energy and Sustainability in India. Thangaiyan, Franklin. [Online]. Available at: https://www.researchgate.net/publication/334318737_Risk_Management_in_renewable_energy_and_sustainability_in_india (Accessed October 15, 2020).
Sawle, Y., Gupta, S. C., and Bohre, A. K. (2016). PV-wind Hybrid System: A Review with Case Study. Cogent Eng. 3 (1), 1189305. doi:10.1080/23311916.2016.1189305
Sawle, Y., Gupta, S. C., and Bohre, A. K. (2017). Review of Hybrid Renewable Energy Systems with Comparative Analysis of Off-Grid Hybrid System. Renew. Sustain. Energ. Rev. 81, 2217–2235. doi:10.1016/j.rser.2017.06.033
Sawle, Y., Gupta, S. C., and Bohre, A. K. (2018). Techno-Economic Scrutiny of HRES through GA and PSO Technique, Inderscience. Int. J. Renew. Energ. Technol. 9 (1/2), 84–107. doi:10.1504/ijret.2018.090106
Sawle, Y., Gupta, S. C., and Bohre, A. K. (2018). A Novel Methodology for Scrutiny of Autonomous Hybrid Renewable Energy System. Int. J. Energ. Res 42, 570–586. doi:10.1002/er.3841
Sawle, Y., and Gupta, S. C. (2014). “Optimal Sizing of Photovoltaic/wind Hybrid Energy System for Rural Electrification,” in 2014 6th IEEE Power India International Conference (PIICON), Delhi, India, December 5–7, 2014 (IEEE), 1–4. doi:10.1109/34084poweri.2014.7117758
Sawle, Y., and Thirunavukkarasu, M. (2020). Techno-economic Comparative Assessment of an Off-Grid Off-Grid Hybrid Renewable Energy System for Electrification of Remote Area. Anal. Appl. Renew. Energ. Syst. 2020, 199. doi:10.1016/B978-0-12-824555-2.00027-7
Sen, R., and Bhattacharyya, S. C. (2014). Off-grid Electricity Generation with Renewable Energy Technologies in India: An Application of HOMER. Renew. Energ. 62, 388–398. doi:10.1016/j.renene.2013.07.028
Sinha, S., and Chandel, S. S. (2015). Prospects of Solar Photovoltaic-Micro-Wind Based Hybrid Power Systems in Western Himalayan State of Himachal Pradesh in India. Energ. Convers. Manage. 105 (Nov), 1340–1351. doi:10.1016/j.enconman.2015.08.078
Srivastava, R., and Giri, V. (2016). Optimization of Hybrid Renewable Resources Using HOMER. Int. J. Renew. Energ. Res. 6, 157–163. doi:10.1088/1755-1315/599/1/012028
Sustainable development goals (2020). Sustainable Development Goals. [Online]. Available at: https://in.one.un.org/page/sustainabledevelopment-goals/sdg-7 (Accessed October 2, 2020).
Swarnkar, N. M., Gidwani, L., and Sharma, R. (2016). “An Application of HOMER Pro in Optimization of Hybrid Energy System for Electrification of Technical institute,” in 2016 International Conference on Energy Efficient Technologies for Sustainability (ICEETS), Nagercoil, India, April 7–8, 2016 (IEEE), 56–61. doi:10.1109/ICEETS.2016.7582899
Tazay, A. (2021). Techno-Economic Feasibility Analysis of a Hybrid Renewable Energy Supply Options for University Buildings in Saudi Arabia. Open Eng. 11 (1), 39–55. doi:10.1515/eng-2021-0005
Thirunavukkarasu, M., and Sawle, Y. (2020). Design, Analysis and Optimal Sizing of Standalone PV/Diesel/Battery Hybrid Energy System Using HOMER. IOP Conf. Ser. Mater. Sci. Eng. 937, 012034. doi:10.1088/1757-899X/937/1/012034
Thirunavukkarasu, M., and Sawle, Y. (2021). “Smart Microgrid Integration and Optimization,” in the Active Electrical Distribution Network: A Smart Approach. Editors Baseem (WILEY Publishing Group), 203–234.
T. Lambert (Editor) (2006). Micropower System Modeling with Homer (Hoboken, NJ: John Wiley & Sons, Inc. EBSCOhost). doi:10.1002/0471755621.ch15
Vendoti, S., Muralidhar, M., and Kiranmayi, R. (2021). Techno-economic Analysis of Off-Grid Solar/wind/biogas/biomass/fuel Cell/battery System for Electrification in a Cluster of Villages by HOMER software/Biomass/Fuel Cell/Battery System for Electrification in a Cluster of Villages by HOMER Software. Environ. Dev. Sustain. 23 (1), 351–372. doi:10.1007/s10668-019-00583-2
Keywords: optimal sizing, hybrid renewable energy systems, photovoltaic, wind turbine, diesel generator
Citation: Thirunavukkarasu M and Sawle Y (2021) A Comparative Study of the Optimal Sizing and Management of Off-Grid Solar/Wind/Diesel and Battery Energy Systems for Remote Areas. Front. Energy Res. 9:752043. doi: 10.3389/fenrg.2021.752043
Received: 02 August 2021; Accepted: 20 September 2021;
Published: 12 November 2021.
Edited by:
K. Sudhakar, Universiti Malaysia Pahang, MalaysiaReviewed by:
Vishnupriyan Jegadeesan, Chennai Institute of Technology, IndiaDaniel Tudor Cotfas, Transilvania University of Brașov, Romania
Copyright © 2021 Thirunavukkarasu and Sawle. This is an open-access article distributed under the terms of the Creative Commons Attribution License (CC BY). The use, distribution or reproduction in other forums is permitted, provided the original author(s) and the copyright owner(s) are credited and that the original publication in this journal is cited, in accordance with accepted academic practice. No use, distribution or reproduction is permitted which does not comply with these terms.
*Correspondence: Yashwant Sawle, eWFzaHNhd2xlQGdtYWlsLmNvbQ==
 M. Thirunavukkarasu
 Yashwant Sawle

