
94% of researchers rate our articles as excellent or good
Learn more about the work of our research integrity team to safeguard the quality of each article we publish.
Find out more
ORIGINAL RESEARCH article
Front. Energy Res. , 23 September 2021
Sec. Electrochemical Energy Storage
Volume 9 - 2021 | https://doi.org/10.3389/fenrg.2021.744133
 Vinay S. Bhat1,2
 Titilope John Jayeoye3Thitima Rujiralai3Uraiwan Sirimahachai3Kwok Feng Chong4
 Gurumurthy Hegde1,5*
Carbon nanomaterials derived from Acacia auriculiformis pods as electrodes for the electrochemical double-layer capacitors were explored. Four pyrolysis temperatures were set (400, 600, 800, and 1,000°C) to understand the role of temperature in biomass pyrolysis via a possible “self-activation” mechanism for the synthesis of carbon materials. The carbon materials synthesized at 800°C (AAC800) were found to exhibit a well-organized hierarchical porous structure, quantified further from N2 adsorption/desorption isotherms with a maximum specific surface area of 736.6 m2/g. Micropores were found to be contributing toward enhancing the specific surface area. AAC800 exhibited a maximum specific capacitance of 176.7 F/g at 0.5 A/g in 6.0 M KOH electrolyte in a three-electrode setup. A symmetric supercapacitor was fabricated using AAC800 as an active material in an organic electrolyte composed of 1.0 M tetraethylammonium tetrafluoroborate (TEABF4) as a conducting salt in the acetonitrile (ACN) solvent. The self-discharge of the cell/device was analyzed from fitting two different mathematical models; the cell also exhibited a remarkable coulombic efficiency of 100% over 10,000 charge/discharge cycles, retaining ∼93% capacitance at 2.3 V.
The increased demand of electrical energy for portable devices and other similar appliances has influenced researchers around the globe to synthesize, tailor, and design materials and systems which can provide an alternative energy solution. With dwindling fossil fuel sources, wind and solar energy with abundant availability appear to be attractive energy sources for the future. However, the practical difficulties limit energy generation and usage. Electrochemical technologies like fuel cells, batteries, and various forms of electrochemical capacitors are able to store and generate energy and could provide a reliable alternative to fossil fuels (Fu et al., 2019). Fuel cells, although an attractive option, are clouded by commercial viability and safety issues. Only Li-ion-based batteries are able to provide some alternatives to fossil fuels at the moment. Reliability and ease of fabrication have contributed to popularity and widespread use of Li batteries (Liu J. et al., 2018; Gür, 2018). The technology however is not perfect as usage of Li ions increases the cost of batteries and also comes with inherent problems such as dendrite formation, sluggish electrode kinetics, a moderate power density, cyclability, and disposal issues. Electrochemical double-layer capacitors (EDLCs, also called supercapacitors) do not suffer from the issues with which batteries face and provide a high power density, characterized by the absence of secondary reactions, ultrafast charging (from seconds to a few minutes), longer charge/discharge cycles, and wider options on usage of electrolytes (Simon et al., 2014). The electrostatic mechanism of charge storage which is responsible for the positive effects is also responsible for the negative effect, causing a low energy density. However, the EDLCs can complement batteries in a hybrid energy system, reducing load on batteries. Combining the high energy density of batteries and the high-power supercapacitor density to achieve a perfect energy mix is the goal. With this context, developing novel electrode materials and electrolytes has gained tremendous research traction globally (Liu C. et al., 2018; Jing et al., 2018; Miller, 2018).
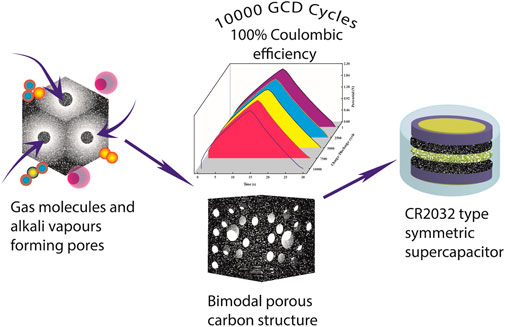
GRAPHICAL ABSTRACT
Porous activated carbons (PACs) are a popular choice for electrodes in supercapacitors owing to their cost-effectiveness and abundance. There are several techniques by which PACs are synthesized. The generally involved procedure includes two steps; one involves carbonization of the precursor and the other involves activation of the carbon residue by physical (steam, CO2 treatment) and/or chemical treatments (KOH, H3PO4, ZnCl2, etc.) (Bhat et al., 2019; K P et al., 2020). Producing hierarchical porous structures (micropores–mesopores) with a high surface area is beneficial for electrochemical applications (Borchardt et al., 2014; Bhat et al., 2020c). In the present work, we have used Acacia auriculiformis pods as the biomass precursor for the synthesis of PACs. This serves two purposes: cost-effective synthesis of PACs and value addition to the waste biomass which is available in plenty. Herein, we have demonstrated the synthesis of PACs by pyrolysis in a single step without the aid of any external activating agents. The effect of temperature was utilized to prepare self-activated PACs. Self-activated PACs synthesized at 800°C exhibited an organized bimodal/hierarchical porous structure with a maximum surface area of ∼736.6 m2/g. The obtained nanocarbons were tested for their electrochemical behavior. A symmetric supercapacitor of the CR2032 type was fabricated using tetraethylammonium tetrafluoroborate (TEABF4) as a conducting salt in the acetonitrile (ACN) solvent as the electrolyte. Usage of an organic solvent helps in widening the potential window which is unlikely in aqueous systems (2.7 V). This increased operating voltage significantly improves both the energy density and power density. The results demonstrate the possibility of commercial viability of the current work.
The Acacia auriculiformis pods were collected from Hat Yai, Songkhla, Thailand. The pods were crushed and grinded to fine powder. A vibratory sieve shaker (Aimil, India) consisting of a 60 µm mesh was used to sieve the powder. ∼8 g of the sieved powder was carbonized in the inert atmosphere (N2) inside a quartz tube furnace (Nopo Nanotechnologies, India) at 400, 600, 800, and 1,000°C for 1 hour. A more detailed synthesis procedure for the bimodal porous nanocarbons can be found in our earlier works (Kumar et al., 2014; Hegde et al., 2015; Supriya et al., 2019; Bhat et al., 2020b; Bhat et al., 2021). The final carbon residues were labeled as AAC400, AAC600, AAC800, and AAC1000, with each representing the temperature at which they were synthesized.
The obtained AACs were characterized by different techniques. The elemental composition of AACs was analyzed by energy-dispersive X-ray spectroscopy (EDS, X Max 80, Oxford Instrument, United Kingdom). The morphology and particle size were determined using field emission scanning electron spectroscopy (FESEM, SEM microscope, Apreo, FEI, Czech Republic) and transmission electron microscopy (TEM; JEOL JEM-2010, Japan); X-ray diffraction (XRD) patterns were recorded using an Empyrean XRD diffractometer (Empyrean, Netherland) in a 2θ range from 10 to 80°; Raman spectroscopy plots were obtained using a Raman microscope spectrometer (RAMANforce, Nanophoton, Japan); Fourier transform infrared spectroscopy (FTIR) was used to find the functional groups present (Perkin Elmer spectrum BX) using the KBr method; further, the thermogravimetric analysis (TGA) of the raw material and the carbonized product was conducted by heating them from 50 to 1,000°C at 10°C/min under a N2 atmosphere using a Perkin Elmer, USA TGA 7. The surface properties of AACs were investigated by N2 gas adsorption–desorption isotherms (ASAP2460, Micromimetics, United States). Specific surface area (SSA) was calculated by the Brunauer−Emmett−Teller (BET) method. The micropore SSA and pore volume was determined from the t-plot method. Pore size was calculated using the Barrett−Joyner−Halenda (BJH) model. The chemical composition of the sample surface was investigated using an X-ray photoelectron spectrometer (XPS; AXIS ULTRADLD, Kratos analytical, Manchester, United Kingdom). The base pressure in the XPS analysis chamber was about 5 × 10⁻⁹ torr. The samples were excited with the X-ray hybrid mode and a 700 × 300 μm spot area with a monochromatic Al Kα1,2 radiation at 1.4 keV. The X-ray anode was run at 15 kV, 10 mA, and 150 W. The photoelectrons were detected with a hemispherical analyzer positioned at an angle of 90o with respect to the normal to the sample surface.
The working electrodes were prepared by pasting a homogenized slurry of AACs, carbon black, and polyvinylidene difluoride (PVDF) (90, 5, and 5% ratios, respectively) in the N-methyl-2-pyrrolidone (NMP) solvent onto both sides of a precleaned 1 × 1 cm2 nickel foam substrate. These were later dried overnight at 80°C and pressed under a pressure of 100 kg/cm2 with a mass loading of ∼4 mg. The electrochemical studies were performed in 6.0 M KOH electrolyte using a three-electrode system. A platinum rod was employed as the counter electrode, and a saturated calomel electrode was used as the reference electrode. A symmetric supercapacitor of the CR2032-type coin cell was made using AAC800 as the active material by an identical mass loading (∼6 mg) on both the cathode and anode. They were separated by Whatman® glass microfiber filters (GF/D) using 1.0 M tetraethylammonium tetrafluoroborate (TEABF4) in the acetonitrile (ACN) solvent as the electrolyte.
Electrochemical analysis was done in an electrochemical workstation (AUTOLAB M204, Netherlands). Cyclic voltammetry (CV) experiments for the three-electrode system were conducted in the potential window of 0 to -1 V at different scan rates ranging from 10 to 100 mV/s. Constant current galvanostatic charge discharge (GCD) tests were done at varying current densities from 0.1 to 10.0 A/g. CV analysis was done for the CR2032 cell in the potential window of 0–2.7 V. Scan rates in the range of 5–100 mV/s were used to assess the CV response. GCD tests were performed under different current densities (0.1–5 A/g) under different potential windows (0–2.3 V). For this two-electrode system, the gravimetric specific capacitance (C) of a single electrode was calculated by the equation (Zhang et al., 2018):
where I is the discharge current (A), Δt is the discharge time (s), ΔV is the voltage difference (V) within Δt, and m is the mass loading of the active material AAC800 in each of the working electrodes (g). For the three-electrode system, gravimetric specific capacitance (C) can be calculated using the equation
where I is the discharge current (A), Δt is the discharge time (s), ΔV is the voltage difference (V), and m is the mass loading of the active material (AACs). Electrochemical impedance of the system was analyzed from 100 kHz to 0.01 Hz at an AC current amplitude of 10 mV at the open-circuit potential (OCP). The real (C′) and imaginary (C″) capacitances of the frequency response analysis were calculated using the equations reported in earlier work (Zhang et al., 2018). The energy density (E) and power density (P) are calculated by using the equations
Carbonization temperature was found to have a significant influence on the synthesis of bimodal/hierarchical porous carbon structures. The size of nanocarbon aggregates reduced with an increase in pyrolysis temperature. The “self-activation” technique involves no usage of additional steps or external activating agents such as CO2, steam, KOH, ZnCl2, etc. It is postulated in earlier research that when the lignocellulosic material decomposes, volatile gases escape from the bioframework; while doing so, they create channels and pores in the matrix (Bommier et al., 2015; Bhat et al., 2021; Sun et al., 2017). Below 600°C, a variety of volatile gases are released from the pyrolysis of lignocellulosic biomass, that is, when a significant quantity of weight loss happens in the sample (which can be seen from TGA plot of the biomass precursor in Figure 3E). Above 600°C, carbonization of biomass yields smaller non-condensable gases such as H2O, H2, CO2, and CO (Chhiti et al., 2012). At higher temperatures, the following ‘self-activation’ reactions might be possible (Bommier et al., 2015):
Removal of residual H2 and O2 molecules might result in evolution of H2O (g), which might act as an activating agent mimicking the mechanism of physical activation using steam. This consumes carbon formed from pyrolysis, resulting in generation of the non-condensable gases CO and H2 as depicted in reaction (i). This interaction involving consumption of C by H2O could induce porous structures within the carbon matrix. Also, the Gibbs free energy for reaction (i) turns negative, making the process a spontaneous reaction above 700°C. Similarly, reaction (ii) is another possible way of carbon activation which mimics the external activation process involving CO2. H2 evolved during (i) might also initiate another possible activation process
Although there are possibilities of all reactions (i–iii) participating in self-activation, reaction (i) might appear to be a dominant reaction responsible for activation owing to Gibbs spontaneous reaction. However, this can be possible when very low flow rates are used so that activation molecules, like H2O, remain in the tube furnace for a longer time, increasing possibility of the reaction (i). However, we employed a moderately higher N2 flow rate eliminating domination of reaction (i), and hence, buildup of H2 was avoided. Biomass contains potassium, which forms vapors above 760°C and which also helps in forming channels and pores when biomass is carbonized. The schematic illustration of the self-activation process is also shown in Figure 1. Thus, the applied temperature and pressure generated at this stage are sufficient to “activate” and form bimodal/hierarchical porous carbons without the aid of any other external agents. When the temperature is increased to 1,000°C, the high temperature may result in collapse of porous networks and structures.
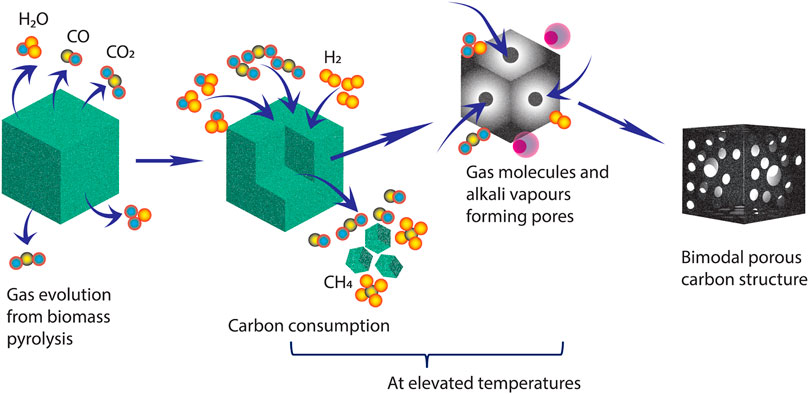
FIGURE 1. Schematic illustration of the possible mechanism for the formation of a porous carbon structure via self-activation.
Microscopic techniques such as FESEM and TEM were utilized to establish the morphology of AACs. Figure 2 depicts the morphology of the AACs. AAC400 does not show any particular morphology and appears to be an aggregated carbon mass (Figure 2A). AAC600 shows the formation of cubes and spherical aggregates along with the formation of pores (Figure 2B). At 800°C, we observed a more homogeneous distribution of spherical and cubic carbon aggregates along with interconnected well-developed porosity and channels (Figure 2C). As expected, AAC1000 did not exhibit any developed structures (Figure 2D), which could be attributed to collapse of the porous structure at elevated temperatures. As expected from the pyrolysis method, the products obtained were not hollow but solid masses. Further, the materials were analyzed using TEM (Supplementary Figure S1), which again confirms the formation of spherical and cubic carbon aggregates of carbon residues. This formation of aggregates can be ascribed to the high reaction time and longer cooling temperatures while there was carbonization. The average particle size was determined from TEM images and is depicted in Figure 2E. Temperature appears to play a major role in obtaining particles with a smaller size. As the carbonization temperature was increased, the average particle size decreased from 81 nm for AAC400 to 14 nm for AAC1000.
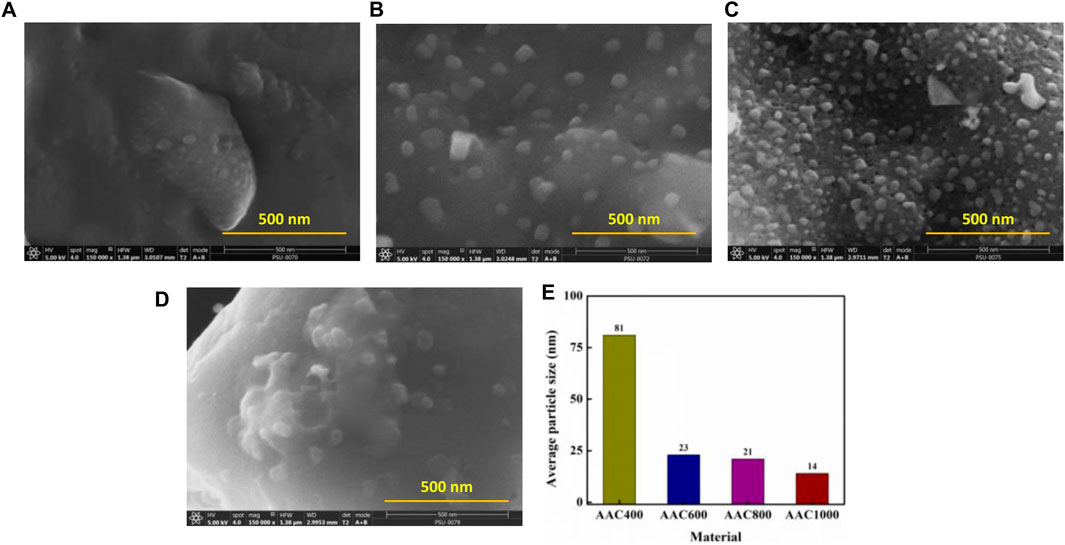
FIGURE 2. FESEM images of AAC400 (A), AAC600 (B), AAC800 (C), and AAC1000 (D). Average particle size of AACs obtained from TEM analysis (E).
The elemental composition of the AACs was obtained from SEM coupled with EDS. A representative plot is shown in Figure 3A using the elemental composition of AAC800. The table inset in Figure 3A quantifies the elements. The material is carbonaceous with 87% carbon and ∼9.5% of oxygen, with the rest being K and Ca. EDS spectra for all the AACs were recorded and are depicted in Supplementary Figure S2.
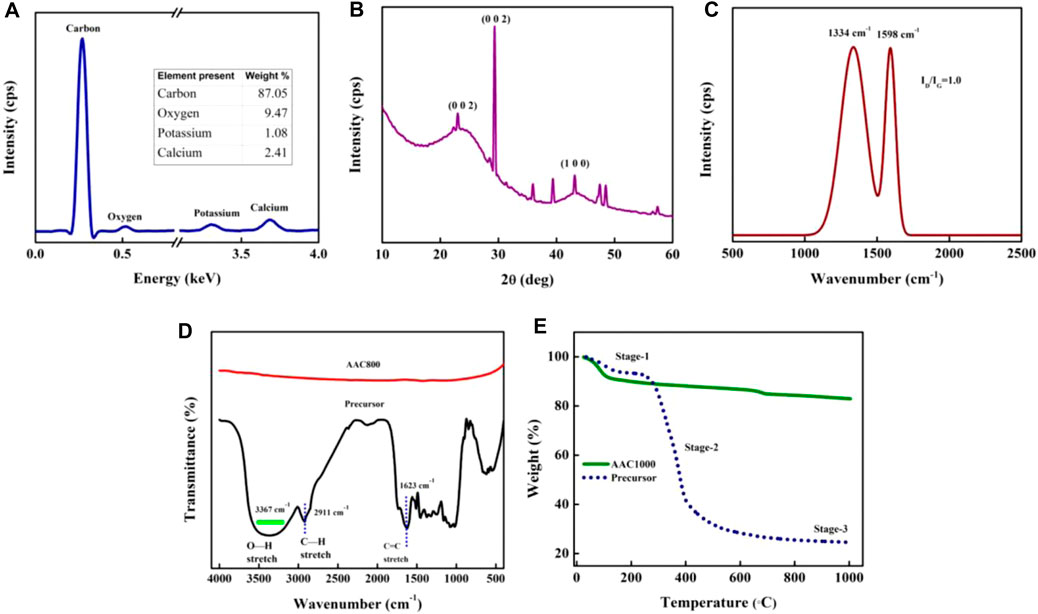
FIGURE 3. EDS spectrum (A), XRD plot (B), and Raman spectrum (C) of AAC800, FTIR spectrum of the precursor and AAC800 (D), and TGA plot of the precursor and AAC1000 (E).
Further, the structural elucidation of AACs was done by XRD and Raman spectroscopy. The XRD plot (Figure 3B) is typical of turbostratic carbon, which is intermediatory between those of amorphous and crystalline carbon. A stacking order (ABAB….) which is present in hexagonal graphite is absent in turbostratic carbon. Graphene layers are randomly present in the matrix (Li et al., 2007). A hump centered within the range of ∼23–25° corresponds to the well-established 002 plane in amorphous carbons, while a sharp peak at ∼29° indicates the graphitic diffraction peak corresponding to the 002 interlayer spacing (Drewniak et al., 2016). This indicates that the material has some short-range order. However, the temperature is not sufficient enough to transform into crystalline graphite, where a long-range order is established and one can see a periodic repetitive pattern. Further, a hump centered at ∼43° corresponds to the 100 plane of carbon and confirms the amorphous nature of AAC800. Gradual transformation of the material from amorphous to crystalline happens with elevation in synthesis temperature. Hence, we can observe both amorphous and crystalline peaks coexisting. The minor peaks observed after ∼30° correspond to CaCO3. XRD patterns of all the prepared AACs can be seen from Supplementary Figure S3, which establishes gradual changes in crystalline nature. Raman spectra furthermore provide insight into the structural and electronic properties about the carbon material. Figure 3C gives the representative Raman spectrum of AAC800 obtained after Gaussian peak fitting (R2 = 0.96), while the spectra for all the synthesized AACs are provided in Supplementary Figure S4. Raman spectra of all the carbon samples exhibit two major peaks identified as bands. The G-band (∼1,598 cm−1) could be ascribed to C―C in-plane vibrations. This band is prominently exhibited by graphene and sp2 carbon allotropes as well. The D-band (∼1,334 cm−1) is due to disordered carbons, which could be assigned to the breathing vibrations in the hexagonal carbon lattice. This particular mode is Raman-active only in the presence of defects or disorder, and hence, the ratio of D-band and G-band intensities (ID/IG) is used to represent the level of defects in carbon materials (Ferrari and Robertson, 2000; Ferrari and Basko, 2013). ID/IG values are also listed inTable 2. From Supplementary Figure S4, it is evident that both D- and G-bands shift toward left and right with an increase in pyrolysis temperature. Contrary to the general assumption of getting more ordered carbons with increased pyrolysis temperature, we observed an increase in ID/IG ratio from AAC400 to AAC1000. This could be due to disordered graphitic carbon particles. As the temperature was increased, the semicrystalline structures were exposed to strain, which could be relieved by fracturing crystallites causing disorder. Similar observations were also reported earlier (Snowdon et al., 2014; Supriya et al., 2019).
FTIR was performed to identify the presence of functional groups in AACs. Figure 3D compares FTIR spectra of the precursor and AAC800. The precursor being biomass contains many IR-active functional groups such as ―OH, ―C=O, C=C, etc., when the precursor is carbonized at 800°C; most of the volatile molecules are removed and only the carbon residue is left, and hence, we do not see any major vibration and stretching patterns of functional moieties. Nevertheless, AAC800 does show O―H bending at 1,425 cm−1 and a weak broad peak at 3,303 cm−1, which correspond to O―H stretching vibrations (Bhat et al., 2020a). FTIR spectra of all the synthesized materials are depicted in Supplementary Figure S5. AAC400 and AAC600 due to retainment of some biocomponents do show enhanced response, while AAC800 and AAC1000 do not exhibit any major functional groups in the IR-active form.
The TGA plot shows the thermal decomposition pattern of materials. Figure 3E compares the precursor and AAC1000 as a representative material for TGA analysis. It is well known that biomass contains mainly hemicellulose, cellulose, and lignin along with traces of vitamins and extractives. Generally, decomposition of the biomass precursor happens via a series of complex reactions. We maintained a low heating rate (<100°C/min) so that decomposition of biomaterials can be described via stages. In the first stage, up to ∼250°C, weight loss is due to moisture evolution and hemicellulose decomposition. Stage 2 marks the majority weight loss in biomass up to ∼400°C, which is due to decomposition of cellulose and partial pyrolysis of lignin. Most of the volatile components are removed as gaseous molecules at this stage. Above ∼400°C (stage 3), the weight loss becomes only gradual and becomes minimal and can be ascribed to lignin pyrolysis (Yang et al., 2006). An ∼24% yield can be expected when the precursor is subjected to carbonization at 1,000°C. AAC1000 was used as a representative material to check the thermal stability of AACs. As can be seen from the plot, AAC1000 remains stable with no significant weight loss except up to 150°C, which could be due to moisture evolution and removal of residual volatiles.
XPS analysis provides information regarding ionization energies of elements in the sample, and hence, it is a useful tool to determine elemental composition, doping, defects, etc. Figure 4A shows the XPS survey scan of AAC800 with major peaks centered around ∼531, 347, 293, and 284 eV, corresponding to O 1s, Ca 2p, K 2p, and C 1s, respectively. Table 1 provides quantified data about the concentration of individual elements present in AAC800. Both EDS and XPS results corroborate well regarding the elemental composition. The C 1s peak was deconvoluted into five subpeaks (Figure 4B) with the major peak centered at ∼285 eV corresponding to the sp3 C―C group. Two minor subpeaks are centered at ∼283.3 and ∼284, corresponding to the sp2 C=C moeity. Another two subpeaks are centered at ∼285.9 and ∼286.8 eV, which could be assigned to the presence of O―C=O and C―O―C functional groups, respectively. Similar to C 1s, the O 1s peak was deconvoluted into four subpeaks (Figure 4C) with a dominating ―C―O moeity centered at ∼531.9 eV. Other three subpeaks are centered at ∼534.6, 533.1, and 530.5 eV, corresponding to C―O―C, ―OH, and ―C=O groups, respectively (Kwan et al., 2015). The presence of such functional groups enhances the specific capacitance by providing access to more electrochemical surface area in electrodes.

FIGURE 4. XPS survey spectra of AAC800 (A), deconvoluted C 1s (B), and O 1s spectrum (C).
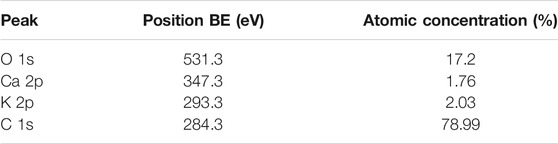
TABLE 1. Quantified elemental composition from XPS for AAC800.
N2 adsorption/desorption isotherms are displayed in the graphical form with the amount of gas adsorbed (mol/g) plotted against equilibrium relative pressure (p/po). Figure 5A depicts the isotherm of AAC800, while those of all AACs are shown in Supplementary Figure S6. From the isotherms, it can be seen that AACs exhibit the type IV physisorption isotherm according to IUPAC recommendations (Thommes et al., 2015). Type IVa is characterized by condensation, followed by a hysteresis loop. All the AACs exhibit the H4 hysteresis loop, associated with filling of micropores. H4 loops are characterized by the presence of hierarchical microporous–mesoporous carbons. The BET method was used to evaluate the surface area of porous carbons. SSA was found to increase from AAC400 to AAC800, reaching a maximum of 736.6 m2/g, and decreased to 22.1 m2/g for AAC1000. Similarly, the pore volume was also found to follow the same trend as SSA, reaching a maximum of 0.389 cm3/g for AAC800. SSA and pore volume variation with AAC pyrolysis temperature is plotted in Figure 5B The t-plot method was employed to find the micropore and mesopore SSA and pore volume of AACs. The micropore and mesopore SSA contribution toward total surface area among AACs is depicted in Figure 5C. All the porosity values for AACs are also tabulated in Table 2. The micropore surface area contribution toward total surface area was found to be 41.3% for AAC400 and increased to 84.1% in AAC800. Further, for the AAC1000 micropore, SSA decreases to 20%. This can be attributed to development of hierarchical porous structures as the temperature was increased up to 800°C. It has been shown that materials with a high surface area possess a higher concentration of micropores. AAC800 with a large number of micropores contributes toward a higher SSA. At 1,000°C however, due to high pressure and temperature, the porous structures may collapse, leading to a decrease in micropore surface area and hence a lower total SSA. The self-activation mechanism may be the reason for the formation of micropores and hence the enhanced SSA for AAC800 (Bhat et al., 2021). On a similar note, micropore and mesopore volume contribution toward total pore volume among AACs is depicted in Figure 5D. Mesopores contribute almost entirely with 96.4% toward total pore volume in AAC400, while it decreases to 38% in AAC800. Collapse of micropores in AAC1000 causes an increase in mesopore contribution (96%). The BJH model was employed to find the pore width, where AAC800 was found to have an average pore width of 1.9 nm. Charge storage mainly occurs in such micropores which are beneficial for fabrication of electrodes in electrochemical energy storage devices.
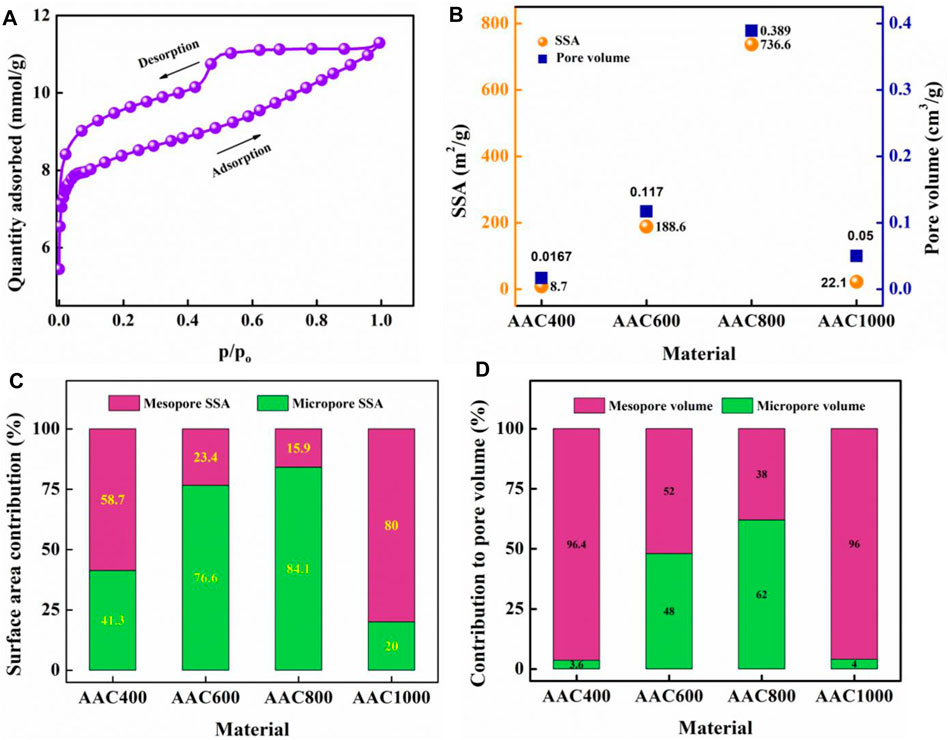
FIGURE 5. N2 adsorption/desorption isotherm for AAC800 (A), BET SSA and pore volume of AACs (B), contribution of mesopores and micropores toward total SSA in AACs (C), and contribution of mesopores and micropores toward pore volume in AACs (D).
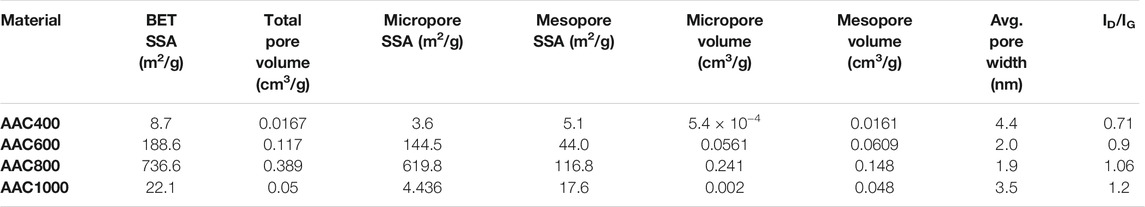
TABLE 2. Porosity and structural data of AACs.
Electrochemical analysis of the AAC electrodes was conducted in 6.0 M KOH electrolyte in a three-electrode setup. Generally, the carbon synthesized at lower temperatures is not suitable for electrochemical applications; hence, AAC400 was not tested for its supercapacitive behavior. CV curves provide vital information regarding the type of the charge storage mechanism operating in an electrode–electrolyte interface. The CV plots of AAC600 and AAC1000 at various scan rates (mV/s) are shown in Supplementary Figures S7A,B, while that of AAC800 is provided in Figure 6A. For the comparison purpose, the current response of all AACs at 50 mV/s is compiled in Figure 6B. As can be seen from all the plots, AAC800 exhibits near rectangular curves at lower current densities, and we do not observe any significant deformation of shape at 100 mV/s, indicating a superior EDLC behavior. An enhanced current response of AAC800 toward applied potential can be attributed to well-formed bimodal/hierarchical porous structures with a higher SSA, providing access to more ions on the electrode surface. Charge storage quantification was done from GCD tests. The triangular-shaped GCD curves are typical of electrochemical supercapacitors (Figure 6C). The linear and symmetric nature of charge–discharge curves at various current densities suggested good coulombic efficiency of the AAC800 electrode. The CV and GCD curves of AAC800 indicate a linear voltage versus time response, suggesting that the amount of charge stored varies linearly as a function of potential, and a single value of capacitance can be easily calculated for capacitive-type energy storage systems (Mathis et al., 2019). At the same time, the GCD profile of AAC600 (Supplementary Figure S7C) shows tweaked triangular curves with a non-linear discharge curve, suggesting pseudocapacitive behavior, while AAC1000 exhibited relatively better linear and symmetric curves than AAC600 (Supplementary Figure S7D). A comparative graph of AACs at 0.5 A/g is provided in Figure 6D. AAC800 exhibits a longer discharge duration for the same current density, indicating more charge storage. This is obviously attributed to organized bimodal porous structures contributing in storing a large number of ions/charges. Specific capacitances were calculated from the slope of discharge curves using Equation 2. As expected, AAC800 exhibited a maximum capacitance of 176.7 F/g at 0.5 A/g, which is 3 times higher than that of AAC600 and 2 times higher than that of AAC1000 (Figure 6E). AAC800 was operated at various current densities from 0.5 A/g to 10.0 A/g, and capacitances were calculated at each current density. With an increase in current density, the specific capacitance decreased from 176.7 F/g at 0.5 A/g to 93.5 F/g at 10.0 A/g (Figure 6F). However, more than 50% retention of capacitance at a higher current density indicates potential applicability of the electrode material in real devices.
FIGURE 6. CV of the AAC800 electrode at different scan rates (A), comparative CV profile of all AACs in 50 mV/s (B), GCD curve of AAC800 at different current densities (C), comparative GCD profile of AACs at 0.5 A/g (D), specific capacitance of AACs at 0.5 A/g (E), and specific capacitance of the AAC800 electrode as a function of current density (F).
Electrochemical impedance spectroscopy provides further insights into the electrochemical nature of AACs. The Nyquist impedance plot plots imaginary and real impedances at various frequencies (Figure 7A). Distinct behaviors can be analyzed for different frequency regimes. The Nyquist plot shows a semicircle at the high-frequency region, followed by a vertical tail for AAC600 and AAC1000. The point of intersection at the x-axis at the highest applied frequency gives the RS (Ω) or equivalent series resistance (ESR), which is the total internal resistance of the cell and was found to be 0.4 and 0.35 Ω, respectively, for AAC600 and AAC1000. Both exhibit charge-transfer resistance, with RCT of 1.1 and 1.2 Ω, respectively. AAC800 on the other hand does not exhibit any distinct semicircle at high frequency. This further confirms the EDLC nature of AAC800 because the porous carbon electrode stores the charges physically (electrostatic mechanism) and hence charge-transfer resistance, RCT, is eliminated. At the high frequency region [inset (ii)], we can observe an immediate ∼45° line from RS, followed by a vertical tail which is nearly parallel to the imaginary axis in the low-frequency region. The ∼45° line is short, suggesting easy accessibility of active sites on the electrode in a short time and indicating a capacitive-like behavior. The impedance data are also represented by the Bode phase angle plot (Figure 7B) as a function of frequency. AAC800 shows a phase angle of −81°, which is close to an ideal capacitor (−90°), while AAC600 and AAC1000 show phase angles of −62° and −79°, respectively. Real and imaginary capacitances were also calculated and plotted against frequency. A transition between purely resistive behavior from C′ = 0 to where C′ = 1 is plotted (Figure 7C). In ideal cases, the capacitance remains invariant as a function of frequency once this transition happens (Largeot et al., 2008). AAC800 comes close to exhibiting this behavior by reaching toward saturation, whereas for AAC600 and AAC1000, the capacitance (C′) continues to increase with decreasing frequency. Figure 7D depicts evolution of imaginary capacitance (C″) with frequency. The peak of the curve indicates the transition from purely resistive to purely capacitive. The frequency (fo) where this shift happens can be observed to be shifting toward higher frequencies for AAC800. The reciprocal of this characteristic frequency (
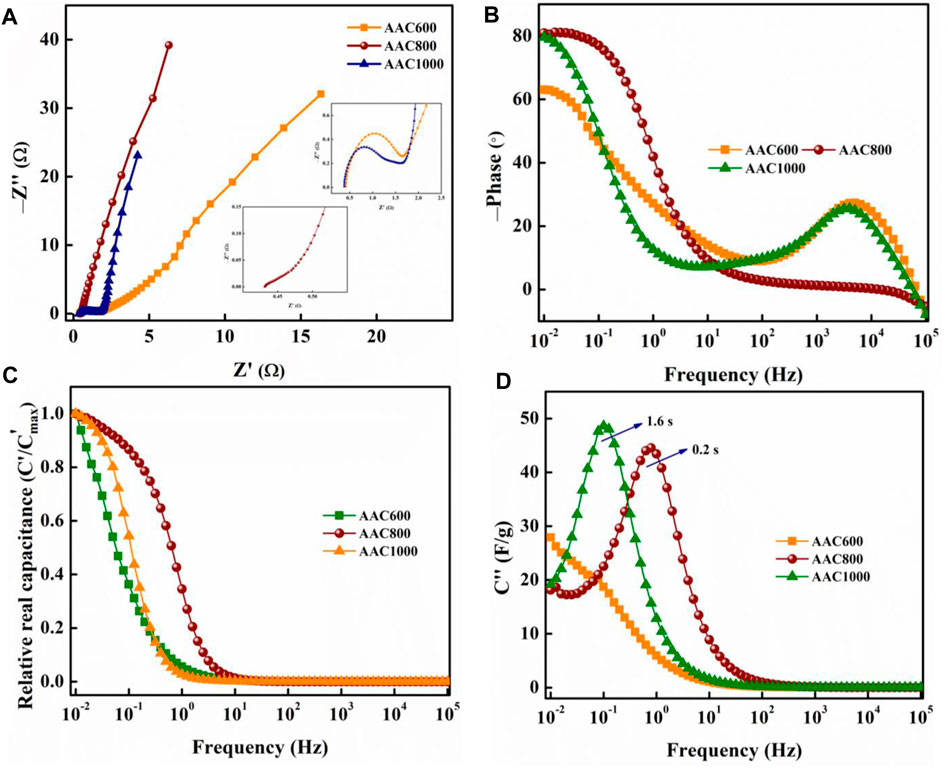
FIGURE 7. Nyquist impedance plot of AACs (A); inset (i) shows the high-frequency region of AAC600 and AAC1000; inset (ii) shows the high-frequency region of AAC800; Bode phase angle plot of AACs (B); relative real (C) and imaginary capacitance (D) of AACs as a function of frequency.
A CR2032-type symmetric supercapacitor consisting of the same AAC800 as an active material in the cathode and anode with tetraethylammonium tetrafluoroborate (TEABF4) as a conducting organic salt in acetonitrile as the electrolyte was fabricated and henceforth will be referred to as OSSc. The cyclic voltammograms at different scan rates under 1, 2, 2.3, and 2.7 V are shown in Supplementary Figure S8. Current response to applied potential follows a rectangular shape at lower scan rates (5–25 mV/s) at all operating voltages and exhibits a slight deformity at higher scan rates, suggesting a strong EDLC behavior. To mathematically quantify the type of the mechanism for charge storage, Equation 6 was used
where current response (i) is related to sweep rate (ν) by the sum of capacitive and diffusion processes, while “a” and “b” are adjustable parameters. Plotting log i against log ν gives a linear response (Figure 8B) which fits well (R2 = 0.999) with the linear equation (y = a + bx) whose slope gives the value of “b” (0.92). This value being closer to unity suggests that the charge storage mechanism could be attributed to dominance of the capacitive mechanism along the linear combination of both diffusion and capacitive effects (Fleischmann et al., 2020). However, this method does not quantify the individual mechanism. Hence, CV response was further analyzed to find the individual contributions by using Equation 7
where
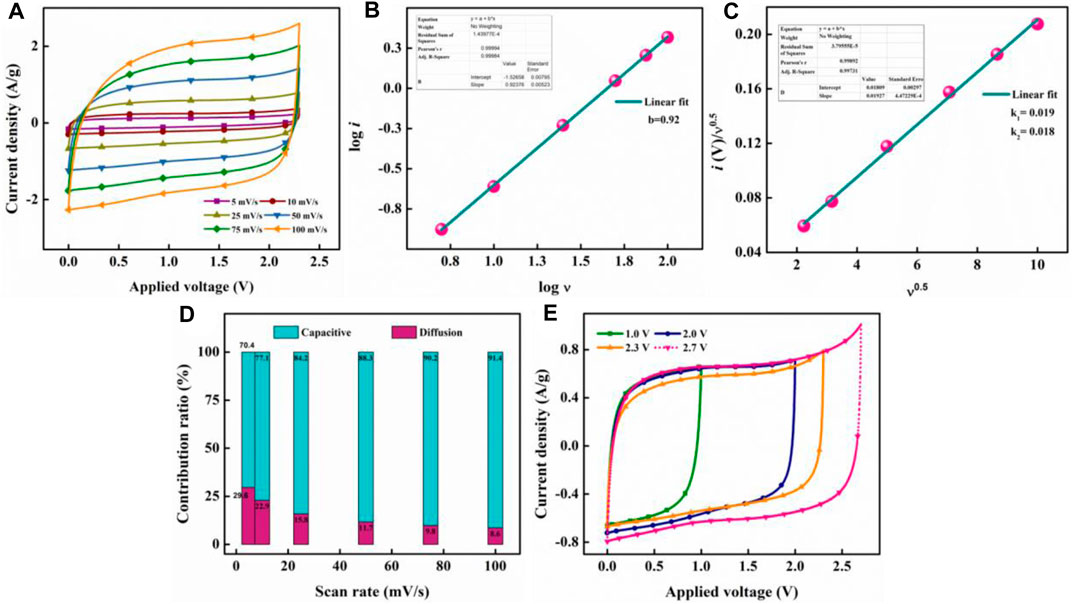
FIGURE 8. CV profile of OSSc at various current densities operated at 2.3 V (A), plot of linearity of log i with sweep rate (B), linearity plot of current response with scan rate for finding k1 and k2(C), quantification of current response from capacitive and diffusion-controlled mechanisms (D), and CV depicting OSSc operated at different voltages at 25 mV/s, (E).
GCD tests were conducted at the maximum operating voltage of the cell (2.3 V; Figure 9A). The symmetric and linearly triangular-shaped curves further compliment the results obtained from CV analysis. The tests were conducted at various current densities from 0.1 A/g to 5.0 A/g, retaining the symmetric nature and signifying good efficiency of OSSc. Figure 9B exhibits versatility of OSSc, where the device could be operated at differing potential windows. GCD tests were primarily used to find the gravimetric specific capacitance of the cell. The capacitance was found to decrease over increased current density from 52.3 F/g at 0.1 A/g to 37.6 F/g at 5.0 A/g (Figure 9C). However, ∼70% of the initial capacitance was still retained even at a higher current density, indicating potential for commercial applicability of the OSSc. The energy density and power density of the OSSc were calculated from Eqs. 3, 4 and are plotted in the Ragone plot (Figure 9D). The device exhibited a maximum energy density of 16.7 Wh/kg at 98 W/kg and retained ∼72% of the energy density (12 Wh/kg) at a high power density of 2882 W/kg, further signifying the potential application of the electrodes. The electrode material was found to be superior when compared to earlier published reports in the past 1 year (Table 3). All the energy parameters of OSSc are listed in Suppementary Table S1.
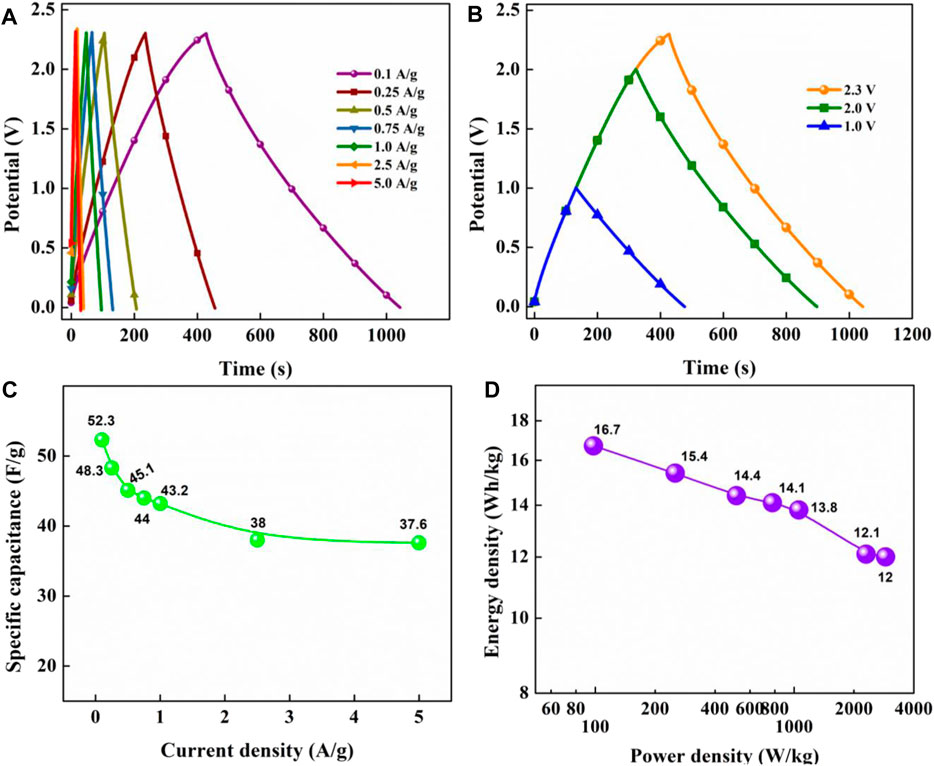
FIGURE 9. GCD curves at various current densities at 2.3 V (A), comparative GCD curves at 0.1 A/g under different operating voltages (B), specific capacitance as a function of current density (C), and Ragone plot at 2.3 V (D).
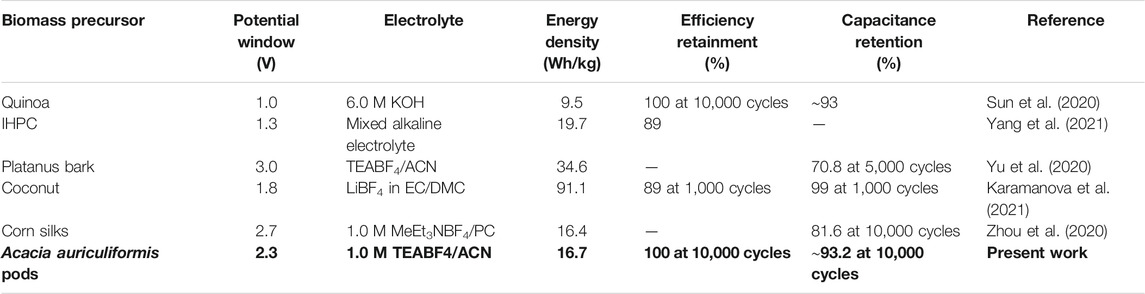
TABLE 3. Comparison of the present work with some of earlier published research studies in the past 1 year.
Stability of the OSSc cell was tested over 10,000 charge/discharge cycles carried out at a constant current density of 2.0 A/g operated at 2.3 V. The device was found to exhibit a phenomenal coulombic efficiency of 100% throughout 10,000 cycles (Figure 10A), which is expected from an ideal supercapacitor. The cell also exhibited an excellent capacitance retention of 93.2% over 10,000 cycles, suggesting commercial viability of the electrode–electrolyte assembly. The inset in Figure 10A shows the charge/discharge curves of OSSc at different cycle numbers during the cycling process. The uniformity of the curves at different cycle numbers proves the viability of the cell. The cell was further analyzed for its loss of current response after charge/discharge cycles from CV. Figure 10B depicts CV curves recorded before and after 10,000 charge–discharge cycles. Although we can observe loss in current response, the cell was found to be good enough with retaining ∼77% of the initial current response. The impedance data were measured before and after 10,000 charge/discharge cycles to make the Nyquist plot (Figure 10C). Unlike AAC800, we observed a semicircle in the high-frequency region for OSSc with an RS of 0.96 Ω and a charge-transfer resistance, RCT, of 11.4 Ω. The impedance was found to increase after 10,000 cycles with RS increased to 4.8 Ω and RCT to 15.0 Ω. The semicircle observed for OSSc at the high-frequency region could be attributed to interfacial impedance (Yan et al., 2019). The phase angle was found from the Bode plot before and after 10,000 cycles (Figure 10D). The phase angle was found to be ∼72° and ∼62° before and after 10,000 cycles, respectively. Relative real and imaginary capacitances as functions of frequencies were also plotted (Figure 10E). The time constant (τ) was found to be 3.1 s, calculated from the maximum of the peak. The change in impedance with cycling is one of the methods to determine the cycling stability. The pore clogging results in the increase of resistance, which can be accurately identified from impedance spectra. Fading in capacitance, increased impedance, and a distinct change in Bode plot with cycling could be attributed to increased resistance and electrolyte loss (Hasyim et al., 2017)The self-discharge curves of OSSc were plotted after charging to 2.3 V at 1.0 A/g. The OCP was recorded at regular intervals for 100 min with the cell showing 43% retention after charging up to 2.3 V. Two self-discharge models were employed to identify the major mechanism responsible for the self-discharge (Barzegar et al., 2017). The first model relates self-discharge current leakage with resistance R using Eq. 9,
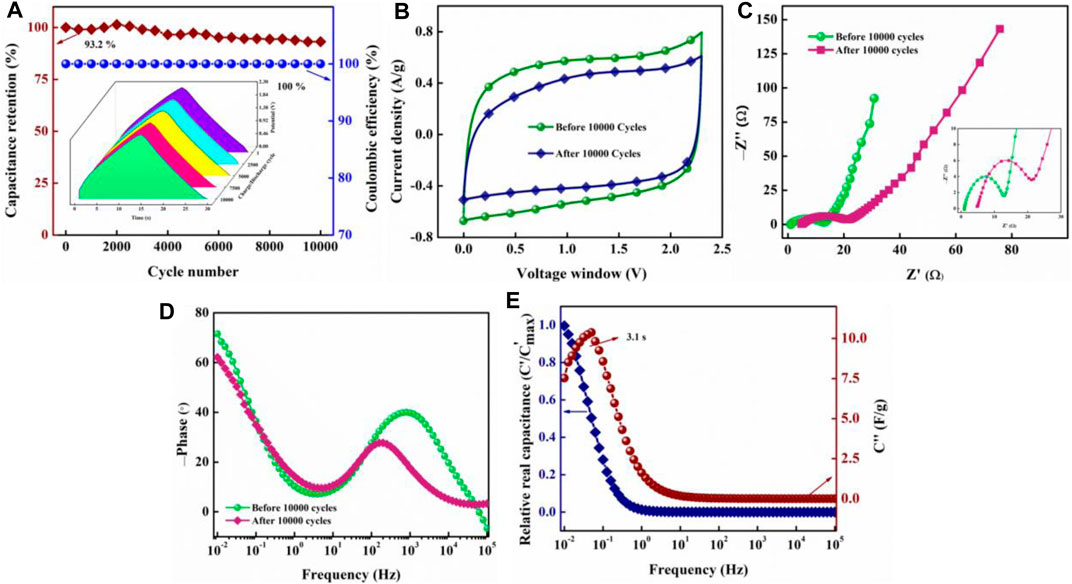
FIGURE 10. Capacitance retention (%) and coulombic efficiency (%) over the charge/discharge cycle number of OSSc (A); the inset shows the charge–discharge curves measured at various cycle numbers during stability study; CV curves (B) and Nyquist impedance plot (C) of OSSc before and after 10,000 charge/discharge cycles; the inset in (C) shows the plot at the high-frequency region; Bode phase angle plot as a function of frequency (D); relative real (C′) and imaginary (C″) capacitance over frequency (E).
where Vo is the initial voltage and C is the equivalent capacity of the EDLC. Subsequently, the plot of lnV versus time should give a linear relation. However, data obtained for OSSc deviated from this linear regime (R2 = 0.62; Figure 11A). This indicated that the self-discharge observed in OSSc cannot be caused by current leakage through a resistance model. The second model was based on the diffusion-control mechanism where it is postulated that the loss of stored charges is due to the out-diffusion of the ions in the EDL. The drop in voltage by this type of diffusion process is governed by the following equation:
where “m” is the diffusion, related to the initial voltage, Vo. Data measured for self-discharge of OSSc fit well with this model (R2 = 0.96; Figure 11B), establishing that the major process driving the self-discharge is diffusion control of ions in the electrolyte from the double layer.
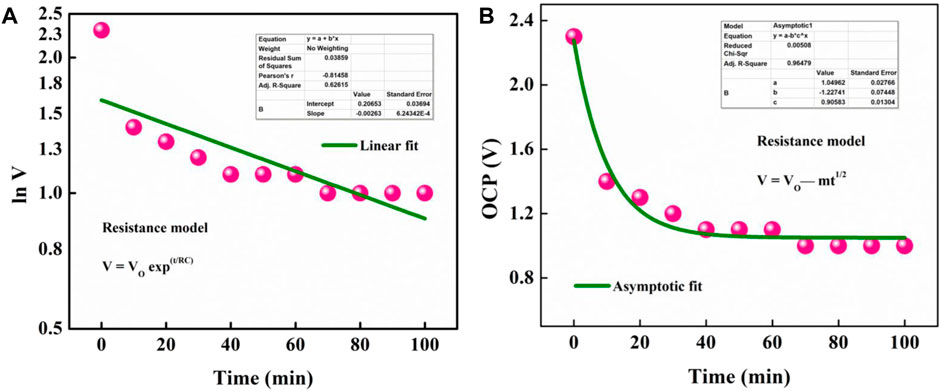
FIGURE 11. Fitting self-discharge of the cell with current leakage over a resistance model (A) and diffusion-controlled process (B).
The effect of temperature was utilized to synthesize Acacia auriculiformis pod-derived porous nanocarbons without any activating agents by the “self-activation” mechanism at 800°C. Well-organized bimodal/hierarchically porous nanocarbons synthesized exhibited a maximum BET SSA of 736.6 m2/g. Surface analysis further shed light on the role of micropores in enhancing SSA and pore volume significantly. This further was shown to have an impact on electrochemical behavior with AAC800 exhibiting a maximum specific capacitance of 176.7 F/g. The CR2032-type symmetric supercapacitor cell was fabricated using AAC800 as the electrode material. The kinetics of the storage mechanism was established, which was found to be dominated by the capacitive effect. TEABF4 in ACN was used as the electrolyte, which permitted increasing the potential window to 2.7 V; however, overcharging was observed beyond 2.3 V. The cell was found to exhibit diffusion-controlled self-discharge. The device exhibited excellent stability over 10,000 charge/discharge cycles, retaining 100% coulombic efficiency and 93.2% capacitance retention. The one-step “self-activation” technique and the encouraging results from electrochemical analysis demonstrate the potential of AAC800 for commercial viability.
The original contributions presented in the study are included in the article/Supplementary Material, and further inquiries can be directed to the corresponding author.
VB—Investigation, formal analysis, and manuscript writing; TJ—Investigation; TR—Resources and validation; US—Resources and validation; KC—Validation and formal analysis; GH—Conceptualization, funding acquisition, methodology, project administration, supervision, and validation.
GH acknowledges DST-Nanomission, Government of India, for providing a research grant on “Biowaste-based porous nanomaterials for efficient low-cost energy storage devices” (SR/NM/NT-1026/2017). GH also would like to thank AISTDF Secretariat, DST-SERB, ASEAN-Indian Collaborative research project, file number. IMRC/AISTDF/CRD/2018/000019 for funding this work.
The author GH was employed by the company M/s Adindistech Pvt Ltd.
The remaining authors declare that the research was conducted in the absence of any commercial or financial relationships that could be construed as a potential conflict of interest.
All claims expressed in this article are solely those of the authors and do not necessarily represent those of their affiliated organizations, or those of the publisher, the editors, and the reviewers. Any product that may be evaluated in this article, or claim that may be made by its manufacturer, is not guaranteed or endorsed by the publisher.
The Supplementary Material for this article can be found online at: https://www.frontiersin.org/articles/10.3389/fenrg.2021.744133/full#supplementary-material
Barzegar, F., Bello, A., Dangbegnon, J. K., Manyala, N., and Xia, X. (2017). Asymmetric Supercapacitor Based on Activated Expanded Graphite and Pinecone Tree Activated Carbon with Excellent Stability. Appl. Energ. 207, 417–426. doi:10.1016/j.apenergy.2017.05.110
Bhat, V. S., Hegde, G., and Nasrollahzadeh, M. (2020a). A Sustainable Technique to Solve Growing Energy Demand: Porous Carbon Nanoparticles as Electrode Materials for High-Performance Supercapacitors. J. Appl. Electrochem. 50, 1243–1255. doi:10.1007/s10800-020-01479-0
Bhat, V. S., Kanagavalli, P., Sriram, G., B, R. P., John, N. S., Veerapandian, M., et al. (2020b). Low Cost, Catalyst Free, High Performance Supercapacitors Based on Porous Nano Carbon Derived from Agriculture Waste. J. Energ. Storage 32, 101829. doi:10.1016/j.est.2020.101829
Bhat, V. S., Krishnan, S. G., Jayeoye, T. J., Rujiralai, T., Sirimahachai, U., Viswanatha, R., et al. (2021). Self-activated ‘green’ Carbon Nanoparticles for Symmetric Solid-State Supercapacitors. J. Mater. Sci. 56, 13271–13290. doi:10.1007/s10853-021-06154-z
Bhat, V. S., S, S., Jayeoye, T. J., Rujiralai, T., Sirimahachai, U., Chong, K. F., et al. (2020c). Influence of Surface Properties on Electro‐chemical Supercapacitors Utilizing Callerya Atropurpurea Pod Derived Porous Nanocarbons: Structure Property Relationship between Porous Structures to Energy Storage Devices. Nano Select 1, 226–243. doi:10.1002/nano.202000013
Bhat, V. S., Supriya, S., and Hegde, G. (2019). Biomass Derived Carbon Materials for Electrochemical Sensors. J. Electrochem. Soc. 167, 037526. doi:10.1149/2.0262003JES/pdf
Bommier, C., Xu, R., Wang, W., Wang, X., Wen, D., Lu, J., et al. (2015). Self-activation of Cellulose: A New Preparation Methodology for Activated Carbon Electrodes in Electrochemical Capacitors. Nano Energy 13, 709–717. doi:10.1016/j.nanoen.2015.03.022
Borchardt, L., Oschatz, M., and Kaskel, S. (2014). Tailoring Porosity in Carbon Materials for Supercapacitor Applications. Mater. Horiz. 1, 157–168. doi:10.1039/c3mh00112a
Chhiti, Y., Salvador, S., Commandré, J.-M., and Broust, F. (2012). Thermal Decomposition of Bio-Oil: Focus on the Products Yields under Different Pyrolysis Conditions. Fuel 102, 274–281. doi:10.1016/j.fuel.2012.06.098
Drewniak, S., Muzyka, R., Stolarczyk, A., Pustelny, T., Kotyczka-Morańska, M., and Setkiewicz, M. (2016). Studies of Reduced Graphene Oxide and Graphite Oxide in the Aspect of Their Possible Application in Gas Sensors. Sensors 16, 103. doi:10.3390/s16010103
Ferrari, A. C., and Basko, D. M. (2013). Raman Spectroscopy as a Versatile Tool for Studying the Properties of Graphene. Nat. Nanotech 8, 235–246. doi:10.1038/nnano.2013.46
Ferrari, A. C., and Robertson, J. (2000). Interpretation of Raman Spectra of Disordered and Amorphous Carbon. Phys. Rev. B 61, 14095–14107. doi:10.1103/physrevb.61.14095
Fleischmann, S., Mitchell, J. B., Wang, R., Zhan, C., Jiang, D.-E., Presser, V., et al. (2020). Pseudocapacitance: From Fundamental Understanding to High Power Energy Storage Materials. Chem. Rev. 120, 6738–6782. doi:10.1021/acs.chemrev.0c00170
Fu, Z., Li, Z., Si, P., and Tao, F. (2019). A Hierarchical Energy Management Strategy for Fuel Cell/battery/supercapacitor Hybrid Electric Vehicles. Int. J. Hydrogen Energ. 44, 22146–22159. doi:10.1016/j.ijhydene.2019.06.158
Gür, T. M. (2018). Review of Electrical Energy Storage Technologies, Materials and Systems: Challenges and Prospects for Large-Scale Grid Storage. Energy Environ. Sci. 11, 2696–2767. doi:10.1039/c8ee01419a
Hasyim, M. R., Ma, D., Rajagopalan, R., and Randall, C. (2017). Prediction of Charge-Discharge and Impedance Characteristics of Electric Double-Layer Capacitors Using Porous Electrode Theory. J. Electrochem. Soc. 164, A2899–A2913. doi:10.1149/2.0051713jes
Hegde, G., Abdul Manaf, S. A., Kumar, A., Ali, G. A. M., Chong, K. F., Ngaini, Z., et al. (2015). Biowaste Sago Bark Based Catalyst Free Carbon Nanospheres: Waste to Wealth Approach. ACS Sust. Chem. Eng. 3, 2247–2253. doi:10.1021/acssuschemeng.5b00517
Jing, W., Lai, C. H., Wong, W. S. H., and Wong, M. L. D. (2018). A Comprehensive Study of Battery-Supercapacitor Hybrid Energy Storage System for Standalone PV Power System in Rural Electrification. Appl. Energ. 224, 340–356. doi:10.1016/j.apenergy.2018.04.106
K P, C., Bhat, V. S., B, A. K., Maiyalagan, T., Hegde, G., Varghese, A., et al. (2020). Unique Host Matrix to Disperse Pd Nanoparticles for Electrochemical Sensing of Morin: Sustainable Engineering Approach. ACS Biomater. Sci. Eng. 6, 5264–5273. doi:10.1021/acsbiomaterials.0c00758
Karamanova, B., Shipochka, M., Georgiev, M., Stankulov, T., Stoyanova, A., and Stoyanova, R. (2021). Biomass-Derived Carbonaceous Materials to Achieve High-Energy-Density Supercapacitors. Front. Mater. 8, 108. doi:10.3389/fmats.2021.654841
Kumar, A., Hegde, G., Manaf, S. A. B. A., Ngaini, Z., and Sharma, K. V. (2014). Catalyst Free Silica Templated Porous Carbon Nanoparticles from Bio-Waste Materials. Chem. Commun. 50, 12702–12705. doi:10.1039/c4cc04378b
Kwan, Y. C. G., Ng, G. M., and Huan, C. H. A. (2015). Identification of Functional Groups and Determination of Carboxyl Formation Temperature in Graphene Oxide Using the XPS O 1s Spectrum. Thin Solid Films 590, 40–48. doi:10.1016/j.tsf.2015.07.051
Largeot, C., Portet, C., Chmiola, J., Taberna, P.-L., Gogotsi, Y., and Simon, P. (2008). Relation between the Ion Size and Pore Size for an Electric Double-Layer Capacitor. J. Am. Chem. Soc. 130, 2730–2731. doi:10.1021/ja7106178
Li, Z. Q., Lu, C. J., Xia, Z. P., Zhou, Y., and Luo, Z. (2007). X-ray Diffraction Patterns of Graphite and Turbostratic Carbon. Carbon 45, 1686–1695. doi:10.1016/j.carbon.2007.03.038
Liu, C., Yan, X., Hu, F., Gao, G., Wu, G., and Yang, X. (2018a). Toward superior Capacitive Energy Storage: Recent Advances in Pore Engineering for Dense Electrodes. Adv. Mater. 30, 1705713. doi:10.1002/adma.201705713
Liu, J., Wang, J., Xu, C., Jiang, H., Li, C., Zhang, L., et al. (2018b). Advanced Energy Storage Devices: Basic Principles, Analytical Methods, and Rational Materials Design. Adv. Sci. 5, 1700322. doi:10.1002/advs.201700322
Mathis, T. S., Kurra, N., Wang, X., Pinto, D., Simon, P., and Gogotsi, Y. (2019). Energy Storage Data Reporting in Perspective-Guidelines for Interpreting the Performance of Electrochemical Energy Storage Systems. Adv. Energ. Mater. 9, 1902007. doi:10.1002/aenm.201902007
Miller, J. R. (2018). Perspective on Electrochemical Capacitor Energy Storage. Appl. Surf. Sci. 460, 3–7. doi:10.1016/j.apsusc.2017.10.018
Simon, P., Gogotsi, Y., and Dunn, B. (2014). Where Do Batteries End and Supercapacitors Begin? Science 343, 1210–1211. doi:10.1126/science.1249625
Snowdon, M. R., Mohanty, A. K., and Misra, M. (2014). A Study of Carbonized Lignin as an Alternative to Carbon Black. ACS Sust. Chem. Eng. 2, 1257–1263. doi:10.1021/sc500086v
Sun, K., Leng, C.-Y., Jiang, J.-C., Bu, Q., Lin, G.-F., Lu, X.-C., et al. (2017). Microporous Activated Carbons from Coconut Shells Produced by Self-Activation Using the Pyrolysis Gases Produced from Them, that Have an Excellent Electric Double Layer Performance. New Carbon Mater. 32, 451–459. doi:10.1016/s1872-5805(17)60134-3
Sun, Y., Xue, J., Dong, S., Zhang, Y., An, Y., Ding, B., et al. (2020). Biomass-derived Porous Carbon Electrodes for High-Performance Supercapacitors. J. Mater. Sci. 55, 5166–5176. doi:10.1007/s10853-019-04343-5
Supriya, S., Sriram, G., Ngaini, Z., Kavitha, C., Kurkuri, M., De Padova, I. P., et al. (2019). The Role of Temperature on Physical–Chemical Properties of Green Synthesized Porous Carbon Nanoparticles. Switzerland: Waste and Biomass Valorization.
Thommes, M., Kaneko, K., Neimark, A. V., Olivier, J. P., Rodriguez-Reinoso, F., Rouquerol, J., et al. (2015). Physisorption of Gases, with Special Reference to the Evaluation of Surface Area and Pore Size Distribution (IUPAC Technical Report). De Gruyter 87, 1051–1069. doi:10.1515/pac-2014-1117
Yan, Z., Wei, C., and Obrovac, M. N. (2019). Understanding Interfacial Impedance Growth in Porous Electrodes Containing Blended Active Materials. J. Power Sourc. 438, 226955. doi:10.1016/j.jpowsour.2019.226955
Yang, B., Zhang, D., She, W., Wang, J., Gao, S., Wang, Y., et al. (2021). Remarkably Improving the Specific Energy of Supercapacitor Based on a Biomass-Derived Interconnected Hierarchical Porous Carbon by Using a Newly-Developed Mixed Alkaline Aqueous Electrolyte with Widened Operation Voltage. J. Power Sourc. 492, 229666. doi:10.1016/j.jpowsour.2021.229666
Yang, H., Yan, R., Chen, H., Zheng, C., Lee, D. H., and Liang, D. T. (2006). In-Depth Investigation of Biomass Pyrolysis Based on Three Major Components: Hemicellulose, Cellulose and Lignin. Energy Fuels 20, 388–393. doi:10.1021/ef0580117
Yu, F., Ye, Z., Chen, W., Wang, Q., Wang, H., Zhang, H., et al. (2020). Plane Tree Bark-Derived Mesopore-Dominant Hierarchical Carbon for High-Voltage Supercapacitors. Appl. Surf. Sci. 507, 145190. doi:10.1016/j.apsusc.2019.145190
Zhang, Q., Han, K., Li, S., Li, M., Li, J., and Ren, K. (2018). Synthesis of Garlic Skin-Derived 3D Hierarchical Porous Carbon for High-Performance Supercapacitors. Nanoscale 10, 2427–2437. doi:10.1039/c7nr07158b
Keywords: self-activation, pyrolysis, porous carbon, supercapacitors, organic electrolyte
Citation: Bhat VS, Jayeoye TJ, Rujiralai T, Sirimahachai U, Chong KF and Hegde G (2021) Acacia auriculiformis–Derived Bimodal Porous Nanocarbons via Self-Activation for High-Performance Supercapacitors. Front. Energy Res. 9:744133. doi: 10.3389/fenrg.2021.744133
Received: 19 July 2021; Accepted: 24 August 2021;
Published: 23 September 2021.
Edited by:
Suresh Kannan Balasingam, Norwegian University of Science and Technology, NorwayReviewed by:
Debananda Mohapatra, Yeungnam University, South KoreaCopyright © 2021 Bhat, Jayeoye, Rujiralai, Sirimahachai, Chong and Hegde. This is an open-access article distributed under the terms of the Creative Commons Attribution License (CC BY). The use, distribution or reproduction in other forums is permitted, provided the original author(s) and the copyright owner(s) are credited and that the original publication in this journal is cited, in accordance with accepted academic practice. No use, distribution or reproduction is permitted which does not comply with these terms.
*Correspondence: Gurumurthy Hegde, bXVydGh5aGVnZGVAZ21haWwuY29t
Disclaimer: All claims expressed in this article are solely those of the authors and do not necessarily represent those of their affiliated organizations, or those of the publisher, the editors and the reviewers. Any product that may be evaluated in this article or claim that may be made by its manufacturer is not guaranteed or endorsed by the publisher.
Research integrity at Frontiers
Learn more about the work of our research integrity team to safeguard the quality of each article we publish.