 Pingkuo Liu
 Cunyu Lu
- College of Economics and Management, Shanghai University of Electric Power, Shanghai, China
Many industrialized countries are pursuing energy transition, but their focuses are different. The orderliness synergy as a unique aspiration of the current energy transition is emphasized in this article by constructing an orderliness-synergy evaluation model and selecting a dataset covering the period of 2011–2018 from Industrial Scale, Economic Benefit, Social Contribution, and Growth Potential of China to calculate the comprehensive development level and the orderliness-synergy degree of both the conventional energy industry and the nonconventional one. A novel evaluation model with stock-increment attributes is built to measure the resource storage and the growth rate systematically and to further analyze their driving forces. The results reveal that 1) the overall orderliness-synergy degree of these two sub-industries shows an upward trend year by year; however, there are some significant differences among them. 2) China’s energy transition has shown a dramatic promotion in the structural upgrading, while the momentums of these two sub-industries show a shift from the stock–resource–contribution advantage to the increment–resource–contribution advantage. 3) The actual stock-increment contribution coefficient values of these two sub-industries have not reached the development expectations of industrial performances, and there is still reasonable space for the structural optimization. Finally, policy implications are discussed.
1 Introduction
In the process of globalization, the energy sustainable transition, responding to economic growth, energy security, and climate change, has become one of the core issues and even become the focus of international attention (Nieto et al., 2020). The global energy transition is rapidly accelerating, resulting in a distinct change for the energy industry from high carbon to low carbon, from black to green (Chapman and Okushima, 2019). Many industrialized countries are pursuing their own energy transition with different pathways. For example, the United States focuses on both the shale gas and the renewable energy, the European countries are focused in the renewables, and Japan devotes itself to clean resources. In particular, renewable/clean energy is transforming its own role from the nonconventional energy to the main energy and from the alternative energy to the leading energy in the long term (Liu and Wang, 2019). Such a transition does attract considerable attention from not only governments and businesses but also from international academia. For instance, Nochta and Skelcher (2020) evaluated the opportunities and the challenges of network governance to support a sustainable energy transition in European cities. The existing literature studies have identified a number of frameworks to deal with the issue of energy equality (Lacey–Barnacle et al., 2020), which commonly is assigned to the economic (Alvial–Palavicino and Ureta, 2017), the environmental (Poruschi and Ambrey, 2019), the political (Kotzebue and Weissenbacher, 2020; Healy and Barry, 2017), and the social (Siddharth and HåVard, 2018; Hill and Connelly, 2018). Some scholars have also studied the barriers and the motivations affecting energy transition (Biresselioglu et al., 2020; Haddadian et al., 2015).
All countries are very concerned about the performance and achievement of their energy transition (Zhang, 2019). From the perspective of system operation and government supervision, such a performance or an achievement can be reflected in two aspects: the efficiency in energy transition and the equality in energy transition (Haley et al., 2020; Liu et al., 2018). In the process of energy transition, however, there are still some phenomena in a state of misalignment (disorder and misadjustment) (Liu et al., 2018). We have paid attention to a basic bottom line in the process of energy transition—Orderliness Synergy (Liu PK. et al., 2020). Orderliness, reflecting the efficiency of energy transition, refers to the gradual and stable realization of both the energy system evolution and the development expectation through mechanism design and institutional arrangement. Synergy, reflecting the equality of energy transition, refers to the realization of the balance of interest through structural optimization and functional adjustment. With the deepening of energy transition, the relationships among the nonconventional energy industry, the conventional energy industry, and other relevant industrial sectors have become much closer and even more complicated (Hesam and Yadollah, 2020; Wen et al., 2018). Compared with the mainstream approaches or other well-established methods, this “Orderliness Synergy” approach focuses more on the analysis on the energy transition itself. Especially, when evaluating the effectiveness of energy transition in one country or region, most of the approaches are to select the corresponding indicators in the aspects of economics, society, policy, security, and environment and then use some comprehensive evaluation methods for dimensional analysis. In this method, the concept of “Orderliness Synergy” has been well introduced and can be used as a springboard or a transition unit to evaluate the energy transition. Therefore, in the quantitative analysis, the only thing we need to do is to pay attention to this concept. Then, we can make a relatively objective analysis on the effectiveness of energy transition by analyzing the Orderliness Synergy only because the content of the Orderliness Synergy is multi-dimensional already. According to the technology maturity, there is a strict distinction in the energy sector. Conventional energy, also known as traditional energy, refers to the energy that has been widely produced and used for many years and is now mature in science and technology while reasonable in economy. Common types include coal, crude oil, natural gas, nuclear energy, thermal power, large hydropower, etc. Nonconventional energy, also known as new energy, refers to the energy that is newly developed or under research and development, and will be widely used in the future. These ones include solar energy, wind energy, small hydropower, geothermal energy, ocean energy, etc. The indicator Orderliness Synergy will undoubtedly become an important tool for the government to overcome development obstacles and strengthen energy supervision if it can be well measured (Liu PK. et al., 2020). At present, governments all over the world have been emphasizing the overall layout of the energy industry. In the government work reports of various countries, however, there are few evaluation standards for balancing the relationship between various sub-industries, especially for the orderly and synergistic development of different energy sub-sectors. In the meantime, there is less discussion on orderly synergistic development in the academic circles. Therefore, our research can not only expand the connotation of Sustainable Transition in theory but also support the government’s decision making and supervision in practice.
In this paper, we want to examine the interaction between the conventional energy industry and the nonconventional energy industry in the orderly synergistic evolution process from the meso-level and analyze the reasons for the different performances in the interaction, which means that we will re-examine and review the efficiency and the equality of energy transition from a novel perspective. Three fundamental questions related to the orderliness synergy of energy transition attract our attention: 1) in the given development space, is it possible for both the conventional energy and the nonconventional energy to achieve the orderliness synergy? 2) How to identify the main factors associated with the orderliness synergy for both conventional and nonconventional? 3) How to use both the stock resources and the increment resources to evaluate the orderliness synergy reasonably? To analyze the aforementioned issues quantitatively, we will use the data from China as a case study for a general discussion. Our research is mainly studied basically from the meso-level perspective. The remainder of this paper is organized as follows: Chapter 2 reviews the current research achievements. Chapter 3 presents the paper’s research method with three practicable models. Chapter 4 analyzes the index system, discusses the data, and presents the results and the simulation. Chapter 5 concludes and distills policy implications.
2 Literature Review
There are a lot of articles about conventional and nonconventional for energy transition in China. As far as the Orderliness Synergy of energy industry development in the transition period is concerned, however, scholars have not yet conducted a systematic, comprehensive, or holistic study. Liu P. et al. (2020) focused on the interaction between the evolution of the electric power industry and the development of the three industries and constructed the orderliness measurement model and the synergy measurement model based on a novel theoretical framework. So far, this is the only article researching on Orderliness Synergy. At present, scholars mainly focus on the effect of energy transition analyzing on 1) economic development, 2) technological innovation, and 3) energy policy (Zhou et al., 2018; Agyekum et al., 2021). For instance, to examine the relationship between China’s energy transition and economic development, Ma et al. (2018) discussed the feasible pathways of China’s low-carbon energy transition from 2015 to 2050. Zhang et al. (2017) believed that the strategic planning, the low-carbon urban development, and the institutional mechanism innovation are specific approaches to promote energy transition. Scholars in other countries mostly have a strong disposition to study 1) the government regulation (Villa and Slijepcevic, 2019) and 2) the energy transition mechanism (Jacobsson and Lauber, 2006; Cornelia and Michèle, 2018). For example, Mitchell et al. (2006) focused on the risk analysis of price, quantity, and balance and studied the effect of risk reduction on the effective support of policies and mechanisms for energy transition. More recently, Gielen et al. (2019) discussed the technological and economic factors for accelerating the energy transition process. Middleton (2018) focused on the synergistic effects between the energy efficiency and the renewable energy technology. Zhang et al. (2021) used the generalized method of moments (GMM) method and data envelopment analysis (DEA) to assess the relationship between public spending on R&D and green economic growth and energy efficiency. Specifically, some scholars have argued that social science of energy transition is as important as technological innovation and policy making (Wilson and Tyfield, 2018; Schürmann et al., 2019).
Quantitative methods constructed in the existing studies are necessary and helpful, which have become an irresistible trend for researching on the energy transition issue (Coester et al., 2018; Wainstein et al., 2019; Zhao, 2019). Begzjav and Eleuch (2020) focused on a dissipative system which can develop from the disorder state to the order state spontaneously with the interaction between a series of interrelated sub-systems. Kirill et al. (2020) introduced some new cost indicators to improve the orderliness of the energy structure. Through the quantitative analysis of scholars, some precious and useful experience can be learned. For example, Gielen et al. (2019) indicated that energy efficiency and renewable technologies are the core elements for promoting the energy transition, and the synergies of various energies are similarly important. It is also worth noting that the dynamic positive correlation between the conventional and nonconventional energy industries is formed by the quantifiable interaction of production factors, such as space resources, capital, technology, and human resources (Wang and Chen, 2019; Chen et al., 2019). Neither quantitative analysis nor empirical analysis on the orderliness synergy between the nonconventional energy industry and the conventional one has been undertaken to date; however, some exploratory models have been used to settle a dispute between the conventional energy industry and the nonconventional one (Li, 2015; Yuan et al., 2018). There are some outstanding ones. Clausen and Rudolph (2020) and Chen et al. (2019) explored the economic impact of industrial collaboration, while Jiang et al. (2012) analyzed the synergistic innovation mechanism of nonconventional energy in the power transmission industry cluster. In order to study the orderliness synergy of the energy industry, some scholars constructed the evaluation models for the orderliness-synergy degree with respect to technological economics, government policies, and other aspects in the energy sector (Yan et al., 2015; Nguyen and Matsuura, 2016). For instance, Wu (2017) established an evaluation model between the nonconventional energy industry and the regional economy, providing a reference for the policy making on economic development planning. Yun (2019) constructed the evaluation system of energy-environment policies and discussed the synergy effect.
At present, the global exploitation and utilization of nonconventional energy are expanding, while the application cost is dropping rapidly. The nonconventional energy has become an important alternative to deal with energy depletion and climate change. However, from the view of the current situation, it is impossible to give up the use of conventional energy completely. Promoting a sustainable development of the energy industry in an orderly synergistic way is also a significant measure for China to accelerate the energy transition. However, in terms of the existing research results, little is known about the contribution of both the conventional energy industry and the nonconventional one for the dual stock-increment attributes from the perspective of industrial interactions and the orderliness synergy. Hence, this paper takes the orderly synergistic development behaviors of China’s energy enterprises as a focus and summarizes the general rules and effective modes in the interactive evolution of the two sub-industries. The research is aimed at discovering the problems existing in the orderly synergistic evolution and exploring the relevant impact on the future sustainable energy transition.
3 Methodology
3.1 Industrial Development Level Measurement Model
Let
where
where
3.2 Industrial Development Evaluation Model
In order to measure the resource storage, the growth rate, and the driving force of the industry systematically, the concept of “stock-increment” is introduced (Zhang and Chen, 2014). The stock means the amount of all assets or all resources owned by the industrial sector, while the increment, a concept of flow volume, refers to the increase in the amount of assets or resources. Based on this definition, a dual-attribute evaluation model of “stock-increment” can be constructed to make the indicator identification and screening more comprehensive and more objective (Rupietta and Backes-Gellner, 2017).
Based on the purpose of evaluation on orderly synergistic development, the corresponding data information is screened while fully taking into account the authenticity, availability, and applicability of the data. Thus, the indicator system is constructed at the same time. The next step is to collect the stock data and the increment data of each indicator. The calculation formulas adopted for the increment are as follows:
It is of note that the conventional energy industry and the nonconventional one have increment values
In addition, to eliminate the influence of dimensions among various indicators, the efficacy coefficient method was used to normalize the indicators
The numerical results
Considering the contribution difference between the stock and the increment during the process of energy transition,
where
3.3 Orderliness-Synergy Evaluation Model
The interaction between the conventional energy industry and the nonconventional energy industry affects the energy transition efficiency at the meso-level (Notarnicola et al., 2016). Orderliness Synergy means that the energy industry not only reflects the certainty and the regularity of system structure or transition but also shows the performance of the mutual influence on the coordination and the planning. Similarly, Orderliness-Synergy degree is a quantitative standard for measuring the Orderliness Synergy among different sub-industries (Wang et al., 2015). It can not only reflect the process of interaction and adaptation between two sub-industries but also reveal the overall development linkage between them (Wang and Sun, 2016). Referring to the capacitive coupling coefficient model in physics, a model to measure the Orderliness-Synergy degree between the conventional and the nonconventional is obtained by analogy (Tang et al., 2018). From the perspective of Synergetics, the coupling effect determines both the order and the structure of one system when it reaches the critical region. In other words, the coupling effect reveals the changing trend of one system from misalignment to orderliness synergy. The key to such an effect is the coordination between the order parameters within the system, which affects the characteristics and the rules of phase transition. The coupling happens to be the measure for orderliness synergy, while the capacitive coupling coefficient model is precisely used to make a quantitative description of the interaction between the elements in different regions or in a certain period. The coupling degree measurement model of the multi-industry interaction can be expressed as
where
where
The larger the orderliness-synergy degree of
4 Analysis and Discussion
4.1 Indicator Description
4.1.1 Construction of the Indicator System
Based on the principle of science, systematization, and availability, the comparable relationships among the evaluating indicators should be considered under the strategic requirements of energy-sustainable transition and high-quality development. After identifying and screening the indicators with respect to the energy transition and industry development goal, the indicators are mainly selected from four aspects: Industrial Scale, Economic Benefit, Social Contribution, and Growth Potential (Drouilles et al., 2017; Hamman, 2018; Chapman and Itaoka, 2018):
1) “Industry Scale” reflects the level and capacity of all production factors in the industry and measures the total stock of assets owned by the energy sector at a given point. The industrial scale in line with the requirement of a High-quality Development strategy can reduce the production cost of different energy-supply enterprises and realize an effective range of increasing return to scale in the process.
2) “Economic benefits” represents the resource allocation efficiency of the industrial sector, explaining the economic competence of achieving profitability and improving quality when the technical conditions and production costs are established. The increase in economic benefits is useful to promote the expansion of enterprises’ reproduction, stimulate the increase in the industrial incremental investment, and further enhance the accumulation of the stock resources.
3) “Social Contribution” describes the social equity in the industrial development, embodied in the following four dimensions: energy conservation, emission reduction capacity, system reliability, and surplus value in society. With the shortage of fossil energy and the environment pollution, it is unwise for the energy industry to take the maximum profits or minimum cost as the only goal. The enterprises in China have already unified the material production and the ecological protection and paid more attention to the environmental conservation and the energy security in the pursuit of fulfilling social responsibilities.
4) “Growth potential” refers to the potential development capacity of the energy industrial system and the expected level of future energy development under the interaction of many influencing factors. This indicator also stands for the future competitiveness and development capability of both the conventional and the nonconventional, determining the sustainable transition direction of the modern energy system in an “Innovative, Coordinated, Green, Open, and Sharing” way.
Based on the analysis on the reasons of indicator selection above, an indicator system can be designed. All the indicators are illustrated specifically in Table 1. The data displayed in the table are from the public statistical information officially released during 2010–2019, such as “Analysis and Forecast Report on National Power Supply and Demand Situation (2019)”, “List of Basic Data in Power Statistics (2019)”, “Analysis Report on Transaction Information of National Power Market (2019)”, “Statistical Data of National Power Industry (2019)”, “China Power Yearbook 2019”, etc. The conventional energy involved in the research includes thermal power and large hydropower, while the nonconventional energy includes small hydropower, nuclear power, wind power, and solar power. Due to the unavailability of data, the biomass power generation industry is not included in the nonconventional energy. In addition, the current scale of the biomass power generation industry is small, which can be ignored. In particular, the total carbon emission and the unscheduled outage times are the negative indicators. From the perspective of modeling, it is not stipulated that negative indicators cannot be selected. In addition, the negative indicators are usually used as the “miniaturization index” in the model.
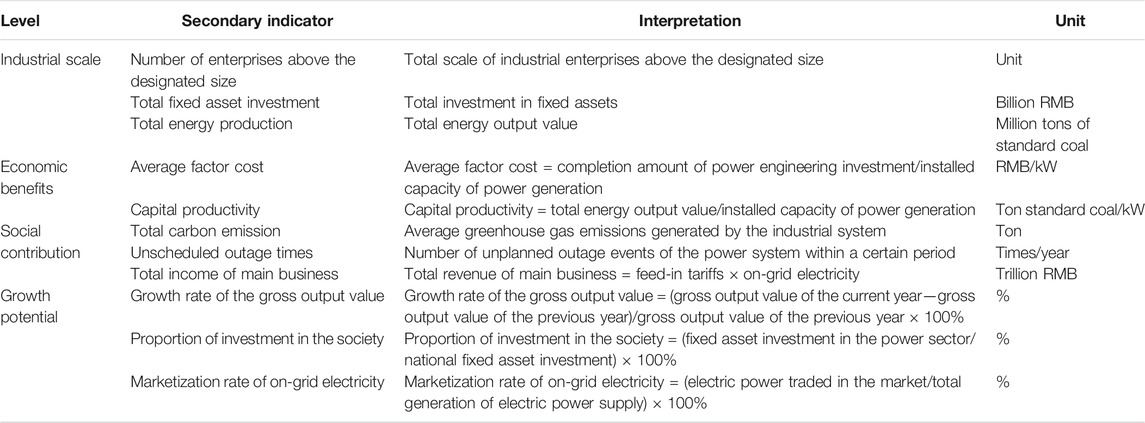
TABLE 1. Indicator system of the comprehensive development level for the conventional and nonconventional energy industries.
4.1.2 Criteria and Classification
According to the basic law of synergy, the key of the industrial system evolving from the disorder state to the order state is the internal interaction among the order parameters, which affects and determines the development trend and the evolution rules of the energy industry. The measuring tool reflecting this internal interaction is defined as the orderliness-synergy degree whose effect and level determine both the order and the structure when the industry reaches the critical region. This method can also apply to analyzing the trend of energy transition from misalignment (disorder and misadjustment) to orderliness synergy (Wu et al., 1990; Bardram, 2000). Based on the lesson learned from some relevant studies (Liu et al., 2013; Tang et al., 2018), the orderliness-synergy degree and its classification criteria can be set as displayed in Table 2.
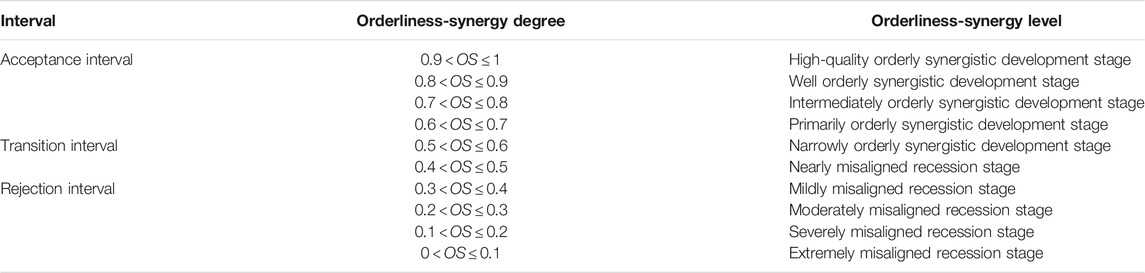
TABLE 2. Classification of industrial orderliness-synergy degree.
4.2 Data Processing
The data processing steps are as follows:
1) Increment data measurement: According to the model, the increment database can be obtained by calculating each increment value of the corresponding indicator.
2) Dimensionless processing of data: Based on Eq. 2, the stock-increment dataset should be preprocessed to obtain the original value, the stock value, and the increment value of each evaluating indicator during 2011–2018 (Table 3).
3) Data integration for the indicator value: Data integration is the process of combining dimensionless data (the stock value and the increment value) by using the method mentioned in Eq. 15 and Eq. 16 to obtain the corresponding new value.
4) Balanced weighting of indicator data: The balanced weight is set as 0.5 to obtain the linear weighted value, the nonlinear weighted value, and the stock-increment value.
5) Simulation process exploring: The stock-increment contribution coefficients of both the conventional and the nonconventional are proposed to further get the comprehensive development level of the two sub-industries.
6) Simulation based on the value assigned: According to the stock-increment attributes, 0.001 is used as the simulation change rate to measure the orderliness-synergy degree of the conventional energy industry and the nonconventional one each year.
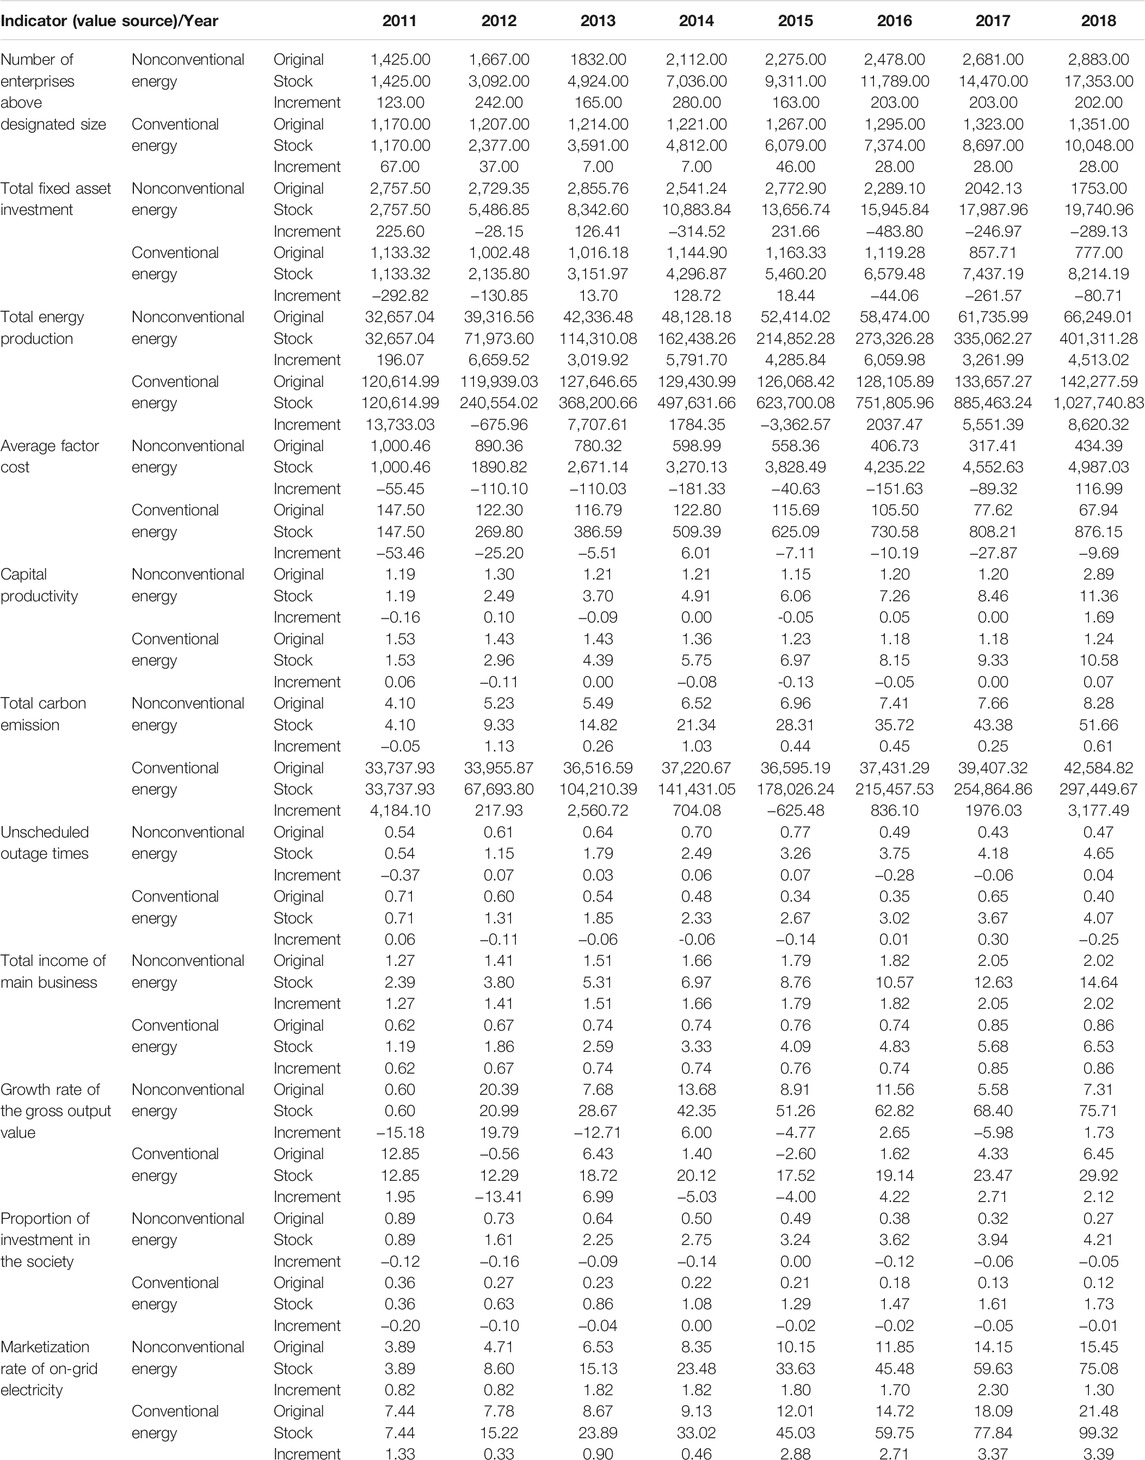
TABLE 3. Original data and stock-increment dataset of evaluating indicators.
4.3 Result Analysis
4.3.1 Orderly Synergistic Development at the Macro-Level
The comprehensive development degrees
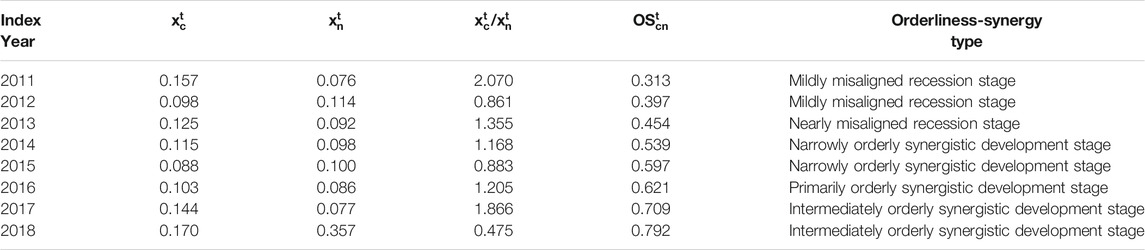
TABLE 4. Overall level of orderliness synergy between the conventional and the nonconventional in 2011–2018.
It can be seen from Table 4 that year 2012 and 2015 are special. The comprehensive development levels of nonconventional energy are 0.016 and 0.012 higher than those of conventional energy in 2012 and 2015, respectively. However, quite apart from this, in other years, the comprehensive development levels of conventional energy are higher than those of nonconventional energy. This shows that the comprehensive development of the conventional is still ahead of the nonconventional during 2011–2017. However, in 2018, the nonconventional rose sharply to 0.357, while the conventional only rose steadily to 0.170. Therefore, the conventional energy lagged behind the unconventional energy, making the fluctuation obvious during 2017–2018. There is another obvious fluctuation, mainly in 2011–2012. This fluctuation is caused basically by the decline of the new thermal power scale in 2012, the uncoordinated construction of the power grid, the reduction of total conventional energy production, and the tight state of individual periods and local areas. As a result, the conventional energy development level decreased, and the ratio fluctuated greatly. From 2012 to 2017, the ratio fluctuation is still in a stable range.
4.3.2 Orderly Synergistic Development at the Industrial Level
1) Analysis on the level of orderly synergistic development
During 2011–2018, the attribute of orderliness synergy between the two sub-industries of China are differentiated.
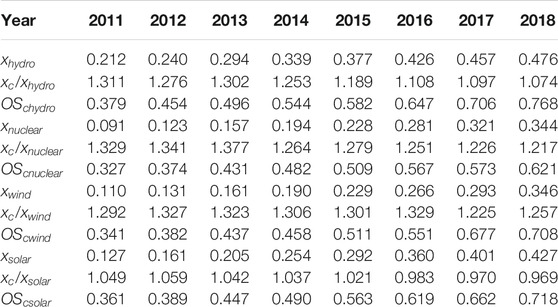
TABLE 5. Orderliness-synergy degree and ratio of development speed for both the conventional energy industry and the sub-sectors of the nonconventional energy industry in 2011–2018.
Table 5 also shows that with the input of technology, knowledge, and other intensive production factors, the demand for energy transition in the current situation is different from that in the previous situation where the conventional occupied the leading position in the past.
2) Analysis on the mode of orderly synergistic development
The institutional performance of China’s energy transition is significant; however, in terms of orderly synergistic development between the conventional and the nonconventional, neither the growth rate nor the industrial development rate has fully reflected the effect of integrated planning. The imbalanced development rates among some sectors have also led to differences in the orderly synergistic development of energy industries to a certain extent. Based on the orderliness-synergy degree and the comprehensive development level gained in 2011–2018, the orderly synergistic development process can be generally summarized into three modes (Table 5). The first mode is the fluctuating and synchronous development mode, such as the solar power sector. The second mode is the evolutionary and convergent development mode, such as the small hydropower sector. The third mode is the single and leading development mode, such as the wind power sector and the nuclear power sector. The specific classification is manifested in Figure 1.
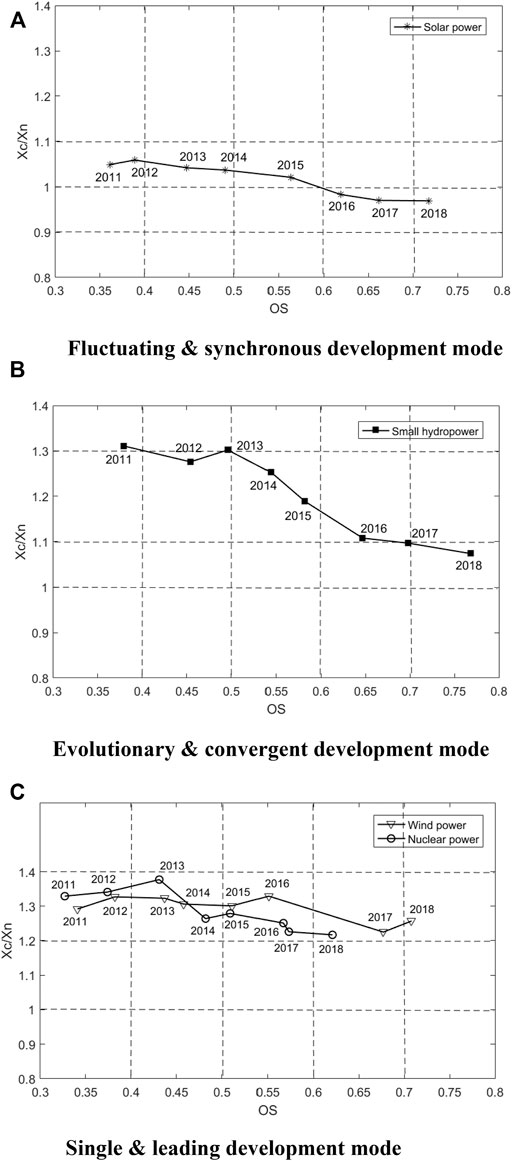
FIGURE 1. Classification of the orderly synergistic development mode. (A) Fluctuating and synchronous development mode, (B) evolutionary and convergent development mode, and (C) single and leading development mode.
We can see from Figure 1.
In the fluctuating and synchronous development mode, the comprehensive development levels of solar power during the 12th Five-Year Plan period were slightly lower than that of the conventional energy industry. During 2016–2018, however, the solar power sector had already overtaken the conventional by a small margin. In addition, the solar power eventually maintained a growth rate superior to the conventional by 2018 (Wang, 2019). At the same time, the fluctuation ranges of development level gap among the energy sectors had remained within 5% during the period except for year 2012. From the perspective of the overall development level, the solar power sector has shown an orderliness-synergy trend in accordance with expectations. In 2018, with the effective control on the installed capacity of new photovoltaic power generation and the efforts of power grid corporations increasing the accommodation of photovoltaic power, the utilization rates of solar power generators increased, while the solar curtailment rates decreased significantly. The orderliness synergy of the solar power sector in 2018 had greatly improved and entered the stage of intermediately orderly synergistic development.
In the evolutionary and convergent development mode, for the small hydropower sector, its early development was restricted by other energy sectors whose development levels were superior. In addition, then, its single-leading advantage had been weakened gradually by the orderly synergistic development with other energy sectors. In 2011–2015, the development levels of the conventional energy industry were significantly higher than that of the small hydropower sector, and the contributions of the conventional to industrial coupling were relatively high. However, in 2016–2018, with the gradual slowdown of development rate of the conventional energy industry and the steady increase of development rate of the small hydropower sector, the evolution trend of the small hydropower sector tended to be consistent with the conventional energy industry. During this period, the advantages of orderly synergistic development within the energy industry had been gradually revealed, and the orderliness-synergy degree of the small hydropower sector had been improved to the stage of intermediately orderly synergistic development by 2017. Although the growth of small hydropower gradually showed a stable trend after 2016, the overall development level of the conventional was still higher than that of the small hydropower sector.
In the single and leading development mode, the comprehensive development levels of both the wind power sector and the nuclear power sector had slightly decreased to some steady degrees, still lagging behind the conventional energy industry. In 2018, the installed capacity of nuclear power increased by 8.84 million kilowatts, which made the total installed capacity increase to 44.66 million kilowatts with a year-on-year increase of 24.7%. The investment was about 43.7 billion RMB, down for 3 consecutive years. In consideration of safety as well as economics, the annual construction scale of nuclear power should be limited and stable. Due to the unbalanced and insufficient development within China’s energy industry, the orderly synergistic development of nuclear power had failed to join the evolutionary and convergent development mode as well as the fluctuating and synchronous development mode, and the orderliness synergy of the whole nuclear sector was also weaker than these two modes. In 2018, China’s wind power sector added 20.26 million kilowatts of installed capacity, which made the total installed capacity increase to 184 million kilowatts with a year-on-year increase of 12.4%. The annual investment reached 64.2 billion RMB, which was basically unchanged during this time. The wind power industry maintained a stable development trend from 2011 to 2014 and started a new round of high-quality growth in 2015. However, there was always a serious phenomenon of wind curtailment, which made its installed capacity decline continuously from 2016 to 2017. Hence, the imbalanced development between the conventional energy industry and the nuclear as well as the wind makes the driving force insufficient and weak, which restricts the sustainable transition and high-quality development in China’s energy industry.
4.4 Simulation Analysis
According to the evaluation model with stock-increment attributes and the comprehensive development levels of these two sub-industries, the annual comprehensive development levels of stock-increment resources can be calculated, as shown in Table 6.
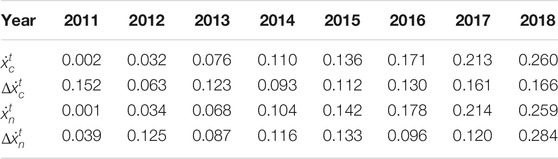
TABLE 6. Annual comprehensive development levels of stock-increment resources in 2011–2018.
Meanwhile, the contributions of both the stock resources and the increment resources to the development of two sub-industries can be measured as well (Table 7).
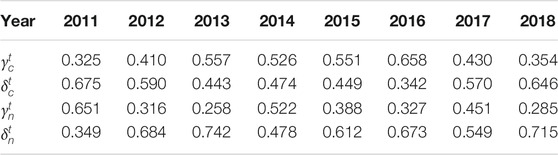
TABLE 7. Coefficients of stock increment for both the conventional and the nonconventional in 2011–2018.
We can see from Table 6 and Table 7 that 1) in terms of the effect of energy transition, the contribution of the conventional energy industry’s stock resources presents a W-shaped fluctuation trend (weak→strong→weak), while the contribution of its increment resources presents an M-shaped fluctuation trend (strong→weak→strong). From the perspective of energy mix, the complementary requirements of nonconventional energy for the conventional energy industry grew rapidly during 2011–2013, which makes the increment resources play a leading role in the development of the conventional energy industry. In the following 2014–2016, the complementary requirements of conventional energy for the nonconventional energy sectors tended to be stable, which made the increment-resource advantage stay weakened, while the stock-resource advantage is superior. The increment coefficient was larger than the stock coefficient; meanwhile, the development of the conventional energy industry’s stock resources tended to be stable during 2017–2018. 2) The contribution of the nonconventional energy industry’s stock resources to industrial development presents an N-type fluctuation trend (strong→weak→strong→weak), while the contribution of its increment resources presents a U-type fluctuation trend (weak→strong→weak→strong). At the beginning of the 12th Five-Year Plan period, the contribution coefficient of the nonconventional energy industry’s stock resources was larger than the contribution coefficient of the increment resources, reflecting that the excess capacity was gradually being accommodated. From 2012 to 2013, the contribution of the nonconventional energy industry’s stock resources to the development of the energy industry began to decrease gradually. By 2014, the stock resources had become the main driving force for the evolution and development of the nonconventional energy sector. Since 2015, the development of the nonconventional energy industry had been accelerated, and the advantage of increment resources has been significantly enhanced. A new trend of increment resource advantage was presented during 2015–2018 when many strategic emerging industries entered on the scene.
In order to further explore the evolutionary process of orderly synergistic development between the conventional and the nonconventional,
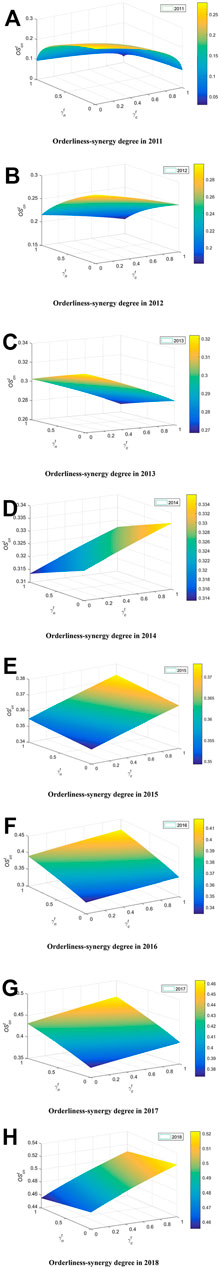
FIGURE 2. Orderliness-synergy degree
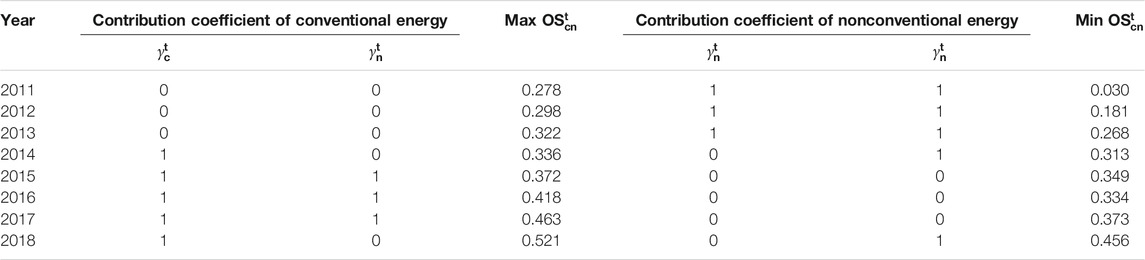
TABLE 8. Scope of orderliness-synergy degree of the conventional and the nonconventional in 2011–2018.
Table 7 and Table 8 demonstrate that in terms of the actual stock-increment coefficient values of the conventional and the nonconventional (i.e., both stock coefficients
5 Conclusion and Policy Implications
Focusing on the orderly synergistic development of energy sustainable transition, this article estimates the comprehensive development level and the orderliness-synergy degree between the conventional energy industry and the nonconventional energy industry in China during 2011–2018 with the help of theoretical modeling and empirical analysis. In order to further study the evolution trend of the energy industry’s orderliness synergy, a simulation analysis is also realized by using the stock-increment coefficient. Three key questions mentioned in the Introduction are addressed. In summary, here are the following conclusions:
1) It is possible, rational, and necessary for both the conventional and the nonconventional to achieve an orderly synergistic development in the given development environment. With the continuous promotion of China’s energy sustainable transition, the orderliness-synergy degree between the conventional energy industry and the nonconventional energy industry is increasing year by year, showing the co-adaptation effect in line with the overall planning. However, there are significant differences in both the interaction effects and the orderliness-synergy degrees within the whole energy industry at present in China. Of note, the orderliness-synergy degrees of the conventional energy industry with the wind power sector and the solar power sector are relatively higher than the degrees with the small hydropower sector and the nuclear power sector currently.
2) Industrial scale, economic benefit, social contribution, and growth potential are four important indicators useful to evaluate the energy transition process. With help of these indicators, we can see that China’s energy transition has shown a dramatic promotion in the structural upgrading of the Chinese energy industry, while the momentums of these two sub-industries show a shift from the stock–resource–contribution advantage to the increment–resource–contribution advantage. Of note, the nonconventional energy industry with many sectors has the advantage of Newcomers Prevailing, presenting the larger increment resource coefficient of its growth potential. At the same time, the development of the conventional energy industry in the stock resources has become more and more stable. As an effective resource of energy mix, the conventional energy is much easier to be planned and organized in an integrated manner, which is conducive to the orderly synergistic development with the nonconventional energy.
3) The actual stock-increment contribution coefficient values of both the conventional and the nonconventional have not reached the development expectations of industrial performances, and there is still reasonable space for the structural optimization of energy sustainable transition. It is not ideal that China’s nonconventional energy industry is evolving from the stock-oriented to the increment-oriented. Under the circumstances, the orderly synergistic development of the two sub-industries still has the potential to improve the further energy transition. Optimizing the stock energy resources as well as cultivating the increment ones will contribute to the orderly synergistic development of China’s energy industry, improve the efficiency of energy transition, and promote the realization of energy transition in the future.
Based on the conclusions, we can tell that the orderly synergistic development of the energy sustainable transition is neither conservative nor radical and as a matter of fact is mild, exploratory, and constructive. Hence, this article will put forward four policy recommendations. The novelty and originality of this research have been manifested by proving that the orderliness synergy is a very important attribute for the energy transition. Generally, we are used to measuring the performance and achievement of energy transition by calculating the energy consumption efficiency or designing the benefit games of the main interest. Through our research, however, an original measurement standard has been put forward. The Orderliness Synergy, a useful indicator to reflect both the efficiency and the equality, has been examined and confirmed. In addition, as a concrete index of efficiency and equality, the Orderliness Synergy not only measures the effect of result orientation but also emphasizes the principle of process orientation. The research results will provide a solid theoretical support and an empirical basis for the future study of energy sustainable transition for China and even for other countries in terms of pathway selection, potential assessment, governance strategies, and other issues. However, there still is inadequacy in this research: given space limitations, this article cannot fully explore the orderliness-synergy relationships. The orderly synergistic development of the energy industry with other industrial sectors was not discussed in the study. In the future, the research will be carried out further, mainly aiming at addressing the above issue and providing some technical support for the system construction, the policy making, the supervision, and implementation of the energy transition.
Data Availability Statement
The original contributions presented in the study are included in the article/Supplementary Material; further inquiries can be directed to the corresponding author.
Author Contributions
PL: supervision, conceptualization, methodology, writing, and editing. CL: data collection, writing, and reviewing. RZ: investigation and reviewing.
Funding
This paper was supported by the National Natural Science Foundation of China (Grant No. 72103128) and the Key Projects in Soft Science Research of Shanghai Science and Technology Commission (Grant No. 21692109400).
Conflict of Interest
The authors declare that the research was conducted in the absence of any commercial or financial relationships that could be construed as a potential conflict of interest.
Publisher’s Note
All claims expressed in this article are solely those of the authors and do not necessarily represent those of their affiliated organizations or those of the publisher, the editors, and the reviewers. Any product that may be evaluated in this article or claim that may be made by its manufacturer is not guaranteed or endorsed by the publisher.
References
Agyekum, E. B., Amjad, F., Mohsin, M., and Ansah, M. N. S. (2021). A Bird's Eye View of Ghana's Renewable Energy Sector Environment: A Multi-Criteria Decision-Making Approach. Utilities Policy 70, 101219. doi:10.1016/j.jup.2021.101219
Alvial-Palavicino, C., and Ureta, S. (2017). Economizing justice: Turning Equity Claims into Lower Energy Tariffs in Chile. Energy Policy 105 (JUN), 642–647. doi:10.1016/j.enpol.2017.02.013
Bardram, J. E. (2000). Temporal Coordination -On Time and Coordination of CollaborativeActivities at a Surgical Department. Comp. Supported Coop. Work (Cscw) 9 (2), 157–187. doi:10.1023/a:1008748724225
Begzjav, T. K., and Eleuch, H. (2020). Magnus Expansion Applied to a Dissipative Driven Two-Level System. Results Phys. 17, 103098. doi:10.1016/j.rinp.2020.103098
Biresselioglu, M. E., Demir, M. H., Demirbag Kaplan, M., and Solak, B. (2020). Individuals, Collectives, and Energy Transition: Analysing the Motivators and Barriers of European Decarbonisation. Energ. Res. Soc. Sci. 66 (August), 101493. doi:10.1016/j.erss.2020.101493
Chapman, A., and Itaoka, K. (2018). Curiosity, Economic and Environmental Reasoning: Public Perceptions of Liberalization and Renewable Energy Transition in Japan. Energ. Res. Soc. Sci. 37, 102–110. doi:10.1016/j.erss.2017.09.026
Chapman, A., and Okushima, S. (2019). Engendering an Inclusive Low-Carbon Energy Transition in Japan: Considering the Perspectives and Awareness of the Energy Poor. Energy Policy 135, 111017. doi:10.1016/j.enpol.2019.111017
Chen, C., Xue, B., Cai, G., Thomas, H., and Stückrad, S. (2019a). Comparing the Energy Transitions in Germany and China: Synergies and Recommendations. Energ. Rep. 5, 1249–1260. doi:10.1016/j.egyr.2019.08.087
Chen, J., Liu, Y., and Wang, L. (2019b). Research on Coupling Coordination Development for Photovoltaic Agriculture System in China. Sustainability 11 (4), 1065. doi:10.3390/su11041065
Clausen, L. T., and Rudolph, D. (2020). Renewable Energy for Sustainable Rural Development: Synergies and Mismatches. Energy Policy 138, 111289. doi:10.1016/j.enpol.2020.111289
Coester, A., Hofkes, M. W., and Papyrakis, E. (2018). An Optimal Mix of Conventional Power Systems in the Presence of Renewable Energy: A New Design for the German Electricity Market. Energy Policy 116, 312–322. doi:10.1016/j.enpol.2018.02.020
Cornelia, F., and Michèle, K. (2018). Sustainable Energy Transformations in an Age of Populism, post-truth Politics, and Local Resistance[J]. Energy Res. Soc. ence 43, 1–7. doi:10.1016/j.erss.2018.05.029
Drouilles, J., Lufkin, S., and Rey, E. (2017). Energy Transition Potential in Peri-Urban Dwellings: Assessment of Theoretical Scenarios in the Swiss Context. Energy and Buildings 148, 379–390. doi:10.1016/j.enbuild.2017.05.033
Du, C., Wang, X., and Liu, Z. (2013). Can the Coupling Coordination between Manufacturing and Producer Services Improve the Competitiveness of the Economic Circle? —Based on the Comparison of Jing-Jin-Ji Economic Circle and Yangtze River Delta Economic Circle[J]. Ind. Econ. Res. (6), 19–28. (in Chinese). doi:10.13269/j.cnki.ier.2013.06.006
Gan, L., Shi, H., Hu, Y., Lev, B., and Lan, H. (2020). Coupling Coordination Degree for Urbanization City-Industry Integration Level: Sichuan Case. Sustain. Cities Soc. 58, 102136. doi:10.1016/j.scs.2020.102136
Gielen, D., Boshell, F., Saygin, D., Bazilian, M. D., Wagner, N., and Gorini, R. (2019). The Role of Renewable Energy in the Global Energy Transformation. Energ. Strategy Rev. 24 (4), 38–50. doi:10.1016/j.esr.2019.01.006
Haddadian, G., Khodayar, M., and Shahidehpour, M. (2015). Accelerating the Global Adoption of Electric Vehicles: Barriers and Drivers. Electricity J. 28 (10), 53–68. doi:10.1016/j.tej.2015.11.011
Haley, B., Gaede, J., Winfield, M., and Love, P. (2020). From Utility Demand Side Management to Low-Carbon Transitions: Opportunities and Challenges for Energy Efficiency Governance in a new era. Energ. Res. Soc. Sci. 59, 101312. doi:10.1016/j.erss.2019.101312
Hamman, P. (2018). Local Governance of Energy Transition: Sustainability, Transactions and Social Ties. A Case Study in Northeast France[J]. Int. J. Sustain. Dev. World Ecol. (3), 1–10. doi:10.1080/13504509.2018.1471012
Healy, N., and Barry, J. (2017). Politicizing Energy justice and Energy System Transitions: Fossil Fuel Divestment and a "just Transition". Energy Policy 108 (sep), 451–459. doi:10.1016/j.enpol.2017.06.014
Hesam, G., and Yadollah, S. (2020). Energy Supply Transformation Pathways in Iran to Reduce GHG Emissions in Line with the Paris Agreement[J]. Energ. Strategy Rev. 2, 100541. doi:10.1016/j.esr.2020.100541
Hill, D., and Connelly, S. (2018). Community Energies: Exploring the Socio-Political Spatiality of Energy Transitions through the Clean Energy for Eternity Campaign in New South Wales Australia. Energ. Res. Soc. Sci. 36, 138–145. doi:10.1016/j.erss.2017.11.021
Jacobsson, S., and Lauber, V. (2006). The Politics and Policy of Energy System Transformation-Explaining the German Diffusion of Renewable Energy Technology. Energy Policy 34 (3), 256–276. doi:10.1016/j.enpol.2004.08.029
Jiang, S., Zhang, A., Meng, X., and Zhang, X. (2012). Industrial Cluster I-U-R Synergy Innovation Mechamism——case study of Baoding Area new energy& electric power transmission and distribution Cluster[J]. Stud. Sci. Sci. 30 (2), 207–212. (in Chinese).
Kirill, V., Qing, G. C., and Fedor, N. (2020). Structure orderliness assessment of grid development to improve the reliability of coal mine external electrical power Supply[J]. Electric Power Syst. Res. 183, 106–283. doi:10.1016/j.epsr.2020.106283
Kotzebue, J. R., and Weissenbacher, M. (2020). The EU's Clean Energy strategy for islands: A policy perspective on Malta's spatial governance in energy transition. Energy Policy 139, 111361. doi:10.1016/j.enpol.2020.111361
Lacey-Barnacle, M., Robison, R., and Foulds, C. (2020). Energy justice in the developing world: a review of theoretical frameworks, key research themes and policy implications. Energ. Sustain. Dev. 55, 122–138. doi:10.1016/j.esd.2020.01.010
Li, S. (2015). “The analysis of coupling coordination degree in the interactive development of manufacturing industry and logistics in the eastern coastal economic zone of China[J],” in 2015 12th International Conference on Service Systems and Service Management (ICSSSM), Huangzhou, July 30, 2015 (Guangzhou, 1–5.
Liu, P., Gao, P., and Liu, Q. (2020b). External orderliness-synergy of electric power industry in Yangtze River Delta during energy transition Period[J]. J. Clean. Prod. 280, 124381. doi:10.1016/j.jclepro.2020.124381
Liu, P. K., Peng, H., and Wang, Z. W. (2020a). Orderly-synergistic development of power generation industry: A China’s case study based on evolutionary game Model[J]. Energy 211, 118632. doi:10.1016/j.energy.2020.118632
Liu, P. K., Wang, M. B., and Chen, B. (2018). Orderly development of China’s power generation industry: An empirical analysis based on provincial layout and industrial Organization[J]. Syst. Eng. Theor. Pract. 38 (6), 1445–1464. (in Chinese). doi:10.12011/1000-6788(2018)06-1445-20
Liu, P. K., and Wang, Z. W. (2019). Is it reasonable for China to Promote “Energy Transition” Now?—An Empirical Study on the Substitution-Complementation Relationship among Energy Resources. China Soft Sci. 8 (1), 14–30. (in Chinese).
Liu, Y., Liu, J., and He, C. (2013). Evolution of the coupling relationship between regional development strength and resource environment level in China[J]. Geographical Res. 32 (3), 507–517. (in Chinese). doi:10.11821/yj2013030012
Ma, L., Shi, D., and Pei, Q. (2018). Low-carbon transformation of China's energy in 2015-2050: renewable energy development and feasible Path[J]. China Popul. Resour. Environ. 28 (02), 8–18. (in Chinese). doi:10.12062/cpre.20170916
Middleton, P. (2018). Sustainable living education: Techniques to help advance the renewable energy transformation. Solar Energy 174, 1016–1018. doi:10.1016/j.solener.2018.08.009
Mitchell, C., Bauknecht, D., and Connor, P. M. (2006). Effectiveness through risk reduction: a comparison of the renewable obligation in England and Wales and the feed-in system in Germany. Energy Policy 34 (3), 297–305. doi:10.1016/j.enpol.2004.08.004
Nguyen, H. P., and Matsuura, Y. (2016). Designing a sustainability framework for the initiation and management of coordination in an energy Exchange[J]. J. Clean. Prod. 162, S26–S34. doi:10.1016/j.jclepro.2016.04.128
Nieto, J., Carpintero, Ó., Miguel, L. J., and de Blas, I. (2020). Macroeconomic modelling under energy constraints: Global low carbon transition scenarios. Energy Policy 137 (C), 111090. doi:10.1016/j.enpol.2019.111090
Nochta, T., and Skelcher, C. (2020). Network governance in low-carbon energy transitions in European cities: A comparative analysis. Energy Policy 138, 111298. doi:10.1016/j.enpol.2020.111298
Notarnicola, B., Tassielli, G., and Renzulli, P. A. (2016). Industrial symbiosis in the Taranto industrial district: current level, constraints and potential new synergies. J. Clean. Prod. 122 (may 20), 133–143. doi:10.1016/j.jclepro.2016.02.056
Poruschi, L., and Ambrey, C. L. (2019). Energy justice, the built environment, and solar photovoltaic (PV) energy transitions in urban Australia: A dynamic panel data analysis. Energ. Res. Soc. Sci. 48, 22–32. doi:10.1016/j.erss.2018.09.008
Rupietta, C., and Backes-Gellner, U. (2017). Combining knowledge stock and knowledge flow to generate superior incremental innovation performance - Evidence from Swiss Manufacturing[J]. Econ. Edu. Working Paper Ser. 123 (4), 65–74. doi:10.5167/uzh-88572
Schürmann, K., Ernst, A., Schumann, D., and Hake, J. F. (2019). Transformation of Energy Systems as Common Projects: An Integration of Different Scientific Approaches to Address Real-World Challenges[J]. Energ. Proced. 158, 3534–3540. doi:10.1016/j.egypro.2019.01.915
Siddharth, S., and HåVard, H. (2018). Bridging socio-technical and justice aspects of sustainable energy Transitions[J]. Appl. Energ. 228, 624–632. doi:10.1016/j.apenergy.2018.06.104
Tang, X., Zhang, X., and Li, Y. (2018). Dynamic Coordination Development in China's Manufacturing and Manufacturing-related Service Industries[J]. Econ. Res. J. 53 (3), 79–93. (in Chinese).
Villa, Z. K-D., and Slijepcevic, S. (2019). Assessment of Local Councillors’ Attitudes Towards Energy Efficiency Projects in Croatia. J. Environ. Assess. Pol. Manag. 21 (04), 1999001. doi:10.1142/s1464333219500121
Wainstein, M. E., Dangerman, J., and Dangerman, S. (2019). Energy business transformation & Earth system resilience: A metabolic approach. J. Clean. Prod. 215, 854–869. doi:10.1016/j.jclepro.2018.12.258
Wang, C. C. (2019). The Impact of Financial Subsidies on the Development of Photovoltaic industry[D]. Shanghai: Shanghai Ocean University. (in Chinese).
Wang, H., and Chen, W. (2019). Modeling of energy transformation pathways under current policies, NDCs and enhanced NDCs to achieve 2-degree target. Appl. Energ. 250, 549–557. doi:10.1016/j.apenergy.2019.05.009
Wang, W., and Sun, L. (2016). Coupled Analysis Regional Innovation System and Resource City Industrial Transformation: A Case Study of Tongling City[J]. Scientia Geographica Sinica 36 (2), 204–212. (in Chinese). doi:10.13249/j.cnki.sgs.2016.02.006
Wang, Y., Ding, Z., and Yu, M. (2015). Quantitative analysis of the coordination relation between modern service industry and urbanization based on coupling model: A case study of Changshu[J]. Geographical Res. 34 (1), 97–108. (in Chinese). doi:10.11821/dlyj201501009
Wen, Y., Cai, B., Xue, Y., Wang, S., Chen, Z., Zhu, J., et al. (2018). Assessment of Power System Low-carbon Transition Pathways Based on China's Energy Revolution Strategy. Energ. Proced. 152, 1039–1044. doi:10.1016/j.egypro.2018.09.117
Wilson, C., and Tyfield, D. (2018). Critical perspectives on disruptive innovation and energy transformation. Energ. Res. Soc. Sci. 37, 211–215. doi:10.1016/j.erss.2017.10.032
Wu, D., Cao, L., and Chen, L. (1990). Synergetic Principle and Application[M]. Wuhan: Huazhong University of Science & Technology Press. (in Chinese).
Wu, X. (2017). Evaluation of Synergy Degree between New Energy Industry and Regional Economy Sustainable Development——An Empirical Analysis Based on Provincial Data[J]. Spec. Zone Economy (4), 58–62. (in Chinese).
Yan, J., Han, J., and Chen, J. (2015). Study on Mechanism of New Energy Industry Growth under the Synergetics Dynamic Perspective[J]. Sci. Techn. Manag. Res. 35 (1), 117–121. (in Chinese). doi:10.3969/j.issn.1000-7695.2015.01.023
Yuan, X.-C., Lyu, Y.-J., Wang, B., Liu, Q.-H., and Wu, Q. (2018). China's energy transition strategy at the city level: The role of renewable energy. J. Clean. Prod. 205, 980–986. doi:10.1016/j.jclepro.2018.09.162
Yun, X. (2019). Fiscal and Taxation Policies on Energy and Environment Based on CGE Modle Study on Synergistic Effects[J]. Econ. Probl. (7), 37–44. (in Chinese). doi:10.16011/j.cnki.jjwt.2019.07.005
Zhang, D., and Chen, Y. (2014). Study on Development Level and Mode of Equipment Manufacturing Industry in China[J]. J. Quantitative Tech. Econ. 31 (7), 99–114. (in Chinese). doi:10.13653/j.cnki.jqte.2014.07.007
Zhang, D., Mohsin, M., Rasheed, A. K., Chang, Y., and Taghizadeh-Hesary, F. (2021). Public spending and green economic growth in BRI region: Mediating role of green finance. Energy Policy 153, 112256. doi:10.1016/j.enpol.2021.112256
Zhang, L., Sovacool, B. K., Ren, J., and Ely, A. (2017). The Dragon awakens: Innovation, competition, and transition in the energy strategy of the People's Republic of China, 1949-2017. Energy Policy 108, 634–644. doi:10.1016/j.enpol.2017.06.027
Zhang, M. (2019). Research on Renewable Energy Development and Energy Transformation Based on International Comparison[D]. Heilongjiang: Harbin Institute of Technology. (in Chinese).
Zhao, H. (2019). International Energy Transformation. Econ. Polit. China's Energ. Security Transit. 10, 307–330. (in Chinese). doi:10.1016/b978-0-12-815152-5.00013-0
Keywords: energy transition, evaluation model, orderliness synergy, stock-increment attributes, conventional energy, nonconventional energy
Citation: Liu P, Lu C and Zhao R (2022) Research on the Orderliness Synergy Between Conventional and Nonconventional for Energy Transition in China. Front. Energy Res. 9:740088. doi: 10.3389/fenrg.2021.740088
Received: 12 July 2021; Accepted: 16 December 2021;
Published: 18 January 2022.
Edited by:
Simone Bastianoni, University of Siena, ItalyReviewed by:
Muhammad Mohsin, Jiangsu University, ChinaMuhammad Imran Rashid, University of Engineering and Technology, Lahore, Pakistan
Copyright © 2022 Liu, Lu and Zhao. This is an open-access article distributed under the terms of the Creative Commons Attribution License (CC BY). The use, distribution or reproduction in other forums is permitted, provided the original author(s) and the copyright owner(s) are credited and that the original publication in this journal is cited, in accordance with accepted academic practice. No use, distribution or reproduction is permitted which does not comply with these terms.
*Correspondence: Pingkuo Liu, cGluZ29mb3JldmVyQHNpbmEuY29t