 Zhengwei Ma
 Yuxin Yan
 Ruotong Wu
 Feixiao Li
94% of researchers rate our articles as excellent or good
Learn more about the work of our research integrity team to safeguard the quality of each article we publish.
Find out more
ORIGINAL RESEARCH article
Front. Energy Res., 20 August 2021
Sec. Sustainable Energy Systems
Volume 9 - 2021 | https://doi.org/10.3389/fenrg.2021.735665
This article is part of the Research TopicProgress Towards Achieving Cross-Regional Carbon Mitigation TargetsView all 14 articles
In recent years, the rapid increase in CO2 concentration has accelerated global warming. As a result, sea levels rise, glaciers melt, extreme weather occurs, and species become extinct. As the world’s largest CO2 emission rights trading market, EU Emissions Trading System (EU-ETS) has reached 1.855 billion tons of quotas by 2019, influencing the development of the global carbon emission market. Crude oil, as one of the major fossil energy sources in the world, its price fluctuation is bound to affect the price of carbon emission rights. Therefore, this paper aims to reveal the correlation between crude oil futures prices and carbon emission rights futures prices by studying the price fluctuation. In this paper, the linkage between West Texas Intermediate (WTI) crude oil futures prices and European carbon futures prices was investigated. In addition, this paper selects continuous data of WTI crude oil futures prices and spot prices with European carbon futures prices from January 8, 2018 to November 27, 2020, and builds a smooth transformation regression (STR) model. The relationship between crude oil futures and carbon futures prices is studied in both forward and reversal linkage through empirical analysis. The results show that crude oil futures prices and carbon futures prices have a mutual effect on each other, and both linear and nonlinear correlations between the two prices exist. Based on the results of this research, some suggestions are provided.
The global economy developed rapidly after the outbreak of the Industrial Revolution, and a large amount of energy consumption coming along, including coal, oil, and natural gas. A mass of CO2 was produced by oil burning, thus the rapid growth of CO2 emissions caused a huge impact on the global environment. After the Industrial Revolution, global CO2 concentrations rose from 240 to 415 ppm in May 2019, the first time in human history that the same concentration was reached more than 3 million years ago, as measured by the National Oceanic and Atmospheric Administration’s (NOAA) Mauna Loa Observatory (Yiming, 2019). The rapid rise in CO2 concentrations worsens global warming, which in turn caused environmental problems such as rising sea levels, inundation of coastal lowlands, melting glaciers, extreme weather, and species extinction.
Nowadays, implementing carbon reduction to combat climate change has become a world consensus. China is the largest emitter of carbon dioxide gas in the world. In 2019, China’s annual greenhouse gas emissions accounted for 27% of the world’s total, and the annual carbon dioxide emissions were 101.99 million tons. In 2020, the Chinese government proposed at the United Nations General Assembly that it would strive to achieve carbon peaking by 2030 and carbon neutrality by 2060. First of all, as a country with an energy structure dominated by high-carbon fossil, China announced that the time from completing carbon peaking to carbon neutrality is much shorter than that of developed countries. This announcement with determination and execution manifests its responsibility of great power and plays a leading role for other countries in reducing carbon emissions and developing a green and low-carbon economy. Secondly, as the world’s largest carbon emitter, China’s carbon reduction actions can help achieve carbon neutrality earlier and dramatically improve the global climate.
The EU-ETSA is the largest carbon emissions trading market in the world. By 2019, the quota for the EU Certified Emission Reduction (CER) prices in Carbon Futures Markets (hereinafter called carbon market) has reached 1,855 million tons, affecting the global carbon market. Crude oil consumption causes an increase in carbon emissions, and crude oil futures price affects carbon futures price, then the fluctuation of carbon futures price affects carbon spot price. The chart below shows the WTI futures price and the European carbon futures price from 2018 to 2020 (See Figure 1 and Figure 2). As a critical energy product, the crude oil price affects the Certified Emission Reduction prices under the EU carbon market in the following ways: first of all, crude oil price affects the natural gas price, and then the electricity price. Finally, the electricity price drives the variation of the Certified Emission Reduction prices (Kanen, 2006). It has been demonstrated in the relevant literature that crude oil futures prices correlate with Certified Emission Reduction prices. However, only a few studies are included on the specific linkage between crude oil futures and carbon futures prices. Therefore, this paper will use the STR model to conduct an in-depth research on the correlation between the two prices. The study can further clarify the relationship between carbon emission right futures and crude oil futures. At the same time, the article further analyzes the impact of carbon emission right futures trading model on reducing the use of fossil energy. This paper provides a theoretical basis for developing countries to reduce carbon emissions by means of carbon emission trading. At the same time, the conclusions reached will be helpful to provide reference experience, help solve the information asymmetry, improve the Chinese carbon trading market, and accomplish the established carbon peak and carbon-neutral goals on time, which exerts a practical significance. Meantime, the progress of the Chinese carbon market will also accelerate the global goal of carbon neutrality. Therefore, studying the price correlation between the two prices will provide references for the Chinese carbon market, and help the world achieve carbon neutrality.
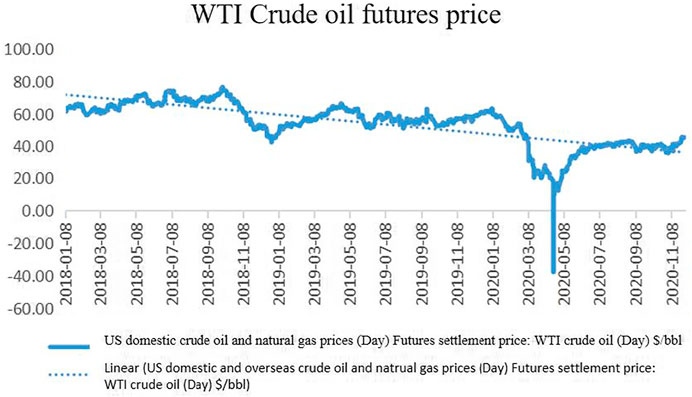
FIGURE 1. WTI Crude oil future price (2018–2020).
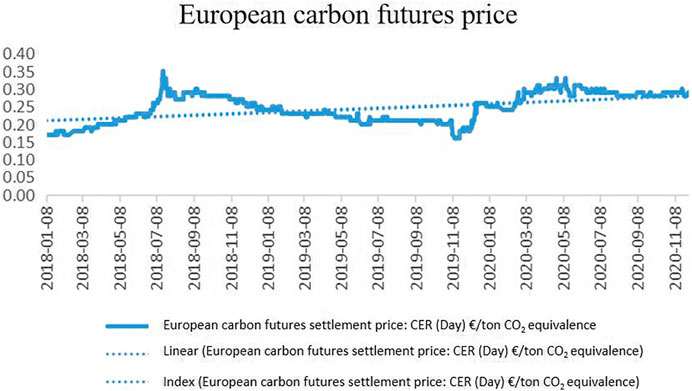
FIGURE 2. | European carbon emissions futures price (2018–2020).
European Union Allowance (EUA) means the tradable unit under the European Union Emissions Trading Scheme (EU ETS), giving the holder the right to emit one tonne of carbon dioxide (CO2), or the equivalent amount of two more powerful greenhouse gases, nitrous oxide (N2O) and perfluorocarbons (PFCs). And a Certified Emissions Reduction, also known as CER, is a certificate issued by the United Nations to member nations for preventing one tonne of carbon dioxide emissions. These are usually issued to member states for projects achieving greenhouse gas reductions through the use of Clean Development Mechanisms (CDM). CDMs make it possible for these projects to occur and set a baseline for future emission targets. Countries with developed or traditional economies (recognized as Annex 1 under the Kyoto Protocol) use CERs to help them reach their emission targets. Those nations are able to achieve their objectives and are able to set future goals as it makes the effort of reducing greenhouse gases more realistic many countries.
Crude oil futures, as the most traded commodity futures in the world, its price fluctuation has a pivotal role in the international financial market. Therefore, many scholars analyzed the influencing factors of crude oil futures prices. Li (2017) concluded that crude oil futures price is directly influenced by the positions of commodity index investors, and investor positions have a significant impact on crude oil futures yields by establishing the Markov-Switching Vector Autoregressions (MSVAR) model. Crude oil futures price as a financial derivative is influenced by the behaviors in financial markets. The investment strategy of commodity index investors is to dominate the direction of the crude oil futures market and then affecting the fluctuations in crude oil price. Guo (2018) concluded that crude oil futures price is influenced by various factors such as supply and demand, exchange rates, political relations, and international funding. Gao Meiling (2020) analyzed that crude oil supply and demand, financial, political, and unexpected events are the key factors affecting the price. Through adopting a gray relational model, Guo (2010) concluded that the crude oil production of OPEC has a negative influence on oil price; the world economic growth rate exerts a positive influence on oil price, and there exists a long-term dynamic equilibrium relationship between crude oil futures and spot price.
With the abundance of carbon financial derivatives, there comes the risk of price volatility in carbon trading. Therefore, studying the changing pattern of carbon futures prices and the influencing factors is conducive to predicting the price trend and avoiding volatility. Fewer researches about the relationship between EU carbon quotas (EUA) and international CER futures market price are included. (Chevallier, 2011) found the interaction effect between EUA and CER futures price through econometric methods, VAR model, Gran causality, and DCCMGARCH model test, and concluded that the two have a time-varying correlation. (Kanamura, 2016) employed the inverse Box-Cox F MAX curve to conclude that the relationship between EUA and CER futures price is related to the swap transactions and energy price. Through GARCH family model volatility fitting and VAR calculation, Wu (2013) found that CER and EUA futures price have a significant mutual relationship of mutual guidance in the short term, and EUA has a stronger motive force on CER futures price. Xu and Zhai (2020) conducted that when existing wide price variance between CER and EUA, firms will purchase lower-priced products, leading to an increase in demand, as well as in price. And eventually, EUA and CER prices tend to be the same. In addition, Xu Yue concluded that EUA has a leading role in CER. In addition, a strong linkage was showed. Huang (2020) utilized continuous data of EUA and CER futures settlement price to establish a GARCH model to investigate the price correlation, and the analysis obtained that EUA price exerts a negative effect on CER.
The Chinese carbon market is still in its infancy in international carbon trading, compared with the mature system formed by the European carbon trading market. Some scholars have conducted in-depth studies on the relationship between Chinese and European CER prices. Xiang and Zhong (2020) developed a VAR model to conclude that the Chinese carbon market price is primarily influenced by its price and the Euro exchange rate, and the CER price has an impact on the Chinese carbon market price than the EUA price. Through the ARCH test and GARCH-M-T model, Zhao (2016) empirically analyzed the price of carbon emission rights in Shenzhen, China, and it can be concluded that the fluctuations of CER spot yields in China are smoother than those in the international CER market, and less information lever effect appears. Wei Xue (2019) adopted principal component analysis (PCA) and stepwise regression of mediating effect model to test that a positive relationship exists between international CER price and Chinese carbon futures price. Moreover, influenced by the traditional energy price, the Chinese carbon trading price fluctuates inversely with the international CER price.
The “black gold” crude oil and carbon futures price affecting the financial market have been studied in academia, but the specific linkage between the crude oil and carbon futures price has been less studied. Some scholars have shown that a correlation existed between crude oil and carbon futures prices. Mansanet-Bataller et al. (2007) used a multiple regression model to prove that there must be a correlation between crude oil and Certified Emission Reduction prices. Chen and Li (2017) empirically analyzed that a long-term equilibrium relationship and spillover effect exist between crude oil and the carbon futures market. Kanen concluded that the process of crude oil futures price on Certified Emission Reduction prices is that oil price affects natural gas price first, then natural gas price influences electricity price, and finally, electricity price affects Certified Emission Reduction prices. Through adopting the DCC-MGARCH model, Wang (2021) concluded that a significant mutual volatility spillover effect exists among natural gas, crude oil futures, and coking coal futures markets. Zhao (2012) employed cointegration theory, and the Granger causality test to conclude that a cointegration relationship exists between energy and carbon futures prices, and a causal relationship between natural gas price, electricity price, and carbon futures price.
Li (2018) made a conclusion by adopting the Engle-Granger cointegration test that there is a long-term equilibrium relationship and a short-term dynamic relationship between carbon futures and spot price. In addition, it can be drawn that carbon spot prices can be predicted according to futures price market. Bredin and Parsons (2016) came to a conclusion that carbon spot subsidies became cheaper relative to futures, and carbon futures price were higher than the hedge price defined by spot price with increasing interest rates. Modeling carbon spot and futures through GARCH models and conducting causality tests, Zeitlberger and Alexander (2016) concluded that lagged carbon futures yields have effects on spot yields, that is, the carbon futures market leads the way for the spot market and provides valuable information for spot yields. The fact that carbon futures trading volume is much larger than the spot market validates the conclusion.
Based on the correlation between crude oil and Certified Emission Reduction prices and the correlation between crude oil and carbon futures market, this paper will use crude oil-fossil energy (natural gas, coal)-electricity-carbon as a simulated industry chain to conduct an intensive study on the linkage between crude oil and carbon futures. In this paper, WTI crude oil price and European carbon futures are selected as subjects, and three variables, WTI futures settlement price, WTI spot settlement price (using Tapis spot settlement price data as a proxy) and European carbon futures settlement price, are substituted into a smoothed transformation regression model (STR) to analyze the price correlation between WTI crude oil futures and European carbon futures.
Oil price is the primary indicator in the energy market, and almost all other energy product prices are influenced by oil prices, including natural gas and coal. Natural gas is a clean energy source for power generation, and coal is a cheap and highly carbon-emitting energy source for power generation. Studies have shown that natural gas and carbon market, coal, and carbon market are significantly correlated. The price of natural gas and coal affects the price of carbon through its impact on the price of electricity.
Based on this theory, the above relationship can be considered as an industrial chain, and the chain relationship diagram is established as follows (See Figure 3):
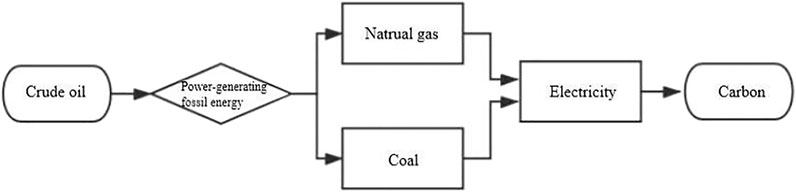
FIGURE 3. Industrial chain relationship between crude oil and carbon emission rights.
In economic terms, crude oil and natural gas can be defined as substitutes for each other. When oil price falls, the price advantage of natural gas is weakened, resulting in lower demand and lower price for natural gas. In addition, the price of crude oil and natural gas is a mutual relationship with consistent changes. Natural gas prices can affect electricity prices and ultimately lead to price changes in carbon trading. Crude oil and coal are both disposable fossil energy sources and can substitute for each other. When oil price falls, crude oil demand rises and coal demand decreases, leading to lower coal prices. Moreover, oil price determines production costs in the coal chemical industry, which in turn affects coal price. Therefore, the forward linkage of oil-gas (coal)-electricity-carbon can be viewed as an industrial chain. Since it is known that both crude oil and carbon futures price are based on their spot price, the following theoretical relation is set:
In the relation, PCER refers to the European carbon futures price; Pyy refers to the WTI crude oil futures price; α0 and α1 refer to the variable coefficients, and ε1 refers to the error term.
Based on the simulated chain relationship established by the cis-linkage, it can be inferred that carbon, as a downstream product of the chain, can affect natural gas (coal) price through electricity price, which eventually drives the crude oil price changes of the upstream product. In other words, the Certified Emission Reduction prices in the downstream products of the chain can be counteracted by crude oil prices upstream. Based on this inference, the following relationship is assumed (WTI spot price data substituted with Tapis spot price)
In the relation, Pyy refers to the WTI crude oil futures price; PCER refers to the European carbon futures price; Pxyy refers to the crude oil spot price; α0, α1, α2 refer to the variable coefficients, and ε2 refers to the error term.
Based on the above assumptions of the simulated industry chain and the theoretical model, this paper adopts the STR model to analyze the correlation between WTI crude oil and European carbon futures prices.
The weekly data used in the empirical analysis were collected from the WIND financial database and taken as the study interval from January 8, 2018 to May 27, 2020. The three variables include WTI futures weekly price, WTI spot weekly price (WTI spot price data substituted with Tapis spot price), and European carbon futures weekly prices. WTI crude oil and carbon futures prices are selected from the closing price of the day, and the spot price is an average level of the day. To unify the price units, the price should be converted to United States dollars. In addition, the missing values were replaced by SPSS after deleting the mismatched data to ensure that the three variables correspond to their price dates. At last, a total of 1993 groups of data were obtained after processing.
To ensure data stationery, the crude oil futures price sequence, spot price sequence, and carbon futures price sequence are taken as logarithms and denoted as lnPyy, ln Pxyy, and lnPCER respectively.
In this paper, crude oil futures price, crude oil spot price and carbon futures price are selected as continuous data on the time axis, and the nonlinear correlation between them is primarily studied. Therefore, a typical nonlinear time sequence model STR is adopted in model construction.
In the form, yt refers to the explained variable; 'zt refers to the vector of explained variable; φ' refers to the matrix of coefficient parameters; G(st,γ,c) refers to the transformation function or switching function; st refers to the transformation variable or switching variable (the variable causing the nonlinear correlation), γ refers to the slope parameter or adjustment parameter (the degree of transformation of the nonlinear correlation); c refers to the position parameter (the timing of generating the nonlinear correlation), and εt refers to the white noise.
1) Select the appropriate auto-regressive lag order to construct a dynamic linear model, and then obtain a regression residual sequence;
2) Utilize the obtained residual sequence to perform third-order Taylor expansion on the conversion function at y = 0 and construct an auxiliary regression model, and then perform sequential tests on the coefficients of the regression equation to determine non-linearity and the form of the conversion function;
3) Estimate the parameters;
4) Test model stationary
The ADF test was employed to perform a unit root test for stationary of each indicator sequence, with the original hypothesis of the existence of a unit root, and a stationary sequence if the original hypothesis was rejected. After taking the logarithm of three variables, it turns to the selection of the lag order (I to IV). The ADF lag of three orders was selected for the test because the AIC and SC values were the smallest at the third order.
The test results are shown in Table 1. Judging the significance coefficient, it can be seen that the original sequence is not significant, while the first-order difference price sequence is very significant. The original price sequence is non-stationary and the first-order difference price sequence is stationary.
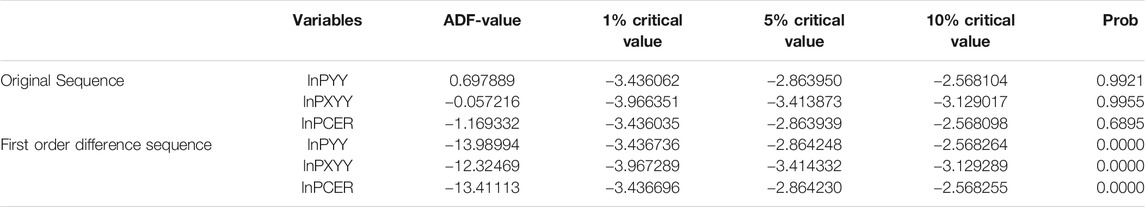
TABLE 1. Stationary test results.
If H04 is rejected instead of H01, or H02, H03, H02 are rejected in turn and the p-value of rejecting H03 is not the minimum, the LSTR1 model should be selected, otherwise the LSTR2.
The JMulTi was used to perform the nonlinearity test, the judgment principle is that the variable with the smallest p value is the optimal conversion variable. And the results in Table 2 show that the four F-statistics p-values are relatively minimal when the conversion variable is lypyy(t). Therefore, the optimal conversion variable suggested by JMulTi is the original order of crude oil futures (lnpyy(t)), and the optimal conversion function model is LSTR1.
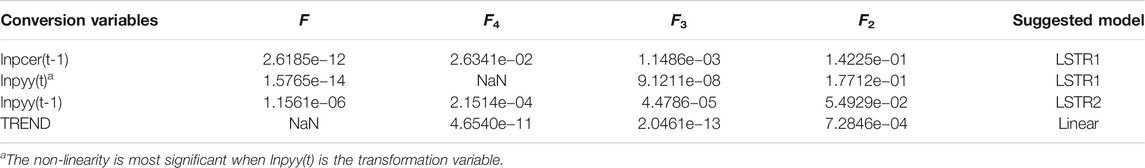
TABLE 2. Nonlinear test results.
After selecting the optimal transformation variable and model, the parameters of the STR model were estimated. Table 3 shows that the smoothing parameter (gamma) is 3.70655 and the results are highly significant at a p-value of 0. The transformation regime is more pronounced. After removing the variable lnpyy (t-1), which has no significant linear relationship with a p-value of 0.65519, the three variables we got in Table 3 are obtained with significant relationships.
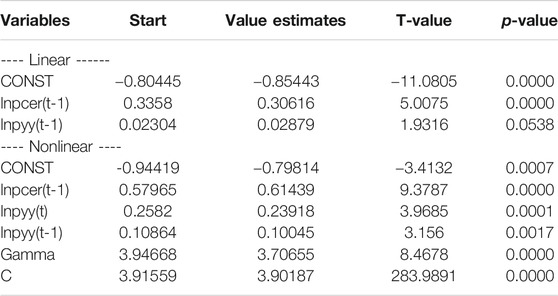
TABLE 3. Parameter estimation results.
Based on the results shown in Table 3, the form of LSTR1 is obtained as follows:
When selected transformation variable as lnpyy(t), the position parameter c can be determined as 3.90187. When the transformation variable is lethan the position parameter, the crude oil futures price has a positive linear effect on the carbon futures price; conversely, the positive relationship weakens and the non-linear part will act stronger.
Table 4 shows the test results after JMulTi. When the transformed variables are lnpyy(t-1), lnpcer(t), lnpxyy(t-1), lnpcer(t-1), lnpxyy(t-2), and lnpcer(t-2), the results are linear models with no nonlinearities due to the insignificant p-values of the F-test effect. Therefore, only lnpxyy(t) can be used as a transformation variable, and the optimal functional model is LSTR1.
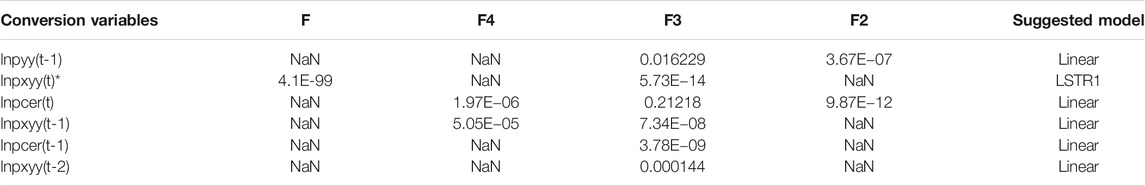
TABLE 4. Non-linear test results.
LSTR1 model was selected, then the model was continued with parameter estimation using JMulTi. Parameter estimates and significance results for linear and nonlinear parts are obtained. According to Table 5, the form of the model can be concluded as follows:
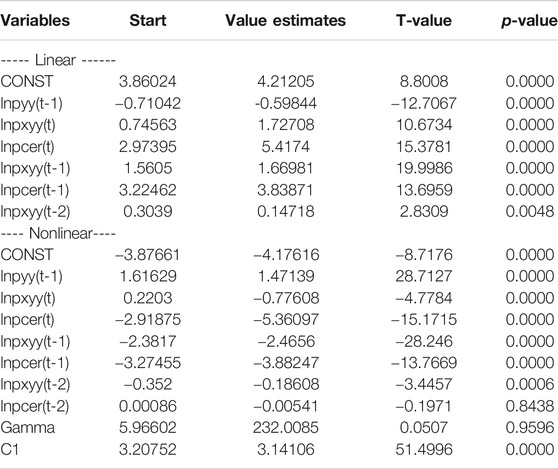
TABLE 5. Parameter estimation results.
4.21205–0.59844lnpyy(t-1)+1.72708lnpxyy(t)+5.41740lnpcer(t)+1.66981lnpxyy(t-1)+3.83871lnpcer(t-1)+0.14718lnpxyy(t-2)-(4.17616–1.47139lnpyy(t-1)+0.77608lnpxyy(t)+5.36097lnpcer(t)+2.46560lnpxyy(t-1)+3.88247lnpcer(t-1)+0.18608lnpxyy(t-2)+0.00541lnpcer(t-2))G(st,γ,c)
The smoothing parameter (gamma) is 232.00853, which indicates that the slope of the transition function is large, i.e., the speed of transition between different regimes of the model is fast. After selecting the transformation variable as lnpxyy(t), the unknown parameter c can be confirmed as 3.14106. At the 1% significant level, the carbon futures price has a positive linear effect on crude oil futures price; the nonlinear relationship is enhanced when the value of the transformed variable is stronger than the location parameter. The positive linear effect of carbon futures price on crude oil futures price diminishes.
1) The assumed theory that crude oil price affecting Certified Emission Reduction (CER) prices in the simulated chain crude oil-natural gas (coal)-electricity-carbon holds. In this industrial chain, the correlation between the crude oil and carbon product price can be transmitted through the futures market transaction and reflected in the corresponding price in the futures bottle. The results show that the relationship between the price series of crude oil futures and carbon futures is not only linear, but also nonlinear.
2) There is a long-term linear and nonlinear bidirectional relationship between crude oil futures and carbon futures market. The linkage between crude oil and carbon futures prices is a reversible mutual relationship, and the relationship between the two prices is tested to be highly significant.
3) In the product linkage analysis, there are both positive effects and nonlinear linear effects. Without considering the nonlinear effect, crude oil futures has a positive price linkage effect on carbon futures. When considering the nonlinear effect, the nonlinear effect will weaken the positive effect of the linear relationship. But generally speaking, crude oil futures have a positive impact on carbon futures, which is consistent with the price transmission in the spot market. In the reverse linkage, carbon futures price has a positive linear effect on crude oil futures price, and there is also a nonlinear relationship.
The climate problem brought by the massive emission of global carbon dioxide is becoming increasingly serious. Carbon emission reduction has attracted global attention, and carbon neutrality will be the goal for all countries. Carbon trading will form a brand new carbon financial market, which is a great challenge and opportunity. At present, China’s carbon trading market is gradually developing. Through further studying on the price information of global carbon market, the disadvantages caused by the information asymmetry in China’s carbon market will be improved, and the carbon market mechanism and carbon pricing will be enhanced.
1) Carbon emissions are mostly caused by energy activities, including the utilization of crude oil and coal. The above empirical evidence shows that the crude oil price has a significant impact on the Certified Emission Reduction prices. Therefore, the government can refer to the trend of crude oil price and the correlation between crude oil and carbon market when regulating carbon pricing and formulating carbon market related regulation policies, so as to avoid the risk in Certified Emission Reduction prices fluctuation.
2) Studies have shown that coal can ultimately contribute to the Certified Emission Reduction prices by influencing the electricity price. The development and utilization of new energy sources will play a crucial role in achieving carbon neutrality in the future. New energy generation methods such as photo-voltaic, wind power and nuclear power can be gradually implemented to reduce carbon emissions caused by power generation.
3) Early in 2011, China started carbon trading pilot projects in Shenzhen, Shanghai, Beijing, Guangzhou, and other areas. At present, China’s carbon trading market is still less active than Europe, and the carbon trading price is lower than the EU. In the future, China should keep improving the carbon trading market system and reasonably price carbon quotas. China should invest more in the carbon market and develop carbon futures and other financial derivatives to stimulate carbon trading activity.
4) The world has entered a new phase of globalization, carbon emission control requires global participation and practical actions. As a developing country, China takes the lead in committing to the carbon neutrality goal and leads the transformation with practical actions, which can drive the global technological innovation to achieve the carbon neutrality goal and create a good atmosphere for global climate governance.
China has pledged to the world that it will reach the goal of carbon neutrality by 2060. It means that China will accomplish a tremendous carbon emission reduction task. As a major carbon emitter, China plays a leading role in the world, and the achievement of the carbon emission reduction target will vigorously promote the achievement of the world carbon neutrality target.
The original contributions presented in the study are included in the article/supplementary material, further inquiries can be directed to the corresponding author/s.
ZM contributed to the conception of the study; YY contributed significantly to analysis and manuscript preparation; RW and FL helped perform the analysis with constructive discussions.
The National Social Science Foundation is the main channel for China to support basic research in the field of scientific research. It is oriented to the whole country and focuses on funding researchers in universities and scientific research institutions with good research conditions and research strength. And the project was sponsored by National Social Science Fund of China (Grant Number: 18BJY251).
The authors declare that the research was conducted in the absence of any commercial or financial relationships that could be construed as a potential conflict of interest.
All claims expressed in this article are solely those of the authors and do not necessarily represent those of their affiliated organizations, or those of the publisher, the editors and the reviewers. Any product that may be evaluated in this article, or claim that may be made by its manufacturer, is not guaranteed or endorsed by the publisher.
I would like to express my deepest appreciation to all who have helped me complete this study.
Bredin, D., and Parsons, J. (2016). Why Is Spot Carbon So Cheap and Future Carbon So Dear? the Term Structure of Carbon Prices[J]. Energ. J. 37 (3), 83–107. doi:10.5547/01956574.37.3.dbre
Chen, Q., and Li, D. (2017). Research on the Correlation between EU Carbon Quota Market and Crude Oil Market[J]. J. Fuqing Branch Fujian Normal Univ. (05), 93–98. doi:10.3969/j.issn.1008-3421.2017.05.017
Chevallier, J. (2011). Anticipating Correlations between EUAs and CERs: A Dynamic Conditional Correlation GARCH Model [J]. Econ. Bull. 31 (1), 255–272.
Guo, Q. (2010). The Study on Formation Mechanism and Fluctuating Factors of International Crude Oil Price[D]. Tianjin: Tianjin University.
Guo, J. (2018). Analysis of Factors Influencing Crude Oil Futures Price[. J].Co-Operative Econ. Sci. (18), 66–67. doi:10.3969/j.issn.1672-190X.2018.18.024
Huang, J. (2020). Research on Price Fluctuation, Correlation and Enlightenment of Carbon Futures: Taking the EU Carbon Futures Market as an Example[J]. Econ. Probl. 22 (05), 63–70. doi:10.16011/j.cnki.jjwt.2020.05.012
Kanamura, T. (2016). Role of Carbon Swap Trading and Energy Prices in price Correlations and Volatilities between Carbon Markets. Energ. Econ. 54, 204–212. doi:10.1016/j.eneco.2015.10.016
Li, H. (2017). Research on the Impact of Commodity Index Investors on Crude Oil Futures Price Volatility [D]. Wuhan: Wuhan University.
Li, Y. (2018). Research on the Correlation between EU Carbon Quota Futures and Spot Price[J]. China J. Commer. (21), 48–49. doi:10.19699/j.cnki.issn2096-0298.2018.21.048
Mansanet-Bataller, M., Pardo, A., and Valor, E. (2007). CO 2 Prices, Energy and Weather[J]. Energ. J. 28 (3), 73–92. doi:10.5547/issn0195-6574-ej-vol28-no3-5
Meiling, G. (2020). Study on Influencing Factors of international crude oil futures price fluctuation [J]. Economic outlook around the Bohai Sea 2 (5), 173–174doi:10.16457/j.cnki.hbhjjlw.2020.05.114
Wang, X. (2021). The Spillover Effect between Natural Gas and Alternative Energy in Xinjiang-Research Based on DCC-MGARCH [J/OL]. 1-15. Development Finance Research (Accessed on 05 31, 2021). doi:10.16556/j.cnki.kfxjr.20200721.001
Wu, P. (2013). Research on Risk Measuring and Interaction of Carbon Futures under EU-ETS[D]. Kunming: Yunnan Normal University.
Xiang, W., and Zhong, C. (2020). Research on the Factors Affecting China’s Carbon Market Price[J]. J. Chongqing Univ. Technol.(Natural Sci.) 34 (10), 259–265. doi:10.3969/j.issn.1674-8425(z).2020.10.035
Xu, Y., and Zhai, T. (2020). Interaction Effect of Carbon Markets under the Background of UN Climate Negotiations: Based on EUA and CER Markets[J]. Ecol. Economy 36 (06), 19–26.
Xue, W. (2019). Traditional Energy Price, International CER Price and China’s Carbon Trading Price[D]. Xi’an: Xi’an Shiyou University.
Yi, M. (2019). Record Breaking Carbon Dioxide Concentration [J]. Glob. Sci. (16), 10–14. Available at https://d.wanfangdata.com.cn/periodical/ChlQZXJpb2RpY2FsQ0hJTmV3UzIwMjEwNzIzEhdRS1YyMDE5MjAxOTEwMTcwMDExMzU2ORoIbDduMW9sbWg%3D.
Zeitlberger, A. C. M., and Brauneis, A. (2016). Modeling Carbon Spot and Futures price Returns with GARCH and Markov Switching GARCH Models. Cent. Eur. J. Oper. Res. 24 (1), 149–176. doi:10.1007/s10100-014-0340-0
Zhao, J. (2012). Research on EU Carbon Futures Price and Energy Price[J]. Finance Econ. (14), 92–94. doi:10.3969/j.issn.1007-0753.2012.07.038
Keywords: carbon neutral, WTI crude oil, European carbon futures, STR model, non-linear relationship
Citation: Ma Z, Yan Y, Wu R and Li F (2021) Research on the Correlation Between WTI Crude Oil Futures Price and European Carbon Futures Price. Front. Energy Res. 9:735665. doi: 10.3389/fenrg.2021.735665
Received: 03 July 2021; Accepted: 03 August 2021;
Published: 20 August 2021.
Edited by:
Kangyin Dong, University of International Business and Economics, ChinaReviewed by:
James Wu, Golden Gate University, United StatesCopyright © 2021 Ma, Yan, Wu and Li. This is an open-access article distributed under the terms of the Creative Commons Attribution License (CC BY). The use, distribution or reproduction in other forums is permitted, provided the original author(s) and the copyright owner(s) are credited and that the original publication in this journal is cited, in accordance with accepted academic practice. No use, distribution or reproduction is permitted which does not comply with these terms.
*Correspondence: Zhengwei Ma, bWFfemhlbmd3ZWlAMTYzLmNvbQ==
Disclaimer: All claims expressed in this article are solely those of the authors and do not necessarily represent those of their affiliated organizations, or those of the publisher, the editors and the reviewers. Any product that may be evaluated in this article or claim that may be made by its manufacturer is not guaranteed or endorsed by the publisher.
Research integrity at Frontiers
Learn more about the work of our research integrity team to safeguard the quality of each article we publish.