 Elias Hartvigsson
 Niklas Jakobsson
 Maria Taljegard
 Mikael Odenberger
- Department of Space Earth and the Environment, Chalmers University of Technology, Gothenburg, Sweden
Electrification of transportation using electric vehicles has a large potential to reduce transport related emissions but could potentially cause issues in generation and distribution of electricity. This study uses GPS measured driving patterns from conventional gasoline and diesel cars in western Sweden and Seattle, United States, to estimate and analyze expected charging coincidence assuming these driving patterns were the same for electric vehicles. The results show that the electric vehicle charging power demand in western Sweden and Seattle is 50–183% higher compared to studies that were relying on national household travel surveys in Sweden and United States. The after-coincidence charging power demand from GPS measured driving behavior converges at 1.8 kW or lower for Sweden and at 2.1 kW or lower for the United States The results show that nominal charging power has the largest impact on after-coincidence charging power demand, followed by the vehicle’s electricity consumption and lastly the charging location. We also find that the reduction in charging demand, when charging is moved in time, is largest for few vehicles and reduces as the number of vehicles increase. Our results are important when analyzing the impact from large scale introduction of electric vehicles on electricity distribution and generation.
Introduction
The transport sector is to 96% dependent on fossil fuels, making the sector the least energy-diversified of all sectors in terms of primary energy supply (International Energy Agency, 2018). In order to achieve global and European climate targets limiting global warming to 1.5–2°C (European Commission, 2011; UNFCC, 2015), the road transport sector needs to reduce its associated greenhouse gas emissions. Electric vehicles (EVs) are one option to cut emissions in the road transport sector. An increased battery energy density, reduced battery cost and an extended charging network have made investments in EV more attractive for potential customers during the last years. As a consequence of this, there has been a fast increase in EV sales (Edison Electric Institute, 2019). Following several years of strong growth the global number of EVs reached more than 5 million in 2018 (International Energy Agency, 2018, 2019). The International Energy Agency (IEA) estimates that the number of EVs will keep on increasing, and reach 130–250 million globally by 2030 (International Energy Agency, 2019). The global electricity demand is predicted by the IEA to increase by 640–1,100 TWh by 2030 as a consequence of EV charging. The largest group of vehicles in most countries are passenger vehicles, which corresponds to roughly 90% of all vehicles in Sweden (Statistics Sweden, 2019) and 46% in the United States (International Organization of Motor Vehicle Manufacturers, 2015). The low value of passenger cars in the United States is likely caused by the ambiguous definition. According to the International Organization of Motor Vehicles pickup trucks may be considered as passenger or commercial vehicles. The share of vehicles used by households for personal transportation is therefore likely higher than 46% in the United States. Most passenger vehicles are privately owned, and a significant part of the charging is likely to take place at residential properties (Morrissey et al., 2016; Charilaos et al., 2017).
A large-scale diffusion of EVs can cause grid issues if the charging occurs when there is a capacity deficit in the grid (Muratori, 2018). EVs often utilize charging rates with high power levels when compared to other household loads. If these EV charging demands coincide with the current demand for electricity in households, or are independently large enough, it can cause issues in the current electricity distribution systems (Hable et al., 2010; Putrus et al., 2009). However, EVs can also be a resource for the grid by storing electricity that can be discharged back to the grid at certain critical hours, so-called vehicle-to-grid (V2G) (Lazzeroni et al., 2019). Battery electric vehicles (BEV) can thereby support the grid by providing ancillary services, voltage stabilization and peak shaving (Sortomme and El-Sharkawi, 2012; Sarabi et al., 2016). The potential grid issues and benefits that EVs can provide are to a large extent dependent on which charging strategy that is used. Studies investigating different charging strategies have focused on reducing grid impacts (Richardson et al., 2012), market controlled strategies (Alipour et al., 2017), or a mix of these (Sortomme and El-Sharkawi, 2011). Some charging strategies that focus on reducing grid impact do not only include when charging takes place, but also the geographical localization of the charging (Faridimehr et al., 2019).
Studies on charging strategies rely on, and the results are sensitive to, assumptions on what time charging occurs for individual vehicles (Shepero et al., 2018). Data on when charging occur is generally obtained from either statistical distributions of charging (Faridimehr et al., 2019; Rezaee et al., 2013) or from travel surveys on driving patterns (Babrowski et al., 2014; Schuller et al., 2014). Travel surveys often only capture travel behavior for a few days or the travel patterns of a typical day and rely on respondents to accurately estimate their departure time, arrival time and distance traveled. The availability of National Households Travel Surveys (NHTS) have led them to be a common data source for estimating driving and charging patterns (Crozier et al., 2020; Jahangir et al., 2019; Li et al., 2020; Wu et al., 2019; Y. Liu et al., 2018; Chen et al., 2017; Yi et al., 2020; Wei et al., 2021). Using the National Household Travel Survey (NHTS) in Sweden, Liu et al. (2014) estimated charging demand in Sweden to be about 0.4 kW/vehicle. In the United States, Wu et al. (2011) analyzed NHTS data to estimate charging demand in the United States to be approximately 0.6 kW/vehicle. Zhang et al. (2020) used NHTS data to model different daily load profiles in the United States depending on age groups. They found that age of drivers and their education had important impacts on charging behavior. Using NHTS data, Ramos Muñoz and Jabbari (2020) proposed a smart charging protocol for work place charging that reduced overall power demand. Similarly, Li et al. (2020) used NHTS data to show that smart charging could reduce operating costs. An issue with studies relying on NHTS data is that the data haven’t been validated with measured driving behavior and as such the uncertainty using NHTS data is unknown.
An alternative to NHTS datasets for estimating charging is datasets on EV charging from public and private charging stations (Hardinghaus et al., 2020; Zachary et al., 2019; Kezunovic et al., 2020; Huber et al., 2020; Almaghrebi et al., 2020; Noussan and Neirotti, 2020). Using data from public charging points in Berlin, Hardinghaus et al. (2020) found the utilization of charging points to be similar even though the charging points were distributed unequally in the city. Investigating emissions from EVs and using data from public and private chargers in Germany, Noussan and Neirotti (2020) found that the influence of charging strategy had a limited impact on emissions. One issue with datasets that rely on data public charging stations is that these do not keep track of individual vehicles, and as such fail to track individual vehicle’s behavior. This makes it difficult to draw conclusions on driving and charging patterns during large scale BEV adoptions. In addition, datasets using public and private charging are often conducted by collecting data from BEV owners that are early adopters and represents households with higher than average income and education levels (Harris and Webber, 2014), and does not represent the overall population when reaching large scale market penetration of EVs.
A third option for estimating charging behavior is to use Global Positioning System (GPS) to track driving patterns of specific vehicles (Yang et al., 2017; Q. Liu et al., 2019; Pearre et al., 2011). GPS tracking can capture driving patterns for several weeks or months in a row, but may require additional resources for tracking, collecting and analyzing data, which can be a barrier for collecting sufficiently representative data. The main benefit of GPS measured driving data is that this type of data gives first-hand information about actual driving patterns for an individual vehicle. This can be compared to data collected through questionnaires, travel surveys or assumptions on statistical distributions which are either second-hand information or in the case of probability distributions, based on assumptions of the driving patterns. As such, GPS measured driving behavior can also reveal individual variations and how these variations might affect charging power demand. Several datasets of GPS measurements with conventional cars exist, but have mainly been used to study driving behavior (Dong et al., 2014), EV battery size requirements (Pearre et al., 2011; Björnsson and Karlsson, 2015) and impacts on investments in the electricity system (Taljegard et al., 2019). Pearre et al. (2011) used a GPS measured database from Atlanta in the United States to estimate battery sizes needed to fulfill certain number of recorded trips. Dong et al. (2014) used a GPS measured dataset from the greater Seattle region to analyze impacts from public charging on share of the distances that can be driven by an EV. Björnsson and Karlsson (2015) and Jakobsson et al. (2016) used a dataset of GPS measured representative driving profiles for a region in Sweden to analyze the potential of EVs for substituting fossil fueled vehicles and what battery sizes that are required to meet the driving demand using the measured driving patterns.
However, none of the aforementioned GPS based datasets have been used to analyze possible impacts of GPS measured driving behavior on EV charging power demand. Previous estimates of charging power demand have relied on NHTS data or assumptions and have therefore not been validated against measured driving behavior. This study aims to fill this research gap, and contribute to current literature, by calculating and analyzing the EV charging power demand using GPS measured driving data. To produce accurate estimates for multiple EVs the study focuses on after-coincidence charging power demand while excluding coincidence with other residential loads. Coincidence is the likelihood of two events occurring simultaneously. After-coincidence charging power demand therefore consider the likelihood of charging occurring simultaneously. After-coincidence charging power demand is relevant when considering multiple EVs. Specifically, this study aims to answer the following questions: what is the after-coincidence charging power demand for EVs when using GPS measured data? And, is there a significant difference between the EV charging power demand when using GPS measured data and questionnaire based data?
Materials and Methods
The Materials and Methods section is divided into three subsections. First, we outline the method for calculating after-coincidence charging power demand from the GPS measured driving behavior (Methods section). Second, we present three different charging scenarios which are investigated (Scenarios section). Third, we present a detailed description of the GPS measurement datasets (Data section).
Methods
The process of calculating after-coincidence charging power demand is outlined below, and is shown as a flowchart in Figure 1. To estimate the charging power demand from EV, the likelihood of the charging events to occur simultaneously is needed. This likelihood is commonly referred to as coincidence in electric power systems. Coincidence is often implemented in power systems using a coincidence factor ranging from 0 to 1. The coincidence factor is commonly used when designing electric power systems and is necessary when doing power system analysis of EV charging. The coincidence factor is defined as the ratio between maximum measured power and rated power of the equipment or load considered, and as such describe the hour with the highest net power demand. For EV charging the coincidence factor can be calculated as
where P is the rated charging power,
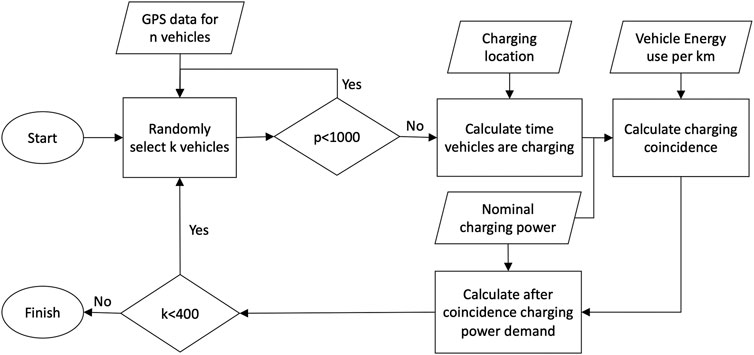
FIGURE 1. Flowchart of the process to calculate after-coincidence charging power demand from the GPS measured driving behavior.
The coincidence factor can show significant variation depending on which individual vehicles that are included in the calculation and it is therefore important to consider different combinations of vehicles. The number of combinations of k vehicles in a dataset of n vehicles are
The amount of electricity that is consumed by the vehicles between two charging occasions is calculated based on the measured driving distance and a given vehicle electricity consumption rate per km (see Eq. 3). The vehicle electricity consumption is amongst other dependent on aerodynamics, auxiliary services in the vehicle and the vehicle’s speed. It is assumed that a vehicle starts charging as soon as it arrives at its charging location. No specific battery size is assumed and charging is done until the vehicle leaves for a new trip or the accumulated energy from all previous trips is zero. This happens when the vehicle has been charged sufficiently to cover all previous trips. By not assuming any specific battery size, our study focuses on the implications from driving behavior on charging demand and thereby exclude impacts from technical choice, such as battery size. This clarifies the impacts arising from driving behavior. Charging power is simplified to a step function, with the charging always made at the charger’s rated power. The equation for vehicle electricity consumption between two charging events (
Where
Given the investigated driving demand profiles and assumed charging capacities, EVs only need to be charged on average 4–8% of the hours per day, which would allow for using strategic and scheduled charging times. The benefit of strategic charging could be to reduce the hours with the highest charging coincidence factor and thereby reduce power demand and grid impacts from EV charging. To investigate the potential of moving charging power demand we develop a charging demand reduction factor. The charging demand reduction factor states the reduction in after-coincidence charging power demand that occurs when the charging is moved in time. It uses the calculated after-coincidence charging power demand to find the theoretical largest possible reduction in charging demand that can be achieved by moving a specific amount of the charging. The charging demand reduction is calculated by generating an after-coincidence charging power demand duration curve (i.e., a curve with the after-coincidence charging power demand sorted from highest to lowest during a year) for a specific number of vehicles. The reduction in coincidence factor is then calculated between the time with the highest after-coincidence charging power demand (
Scenarios
After-coincidence charging power demand is calculated with different nominal charging power, vehicle electricity consumption per km and charging locations. Three nominal charging powers are considered: 3.3, 6.6 and 11 kW. A nominal charging power of 3.3 kW likely represents a lower limit for EV nominal charging power as lower charging power would require a very long charging time. A nominal charging power of 11 kW likely represents a higher limit for home charging, since in Sweden most households are equipped with a 3-phase 16 A (about 11 kW) connection to the grid. A higher nominal charging power than 11 kW would in these cases either require increasing the grid connection or investing in additional equipment behind the meter (e.g., stationary battery and/or solar photovoltaic). Three vehicle electricity consumption rates are also considered: 0.15 kWh/km (small sized EV, similar to a Renault Zoe), 0.20 kWh/km (medium sized EV, similar to a Nissan Leaf) and 0.25 kWh/km (large sized EV, similar to a Tesla Model X). Apart from vehicle size, electricity consumption is also influenced by driving behavior, environmental conditions and auxiliary systems used in the vehicle, which is reflected in the different electricity consumption rates considered.
Finally, we investigate three different charging locations: home charging, charging when parking is at least 2 h long, and charging when parking is at least 8 h long. Home charging only allows a vehicle to be charged at its home location. Charging while parked for 8 h allows a vehicle to charge every time it stays at any location for at least 8 h, this can be considered to include charging at home and work. Charging at all parking that are at least 2 h allows for a vehicle to be charged every time it stays at any location for at least 2 h, which would cover longer shopping trips. We have avoided to use shorter time-periods as drivers are considered less likely to charge their vehicle unless the charging power is very high.
Data
Two datasets are used in this study, one from Västra Götaland and Kungsbacka in western Sweden (from here on called western Sweden) and one from Seattle in the United States, both including GPS measured driving data. The Swedish Car Movement Dataset (SCMD) consist of cars from Västra Götaland and Kungsbacka, one of the largest regions in Sweden. The region, and the geographical distribution of the cars, is representative for Sweden in terms of the distribution of urban and rural areas, and sizes of cities. The data is representative for Sweden in terms of car sizes, car fuel type, and number of cars in the households that participated in the study. It is not representative in terms of car age, and the cars annual driving distance, as the original study had a car age inclusion criterion of 8 years. In addition there is a small bias towards older drivers in the dataset (Karlsson, 2013). The Puget Sound Regional Council (PSRC) car movement dataset includes measured vehicles in the urban settings of Seattle but is not representative in terms of geographical location nor selection of population (Puget Sound Regional Council, 2008). However, due to the lack of representative datasets, and due to no previous analysis of or comparisons between GPS measured driving behavior and NHTS data, we consider the dataset to be valuable. Furthermore, the PSRC dataset have been widely used in the literature to preform analysis concerning EVs and travel patterns (Dong et al., 2014; Bucher and Bradley, 2018; Khemri et al., 2017, 2019). Table 1 contain some selected statistics for the SCMD and the PSRC datasets. Both GPS driving datasets applied in this study have been collected from internal combustion engine vehicles and it is assumed in this study that individual driving patterns will not change during an shift from combustion vehicles to EVs. The measured driving period per vehicle is extrapolated from the original period (measurement periods differ between cars and dataset) to 12 months.
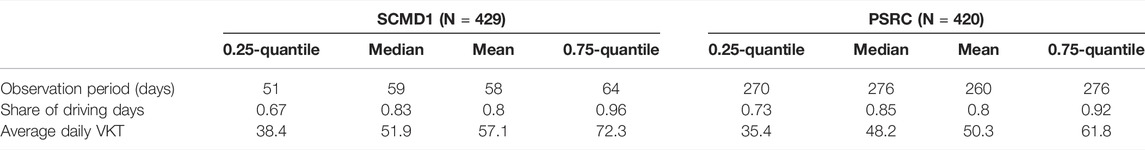
TABLE 1. Summary statistics per vehicle in the two datasets the Swedish Car Movement Data (SCMD)and Puget Sound Research Council Data (PSRC).
The SCMD dataset consist of GPS measurements on driving behavior from more than 700 privately driven cars in western Sweden. Out of these 700, we selected 429 cars that, after data cleaning and filtering, have at least 30 days of high quality GPS measurements (for details on the cleaning process, see Björnsson and Karlsson, 2015). The measurements were evenly distributed over the years 2010–2012. The cars were randomly selected from the Swedish vehicle registry with restrictions on age of the car (maximum 8 years) and the aforementioned geographical limitation to home addresses in western Sweden. Eight years was chosen as a maximum age since EVs are expected to mainly replace newer vehicles. The sample is representative in terms of car size and car fuel type. Fuel is important as can have indirect implications on driving patterns, diesel vehicles are more beneficial during longer individual trips. There is an over-representation of cars in the data with a higher annual VKT (Vehicle Travelled Km). In the SCMD the annual VKT is 17,154 km compared to a national average of roughly 13,000 km. The higher VKT is likely due to the lower age of the cars in SCMD (Caserini et al., 2013). Concerning the driver’s age, there is a slight overrepresentation of senior citizens. A full description of the data including pre-processing is available in Karlsson (2013). In the SCMD data, we identify the most common destination and select this as the home location. Detailed analysis of the GPS recorded trips from SCMD can be found in Jakobsson et al. (2016), Björnsson and Karlsson (2015), Karlsson (2013), and Björnsson and Karlsson (2016).
The PSRC dataset contains GPS measurements of 484 cars during 18 months. The GPS measurements were collected between 2004 and 2006, and the cars were registered to households in the Seattle Metropolitan Area. The data was collected as part of a congestion charge study using artificial tolls. To avoid artifacts from the artificial toll in this study, we only use the last 11 months of the data where the toll structure is unchanged. The 11 months contain GPS measurements of 437 private cars. Similar to the SCMD data, we only include cars with at least 30 measurement days. Furthermore, we remove one car with unreasonably low annual VKT, which yields a total of 420 cars included in our analysis. The number of vehicles (429 SCMD or 420 PRSC) compared to the maximum number of vehicles selected for coincidence evaluation (400) likely results in a low variation of coincidence when the number of vehicles is close to the maximum number of vehicles. The low variation arises due to the low variation between combination of vehicles. The PSRC dataset contains information on which trips that end at the home location and at the work location. Detailed analysis of the GPS recorded trips from PSRC can be found in RSG (2015), Holden et al. (2018), and Wei et al. (2021). The difference in measurement period, 2010–2012 for SCMD and 2004–2006 for PSRC is unlikely to have a significant impact on results. Inter-country differences are likely much larger than temporal changes from the 6 year difference between SCMD and PSRC.
Results
The results are divided into five subsections. After-Coincidence Charging Power Demand subsection shows results on after-coincidence charging power demand for the different scenarios investigated. After-Coincidence Charging Power Demand Distribution subsection shows results on the after-coincidence statistical distribution. After-Coincidence Charging Power Demand Duration Curves subsection shows the after-coincidence charging power demand duration curves. Charging Power Demand Reduction subsection shows reduction in charging demand from moving charging and Comparison Between GPS Measured and NHTS Based Charging Power Demand subsection shows a comparison with studies using NHTS data.
After-Coincidence Charging Power Demand
Figures 2–4 shows the hour of the year with the highest EV charging power demand for the average of all randomized combinations of vehicles, assuming three different charging locations (Figure 2), nominal charging power (Figure 3) and car sizes (Figure 4). The results are shown for both datasets (SCMD and PSRC) and for randomized combinations of driving patterns of up to 400 vehicles.
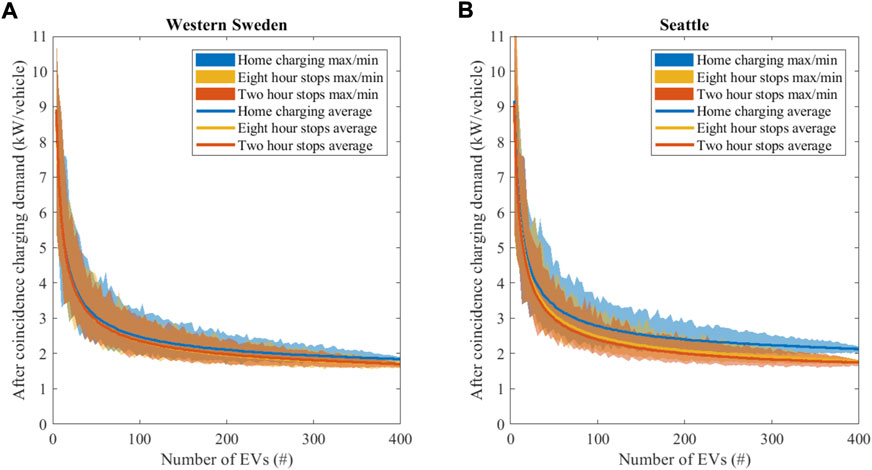
FIGURE 2. After-coincidence charging power demand for the highest hour of the year and as an average for all combination of vehicles for three different charging locations, (blue) charging at home location, (yellow), charging when the car is parked for at least 8 h in a row and (red) charging when the car is parked for at least 2 h in a row. The nominal charging power is 11 kW and the electricity demand per km is assumed to be 0.2 kWh/km. Data for Western Sweden in (A) and Seattle (B). Shaded areas show variation (max and min) from the randomized combinations.
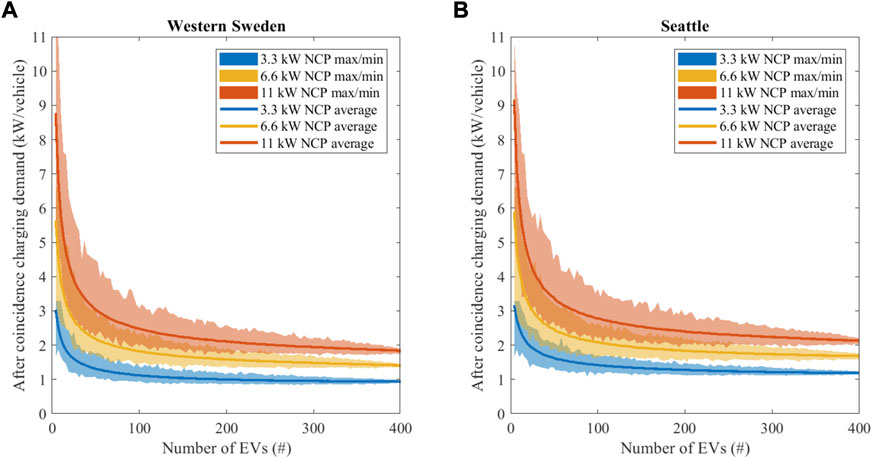
FIGURE 3. After-coincidence charging power demand for the highest hour of the year and as an average for all combination of vehicles with different driving patterns. After-coincidence charging power demand for three different Nominal Charging Powers (NCP). Charging location is home only and electricity demand per km is assumed to be 0.20 kWh/km. Data for Western Sweden in (A) and Seattle (B). Shaded areas show variation (max and min) from the randomized combinations.
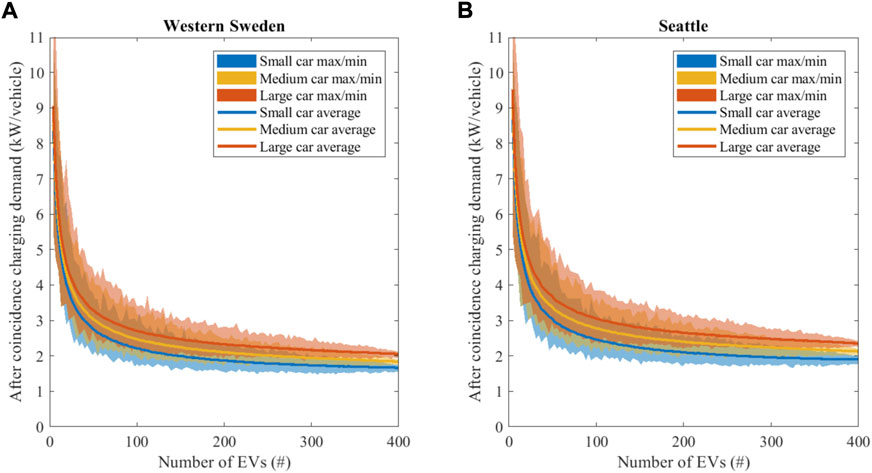
FIGURE 4. After-coincidence charging power demand for the highest hour of the year and as an average for all combination of vehicles with different driving patterns. After-coincidence charging power demand for three different sized cars. Charging location is home only and nominal charging power is 11 kW. Data for Western Sweden in (A) and Seattle (B). Shaded areas show variation (max and min) from the randomized combinations.
As is expected, and similar to coincidence curves for other electric loads, after-coincidence charging power demand drop from about 10 to 2 kW as number of EVs increases. 2 kW represents a coincidence factor of roughly 0.16. This can be compared to typical coincidence values for household’s electricity demands (before introducing the EV charging load) which are about 0.2 for residential heated dwellings and 0.5 for electric heated dwellings. The large variation marked by the shaded areas in Figures 2–4 shows that there can be significant variation in power demand, and therefore also in local grid impacts for the same number of EVs. The choice of charging location, i.e., the access to charging only at home location or most parking places, has a small impact on the charging power demand in SCMD. There is an 8% reduction in charging coincidence for 400 EVs in SCMD comparing different charging locations, and an 18% reduction in PSRC. In PSRC charging at all stops that are 2 h or longer results in the lowest charging power demand. For SCMD charging at all stops that are 8 h or longer results in the lowest charging power demand. However, the difference in SCMD for 2 h stops and 8 h stops is very small. Extending the charging from only home location can thus reduce overall power demand with about 8% in western Sweden and 18% in Seattle. More charging locations could therefore reduce the local EV charging impact by increasing the geographical distribution of the charging. For both western Sweden and Seattle a nominal charging power of 11 kW and a medium sized vehicle was assumed.
The impact from different nominal charging powers (11, 6.6 and 3.3 kW) on after-coincidence charging power demand is shown in Figure 3. As expected, the after-coincidence charging power demand is higher for higher nominal charging powers, due to the higher individual nominal charging power. The difference is due to a small extent offset by shorter charging times when using a higher nominal charging power. The difference in after-coincidence charging power demand from different nominal charging powers is larger in Seattle than in western Sweden. The after-coincidence charging power demand is 0.9, 1.4 and 1.8 kW for 3.3, 6.6 and 11 kW nominal charging powers for western Sweden and 400 EVs. For Seattle the after-coincidence charging power demand is 1.2, 1.7 and 2.1 kW for 3.3, 6.6 and 11 kW nominal charging powers and 400 BEVs. The higher charging power demand in Seattle compared to western Sweden is likely due to a larger homogeneity in driving behavior in PSRC. The larger homogeneity is likely due to all participants in PSRC commute to Seattle, while SCMD contains a larger and representative sample. There is a significant increase in after-coincidence charging power demand with higher nominal charging powers. The increase is 42 and 47% in after-coincidence charging power demand between 3.3 and 11 kW nominal charging power in western Sweden and Seattle, respectively, assuming 400 EVs. For both western Sweden and Seattle a medium sized vehicle and home charging only was assumed.
The impact of vehicle electricity consumption per km on after-coincidence charging power demand is shown in Figure 4. Comparing the results in Figures 2–4, it is clear that the impact from vehicle’s individual electricity consumption on after-coincidence charging power demand is lower than the impact from nominal charging power, but larger than the charging strategy. The reduction in EV charging after-coincidence charging power demand comparing small and large vehicles is 19%, both for western Sweden and Seattle. The larger electricity consumption for large vehicles causes a larger total electricity consumption and therefore longer charging times. The longer charging times increase the probability of charging events occurring simultaneously thus increasing after-coincidence charging power demand. For both western Sweden and Seattle a nominal charging power of 11 kW and home charging only was assumed.
After-Coincidence Charging Power Demand Distribution
To capture and analyze variations in combinations of vehicles we generate an empirical Cumulative Distribution Function (CDF) of after-coincidence charging power demand (see Figure 5). Figure 5 shows that the after-coincidence charging power demand distribution varies significantly for small number of vehicles but with only minor variation for large number of vehicles. When only a few vehicles are included, there is the possibility for the vehicles to have both high after-coincidence charging power demand and low after-coincidence charging power demand. On a local level, where only a few vehicles are included in the same grid, we can therefore expect large variations, with some areas showing little impact from EV charging while other show large EV charging impacts. As shown in Figure 5 when the number of EVs included is increased, the variation is significantly reduced. For areas with a large number of EVs, the grid impacts or demand requirements should therefore show less variation.
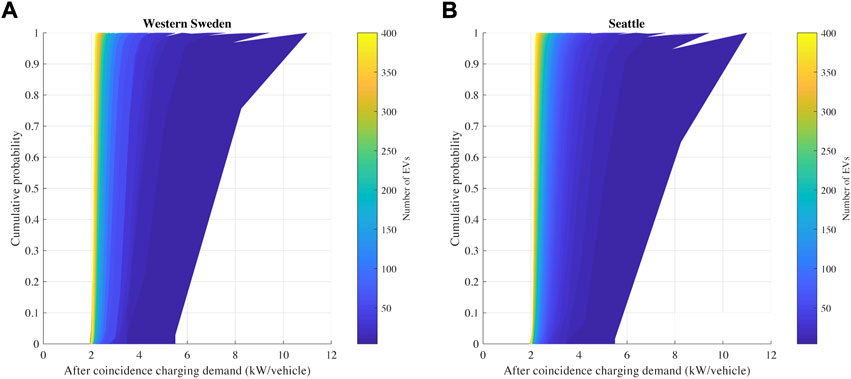
FIGURE 5. Empirical Cumulative Distribution Function (CDF) of after-coincidence charging power demand based on 132,000 randomized combinations of vehicles. Results for Western Sweden (A) and Seattle (B). The nominal charging power is 11 kW, the electricity demand per km is assumed to be 0.2 kWh/km and charging location is home only.
After-Coincidence Charging Power Demand Duration Curves
Figure 6 shows after-coincidence charging power demand duration curves for 1 year, and four selected number of EVs. As after-coincidence charging power demand is a measure of the probability of charging occurring simultaneously, its time-duration curve can reveal interesting patterns. Power systems are generally designed based on after-coincidence power demand, which occurs at the maximum coincidence over a year. In reality, after-coincidence power demand can have significant temporal variation within a year and between years, which becomes relevant when considering the impacts from moving charging in time. As is seen in Figure 6, after-coincidence charging power demand shows a non-linear decrease with an initial fast drop followed by a significantly slower reduction for all selected EV numbers. It is noted that for more than 40 EVs there are very small variation in after-coincidence charging power demand for a considerable duration, both for western Sweden and Seattle. This indicates that there are a few hours with a high after-coincidence charging power demand, while most hours have a lower after-coincidence charging power demand. Furthermore, when selecting 10 EVs the after-coincidence charging power demand duration curves show two plateaus. The plateaus seen for 10 EVs in Figure 6 can partly be explained by that coincidence between charging events can only be a multiple of number of EVs. For 10 EVs, this becomes a multiple of a 10th. The random combinations of vehicles likely cause these values to be more common than alternative combinations.
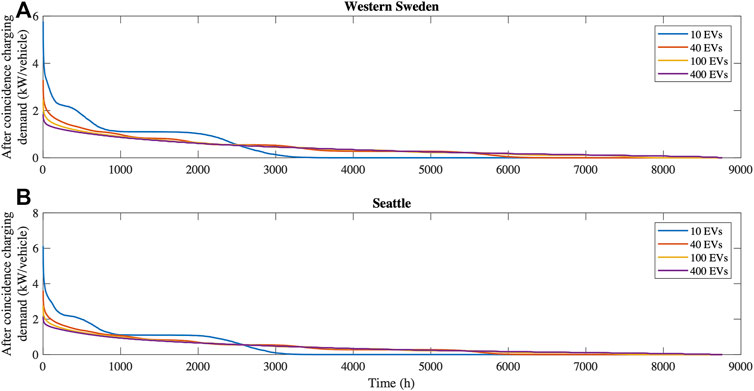
FIGURE 6. After-coincidence charging power demand duration curve over a full year for 10, 40, 100 and 400 number of EVs. Results for western Sweden (A) and Seattle (B). The nominal charging power is 11 kW, the electricity demand per km is assumed to be 0.2 kWh/km and charging location is home only.
Charging Power Demand Reduction
Figure 7 shows the charging demand reduction. Based on the fast, initial drop seen in Figure 6, we expect to see a high benefit of moving charging from the first hours to hours when this fast, initial drop stabilizes. As can be seen in Figure 6, the benefit from moving charging demand in time is similar in both western Sweden and Seattle. The benefits are highly dependent on the number of EVs, with higher benefits for few EVs than for many EVs. For 20 EVs, the reduction in charging demand from moving charging time is around 45%, while for 400 EVs the charging demand reduction is reduced to 25% (Figure 7). In Figure 7, we observe a continued decreasing, yet reduced, trend in charging demand reduction as number of EVs are increased. The reduced charging demand for many EVs are mainly explained by the inherent large variation in driving patterns. For a few EVs these variations can have a significant impact, while as the number of EVs increase these variations are smoothed out.
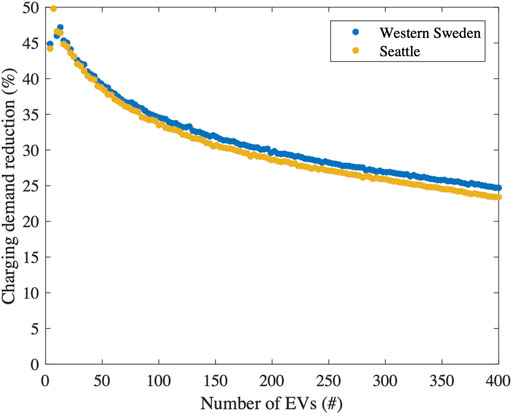
FIGURE 7. Charging demand reduction when moving the 364 highest charging demand hours for 1 year. The nominal charging power is 11 kW, the electricity demand per km is assumed to be 0.2 kWh/km and charging location is home only.
Comparison Between GPS Measured and NHTS Based Charging Power Demand
Table 2 shows a comparison of charging demand from the GPS measured driving profiles with estimated charging demand from literature using NHTS. The GPS measured charging demand assumes a medium sized vehicle and a nominal charging power similar to the compared studies. To estimate charging power demand in Sweden from Liu et al. (2014) we assume that their 100% electrification scenario represents 5 million passenger vehicles. As can be seen in Table 2, the GPS measured demand consistently estimate the charging demand higher. For Sweden, the charging demand is 50–125% higher, while for the United States it is 62–183% higher. Since the nominal charging power is similar, the main cause for difference is therefore in the coincidence between different vehicles. There are likely explanations to the differences in the two methods. First, the GPS measured data was taken from regional areas in Sweden and the United States, and might therefore differ from national estimates, or from other areas. Secondly, there is a difference in the reported driving from the NHTS and those measured with the GPS devices.
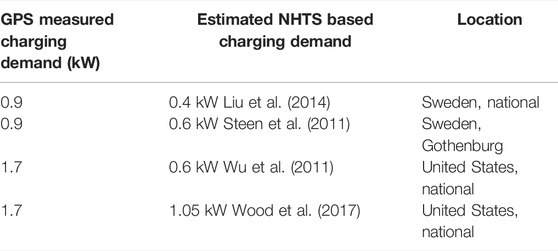
TABLE 2. Comparison of charging demand from GPS measured driving behavior and driving behavior from NHTS for Sweden and the United States, expressed as kW/vehicle.
Discussion
We have presented the first analysis of after-coincidence charging demand from EVs using GPS measured driving behavior from Seattle and western Sweden. Previous work has to a large extent relied on NHTS based data, without verification from measurements of actual driving behavior. Even though the dataset from Seattle is not representative in terms of population, we still consider it to be useful. First, as there is a lack of studies analyzing GPS measured driving behavior on the purpose of estimating charging demand, the findings are relevant from a local perspective. Secondly, the homogeneity of the Seattle data has value when considering that single communities might show a similar level of homogeneity. The results from Seattle can be interpretate as the after-coincidence charging power demand that a homogenous community can require, which is found in this study to be significantly higher than the United States national estimates relying on NHTS data.
We find that the results for the charging demand in this study, which are based on GPS measured driving behavior, to be significantly larger than previous studies that were using NHTS data. For western Sweden, our estimated charging power demand is 50–125% higher, while for the United States it is 62–183% higher. This assumes the results when using the after-coincidence power demand for 400 EVs. Even though the after-coincidence charging power demand is likely to continue decreasing with an increase in number of EVs, the reduction is likely to be small due to the observed emerging plateau. The NHTS based studies used data from 2009 (United States) and 2005–2006 (Sweden), while the GPS measurements were conducted in 2005–2006 (United States) and 2010–2012 (Sweden). However, the difference in time period for the datasets is unlikely to impact our results as travel behavior is unlikely to change significant during such a short time. In addition, the compared United States NHTS studies (Wood et al., 2017; D. Wu et al., 2011) used datasets that covered all of the United States, while the GPS measured data we used is limited to Seattle. There might be geographical and demographic factors that can explain the difference. As the PSRC data is limited to commuters in Seattle (Puget Sound Regional Council, 2008), the dataset likely overestimate coincidence leading to a higher after coincidence charging power demand, which explain the differences when compared to United States NHTS data. Wood et al. (2017) assumed 50% Plugin-Electric Vehicles (PHEV) and 50% BEV. The small battery and large share of PHEVs reduce the coincidence windows between charging events and can partly explain why their estimated charging power demand is lower.
The similarity in charging power demand estimates between the two Swedish NHTS based studies, and their representation of both a local and national area, suggests that it is the NHTS based approach that reduces the estimate rather than geographical variations. However, we also note that the difference between GPS measured estimates and NHTS based estimates are larger for the United States than for Sweden. This could be due to that the PSRC dataset contains a larger share of car commuters than would be found nationally. And that these commuters have a higher homogeneity in their driving behavior. Wei et al. (2021) used NHTS and GPS data interchangeably which can cause problems due to discrepancies in the different methods.
As stated by Shepero et al. (2018) model assumptions and data type is a source of error when estimating charging power demand from EVs. Both which relate to the type of data collected originally. Lack of accuracy when using NHTS data can probably explain some of differences in our results. The surveys collect data on reported length and duration of trips, which can include reporting errors as it relies on people’s estimation of trip length and start/finish time. The large discrepancy between the measured GPS based data and reporting from the travel survey could be due to the GPS data not capturing the large number of households that have multiple vehicles. And that these vehicles spend most time parked at home. A limitation of both the GPS-based and NHTS based data is that vehicles may come from many different regions, while in reality there might be homogenous groups living in the same area. In the case of the PSRC data, all study participants drive to the center of Seattle every day. To capture a more realistic variation, future research should therefore include larger datasets with more variation in vehicle trips. This would likely result in more accurate estimations of coincidence distribution, both for tens and hundreds of EVs. However, larger GPS datasets are resource consuming to collect and analyze.
The decreasing trend for charging power demand reduction and the comparably flat after-coincidence charging power demand duration curve has significant power system implications. The charging demand reduction shows the potential in moving charging. As such it can be considered as an upper limit for what power demand reduction EV charging strategies can reach when excluding household appliances. The higher charging demand reductions for few EVs suggest that moving charging will have larger impacts on a very local level. Alternatively, strategies aimed at moving charging in time will have reducing impact at higher levels in power system, and potentially small impacts on overall demand and generation balance. In energy system modelling were EV charging responds to electricity price (Taljegard et al., 2019) moving charging in time up to 364 h per year should have less implications on energy system levels, but more impacts on individual low-voltage grids.
Furthermore, as is seen from Figure 6, there are only small changes between the thousandth hour and the two thousandth hour. Moving charging from the 1,820 worst hours during a year reduce coincidence with 64% for 400 vehicles. This suggests that there are diminishing charging power demand reductions when moving charging power demand for very many hours. This may seem surprising but can be explained by a large variation in driving behavior amongst drivers (Björnsson and Karlsson, 2015; RSG, 2015; Jakobsson et al., 2016). In Figure 7 charging demand reduction from moving the 364 worst hours during a year is largest for a few vehicles, and reduces with increasing vehicles. This highlights that moving charging in time will have the most effect for a single low-voltage feeder, or a low-voltage network with few customers. The impact will be diminishing at higher voltage levels. This imply that controlled charging strategies, including V2G, will likely be most useful at a local level. Analogously, the input signal to a control mechanism that control charging and V2G would likely need to be locally distributed, and not centralized to increase the benefits.
Our results rely on the assumption that driving behavior will not change during an electrification of personal vehicles. Previous research on driving behavior of EV drivers suggest that changes mainly occur initially and mainly affects acceleration and deceleration (Helmbrecht et al., 2014). As stated by Shepero et al. (2018) this is a common assumption when estimating EV charging power demand, and is unlikely to change. However, as EVs just recently are starting to become widespread, it is difficult to draw conclusions of how the general public might change their behavior. Driving behavior might increase as EVs have lower driving costs than comparable combustion vehicles. However, this would primarily impact drivers that are currently limiting their driving due to economic reasons, and might therefore be primarily found in areas with a low socio-economic status.
As shown in Figure 2, after-coincidence charging power demand was reduced with 8% for western Sweden, and 18% for Seattle when using multiple charging locations compared to home charging only. Given the homogeneity of the PSRC, it is likely more important to consider multiple charging locations when analyzing homogenous communities. This is likely caused by homogenous communities to a larger extent arrive simultaneously, and thereby having a higher coincidence. When including charging away from home, the time needed to charge while arriving at the home location is smaller. Leading to a smaller window of coincidence with other charging events. Driving is likely more varied in SCMD (since it is representative to a larger population), and the likelihood of multiple vehicles arriving home at the same time is therefore smaller. Leading to a lower coincidence. Furthermore, battery size might have large variations between vehicles, causing some vehicles to require charging more often than others. In these instances, the option in Figure 2 with charging at every stop longer than 2 h might be more realistic. The overall implications on after-coincidence charging power demand will ultimately be impacted by the homogeneity of drivers, both in terms of their departure time, their nominal charging power and vehicles energy consumption.
Using GPS measured driving behavior we have only analyzed coincidence between different charging events, and excluded coincidence with other residential loads. On a household level, there is likely a high coincidence between charging and other residential loads. If this is the case, coincidence of total household loads can result in additional load dynamics and potentially larger peak demands. Furthermore, adding residential loads might also affect the benefit of moving charging if the coincidence between EV charging and other residential demand is high. However, this would require accurate driving behavior and high-resolution residential load profiles for the same households.
Conclusion
This study has used empirical GPS measured driving patterns from western Sweden and Seattle to estimate the EV after-coincidence charging power demand. There has previously been a large reliance on NHTS based data to estimate EV charging power demand. Our results suggest that GPS measurements might overestimate after-coincidence charging power demand with 50–183% compared to NHTS data. The large power demand from EV charging during a full EV deployment suggest that these differences can have significant impacts on electric utilities and future electricity production. However, due to the limited sample used in our study, further data collection and analysis is needed. Furthermore, representative GPS measurements for additional countries would be useful to see if the findings in our study are limited to specific countries or regions, or if they are general. We also find that nominal charging power has the largest impact on after-coincidence charging power demand. Reducing nominal charging power can reduce overall power demand with up to 18%. Increasing the number of charging locations mostly impact local charging power demand, and has a modest impact on overall power demand. Furthermore, even though the datasets used in this study have been thoroughly analyzed in previous work, a comparative analysis of the differences between Swedish and United States driving patterns would be interesting. This could highlight important national aspects that are relevant for EV adoption, both from a policy perspective and a technical perspective.
Data Availability Statement
Publicly available datasets were analyzed in this study. This data can be found here: https://www.nrel.gov/transportation/secure-transportation-data/tsdc-puget-sound-traffic-study.html.
Author Contributions
Conceptualization, EH, NJ, MT and MO; methodology, EH and NJ; software, EH; formal analysis, EH; data curation, NJ; writing—original draft preparation, EH; writing—review and editing, EH, NJ, MT, and MO; funding acquisition, MO. All authors have read and agreed to the published version of the manuscript.
Conflict of Interest
The authors declare that the research was conducted in the absence of any commercial or financial relationships that could be construed as a potential conflict of interest.
Publisher’s Note
All claims expressed in this article are solely those of the authors and do not necessarily represent those of their affiliated organizations, or those of the publisher, the editors and the reviewers. Any product that may be evaluated in this article, or claim that may be made by its manufacturer, is not guaranteed or endorsed by the publisher.
References
Alipour, M., Mohammadi-Ivatloo, B., Moradi-Dalvand, M., and Zare, K. (2017). Stochastic Scheduling of Aggregators of Plug-In Electric Vehicles for Participation in Energy and Ancillary Service Markets. Energy 118, 1168–1179. doi:10.1016/J.ENERGY.2016.10.141
Almaghrebi, A., Aljuheshi, F., Rafaie, M., James, K., and Alahmad, M. (2020). Data-Driven Charging Demand Prediction at Public Charging Stations Using Supervised Machine Learning Regression Methods. Energies 13, 4231. doi:10.3390/en13164231
Babrowski, S., Heinrichs, H., Jochem, P., and Fichtner, W. (2014). Load Shift Potential of Electric Vehicles in Europe. J. Power Sourc. 255, 283–293. doi:10.1016/J.JPOWSOUR.2014.01.019
Björnsson, L.-H., and Karlsson, S. (2015). Plug-in Hybrid Electric Vehicles: How Individual Movement Patterns Affect Battery Requirements, the Potential to Replace Conventional Fuels, and Economic Viability. Appl. Energ. 143, 336–347. doi:10.1016/J.APENERGY.2015.01.041
Björnsson, L.-H., and Karlsson, S. (2016). The Potential for Brake Energy Regeneration under Swedish Conditions. Appl. Energ. 168, 75–84. doi:10.1016/j.apenergy.2016.01.051
Bureau of Transportation Statistics (2017). Household, Individual, and Vehicle Characteristics. Washington, DC.
Bucher, J. D., and Bradley, T. H. (2018). Modeling Operating Modes, Energy Consumptions, and Infrastructure Requirements of Fuel Cell Plug in Hybrid Electric Vehicles Using Longitudinal Geographical Transportation Data. Int. J. Hydrogen Energ. 43 (27), 12420–12427. doi:10.1016/j.ijhydene.2018.04.159
Caserini, S., Pastorello, C., Gaifami, P., and Ntziachristos, L. (2013). Impact of the Dropping Activity with Vehicle Age on Air Pollutant Emissions. Atmos. Pollut. Res. 4 (3), 282–289. doi:10.5094/APR.2013.031
Charilaos, L., Sivakumar, A., and Polak, J. (2017). “Modeling Electric Vehicle Charging Behaviour: What Is the Relationship Between Charging Location, Driving Distance and Range Anxiety,” in Transportation Research Board 96th Annual Meeting, Washington DC, January 8–12, 2017.
Chen, H., Guo, Z., Xin, Y., Zhao, Y., and Jia, Y. (2017). “Coordination of PEV Charging across Multiple Stations in Distribution Networks Using Aggregate PEV Charging Load Model,” in 2017 International Smart Cities Conference (ISC2), Wuxi, China, September 14–17, 2017, 1–5. doi:10.1109/ISC2.2017.8090819
Crozier, C., Morstyn, T., and McCulloch, M. (2020). The Opportunity for Smart Charging to Mitigate the Impact of Electric Vehicles on Transmission and Distribution Systems. Appl. Energ. 268, 114973. doi:10.1016/j.apenergy.2020.114973
Davidson, R., and MacKinnon, J. G. (2000). Bootstrap Tests: How Many Bootstraps. Econometric Rev. 19 (1), 55–68. doi:10.1080/07474930008800459
Dong, J., Liu, C., and Lin, Z. (2014). Charging Infrastructure Planning for Promoting Battery Electric Vehicles: An Activity-Based Approach Using Multiday Travel Data. Transportation Res. C: Emerging Tech. 38, 44–55. doi:10.1016/J.TRC.2013.11.001
Edison Electric Institute (2019). Electric Vehicle Sales: Facts & Figures. Washington DC: Edison Electric Institute. Available at: https://www.eei.org/issuesandpolicy/electrictransportation/Documents/FINAL_EV_Sales_Update_Oct2019.pdf (Accessed October 19, 2021)
Efron, B. (2003). Second Thoughts on the Bootstrap. Stat. Sci. 18 (2), 135–140. doi:10.1214/ss/1063994968
European Commission (2011). Roadmap to a Single European Transport Area – Towards a Competitive and Resource Efficient Transport System. Brussels.
Faridimehr, S., Venkatachalam, S., and Chinnam, R. B. (2019). A Stochastic Programming Approach for Electric Vehicle Charging Network Design. IEEE Trans. Intell. Transport. Syst. 20 (5), 1870–1882. doi:10.1109/TITS.2018.2841391
Hable, M., Schwaegerl, C., Tao, L., Ettinger, A., Köberle, R., and Meyer, E.-P. (2010). “Requirements on Electrical Power Infrastructure by Electric Vehicles,” in 2010 Emobility - Electrical Power Train, Wuxi, China, September 14–17, 2017, 1–6. doi:10.1109/EMOBILITY.2010.5668076
Hardinghaus, M., Löcher, M., and Anderson, J. E. (2020). Real-World Insights on Public Charging Demand and Infrastructure Use from Electric Vehicles. Environ. Res. Lett. 15 (10), 104030. doi:10.1088/1748-9326/aba716
Harris, C. B., and Webber, M. E. (2014). An Empirically-Validated Methodology to Simulate Electricity Demand for Electric Vehicle Charging. Appl. Energ. 126, 172–181. doi:10.1016/j.apenergy.2014.03.078
Helmbrecht, M., Olaverri-Monreal, C., Bengler, K., Vilimek, R., and Keinath, A. (2014). How Electric Vehicles Affect Driving Behavioral Patterns. IEEE Intell. Transport. Syst. Mag. 6 (3), 22–32. doi:10.1109/MITS.2014.2315758
Holden, J., Van Til, H., Wood, E., Zhu, L., Gonder, J., and Shirk, M. (2018). Trip Energy Estimation Methodology and Model Based on Real-World Driving Data for Green-Routing Applications. Transportation Res. Rec. 2672 (24), 41–48. doi:10.1177/0361198118798286
Huber, J., Dann, D., and Weinhardt, C. (2020). Probabilistic Forecasts of Time and Energy Flexibility in Battery Electric Vehicle Charging. Appl. Energ. 262, 114525. doi:10.1016/j.apenergy.2020.114525
International Organization of Motor Vehicle Manufacturers (2015). World Vehicles in Use - By Country/Region and Type. Paris, France.
Jahangir, H., Tayarani, H., Ahmadian, A., Golkar, M. A., Miret, J., Tayarani, M., et al. (2019). Charging Demand of Plug-In Electric Vehicles: Forecasting Travel Behavior Based on a Novel Rough Artificial Neural Network Approach. J. Clean. Prod. 229, 1029–1044. doi:10.1016/j.jclepro.2019.04.345
Jakobsson, N., Gnann, T., Plötz, P., Sprei, F., and Karlsson, S. (2016). Are Multi-Car Households Better Suited for Battery Electric Vehicles? - Driving Patterns and Economics in Sweden and Germany. Transportation Res. Part C: Emerging Tech. 65, 1–15. doi:10.1016/J.TRC.2016.01.018
Kezunovic, M., Pinson, P., Obradovic, Z., Grijalva, S., Hong, T., and Bessa, R. (2020). Big Data Analytics for Future Electricity Grids. Electric Power Syst. Res. 189, 106788. doi:10.1016/j.epsr.2020.106788
Khemri, N., Joseph, S., Syed, F., and Ying, H. (2019). Developing a Real-World, Second-By-Second Driving Cycle Database through Public Vehicle Trip Surveys. SAE Technical Paper
Khemri, N., Ying, H., Joseph, S., and Syed, F. (2017). Utilizing Public Vehicle Travel Survey Data Sets for Vehicle Driving Pattern and Fuel Economy Studies. SAE Technical Paper
Lazzeroni, P., Olivero, S., Repetto, M., Stirano, F., and Vallet, M. (2019). Optimal Battery Management for Vehicle-To-Home and Vehicle-To-Grid Operations in a Residential Case Study. Energy 175, 704–721. doi:10.1016/j.energy.2019.03.113
Li, S., Xie, F., Huang, Y., Lin, Z., and Liu, C. (2020). Optimizing Workplace Charging Facility Deployment and Smart Charging Strategies. Transportation Res. D: Transport Environ. 87, 102481. doi:10.1016/j.trd.2020.102481
Liu, Q., Liu, J., Le, W., Guo, Z., and He, Z. (2019). Data-Driven Intelligent Location of Public Charging Stations for Electric Vehicles. J. Clean. Prod. 232, 531–541. doi:10.1016/j.jclepro.2019.05.388
Liu, Y., Deng, R., and Liang, H. (2018). A Stochastic Game Approach for PEV Charging Station Operation in Smart Grid. IEEE Trans. Ind. Inf. 14 (3), 969–979. doi:10.1109/TII.2017.2781226
Liu, Z., Wu, Q., Nielsen, A. H., and Wang, Y. (2014). Day-Ahead Energy Planning with 100% Electric Vehicle Penetration in the Nordic Region by 2050. Energies 7 (3), 1733–1749. doi:10.3390/en7031733
Morrissey, P., Weldon, P., and O’Mahony, M. (2016). Future Standard and Fast Charging Infrastructure Planning: An Analysis of Electric Vehicle Charging Behaviour. Energy Policy 89, 257–270. doi:10.1016/J.ENPOL.2015.12.001
Muratori, M. (2018). Impact of Uncoordinated Plug-In Electric Vehicle Charging on Residential Power Demand. Nat. Energ. 3 (3), 193–201. doi:10.1038/s41560-017-0074-z
Noussan, M., and Neirotti, F. (2020). Cross-Country Comparison of Hourly Electricity Mixes for EV Charging Profiles. Energies 13, 2527. doi:10.3390/en13102527
Pearre, N. S., Kempton, W., Guensler, R. L., and Elango, V. V. (2011). Electric Vehicles: How Much Range Is Required for a Day's Driving. Transportation Res. Part C: Emerging Tech. 19 (6), 1171–1184. doi:10.1016/J.TRC.2010.12.010
Puget Sound Regional Council (2008). Puget Sound Regional Council Traffic Choices Study—Summary Report.
Putrus, G. A., Suwanapingkarl, P., Johnston, D., Bentley, E. C., and Narayana, M. (2009). “Impact of Electric Vehicles on Power Distribution Networks,” in 2009 IEEE Vehicle Power and Propulsion Conference, Wuxi, China, September 14–17, 2017, 827–831. doi:10.1109/VPPC.2009.5289760
Ramos Muñoz, E., and Jabbari, F. (2020). A Decentralized, Non-Iterative Smart Protocol for Workplace Charging of Battery Electric Vehicles. Appl. Energ. 272, 115187. doi:10.1016/j.apenergy.2020.115187
Rezaee, S., Farjah, E., and Khorramdel, B. (2013). Probabilistic Analysis of Plug-In Electric Vehicles Impact on Electrical Grid Through Homes and Parking Lots. IEEE Trans. Sustain. Energ. 4 (4), 1024–1033. doi:10.1109/TSTE.2013.2264498
Richardson, P., Flynn, D., and Keane, A. (2012). Local Versus Centralized Charging Strategies for Electric Vehicles in Low Voltage Distribution Systems. IEEE Trans. Smart Grid 3 (2), 1020–1028. doi:10.1109/TSG.2012.2185523
RSG (2015). Multiday GPS Travel Behavior Data for Travel Analysis. Edited by United States. Federal Highway Administration. Available at: https://rosap.ntl.bts.gov/view/dot/55893 (Accessed October 19, 2021).
Sarabi, S., Davigny, A., Courtecuisse, V., Riffonneau, Y., and Robyns, B. (2016). Potential of Vehicle-To-Grid Ancillary Services Considering the Uncertainties in Plug-In Electric Vehicle Availability and Service/Localization Limitations in Distribution Grids. Appl. Energ. 171, 523–540. doi:10.1016/J.APENERGY.2016.03.064
Schuller, A., Dietz, B., Flath, C. M., and Weinhardt, C. (2014). Charging Strategies for Battery Electric Vehicles: Economic Benchmark and V2G Potential. IEEE Trans. Power Syst. 29 (5), 2014–2022. doi:10.1109/TPWRS.2014.2301024
Shepero, M., Munkhammar, J., Widén, J., Bishop, J. D. K., and Boström, T. (2018). Modeling of Photovoltaic Power Generation and Electric Vehicles Charging on City-Scale: A Review. Renew. Sustain. Energ. Rev. 89, 61–71. doi:10.1016/J.RSER.2018.02.034
Sortomme, E., and El-Sharkawi, M. A. (2012). Optimal Scheduling of Vehicle-To-Grid Energy and Ancillary Services. IEEE Trans. Smart Grid 3 (1), 351–359. doi:10.1109/TSG.2011.2164099
Sortomme, E., and El-Sharkawi, M. A. (2011). Optimal Charging Strategies for Unidirectional Vehicle-To-Grid. IEEE Trans. Smart Grid 2 (1), 131–138. doi:10.1109/TSG.2010.2090910
Steen, D., Le Anh, T., Ortega-Vasquez, M., Carlson, O., Bertling, L., and Neimane, V. (2011). “Scheduling Charging of Electric Vehicles for Optimal Distribution Systems Planning and Operation,” in CIRED 21st International Conference on Electricity Distribution, Frankfurt, January 8–12, 2017, 6–9.
Taljegard, M., Walter, V., Göransson, L., Odenberger, M., and Johnsson, F. (2019). Impact of Electric Vehicles on the Cost-Competitiveness of Generation and Storage Technologies in the Electricity System. Environ. Res. Lett. 14 (12), 124087. doi:10.1088/1748-9326/ab5e6b
Wei, W., Ramakrishnan, S., Needell, Z. A., and Trancik, J. E. (2021). Personal Vehicle Electrification and Charging Solutions for High-Energy Days. Nat. Energ. 6 (1), 105–114. doi:10.1038/s41560-020-00752-y
Wood, E., Rames, C., Muratori, M., Raghavan, S., and Melaina, M. (2017). National Plug-In Electric Vehicle Infrastructure Analysis. Washington DC.
Wu, D., Aliprantis, D. C., and Gkritza, K. (2011). Electric Energy and Power Consumption by Light-Duty Plug-In Electric Vehicles. IEEE Trans. Power Syst. 26 (2), 738–746. doi:10.1109/TPWRS.2010.2052375
Wu, D., Radhakrishnan, N., and Huang, S. (2019). A Hierarchical Charging Control of Plug-In Electric Vehicles with Simple Flexibility Model. Appl. Energ. 253, 113490. doi:10.1016/j.apenergy.2019.113490
Yang, J., Dong, J., and Hu, L. (2017). A Data-Driven Optimization-Based Approach for Siting and Sizing of Electric Taxi Charging Stations. Transportation Res. Part C: Emerging Tech. 77, 462–477. doi:10.1016/j.trc.2017.02.014
Yi, T., Zhang, C., Lin, T., and Liu, J. (2020). Research on the Spatial-Temporal Distribution of Electric Vehicle Charging Load Demand: A Case Study in China. J. Clean. Prod. 242, 118457. doi:10.1016/j.jclepro.2019.118457
Zachary, L., Li, T., and Low, S. (2019). “ACN-Data: Analysis and Applications of an Open EV Charging Dataset,” in Proceedings of the Tenth International Conference on Future Energy Systems, Phoenix, January 8–12, 2017.
Keywords: electric vehicles, charging demand, driving behavior, GPS measurements, Sweden, Seattle
Citation: Hartvigsson E, Jakobsson N, Taljegard M and Odenberger M (2021) Comparison and Analysis of GPS Measured Electric Vehicle Charging Demand: The Case of Western Sweden and Seattle. Front. Energy Res. 9:730242. doi: 10.3389/fenrg.2021.730242
Received: 24 June 2021; Accepted: 27 September 2021;
Published: 28 October 2021.
Edited by:
Luis Fernando Correa Monteiro, Rio de Janeiro State University, BrazilReviewed by:
Michel Tcheou, Rio de Janeiro State University, BrazilAthanasios Dimaratos, Aristotle University of Thessaloniki, Greece
Copyright © 2021 Hartvigsson, Jakobsson, Taljegard and Odenberger. This is an open-access article distributed under the terms of the Creative Commons Attribution License (CC BY). The use, distribution or reproduction in other forums is permitted, provided the original author(s) and the copyright owner(s) are credited and that the original publication in this journal is cited, in accordance with accepted academic practice. No use, distribution or reproduction is permitted which does not comply with these terms.
*Correspondence: Elias Hartvigsson, ZWxpYXMuaGFydHZpZ3Nzb25AY2hhbG1lcnMuc2U=