 Jaya Shankar Tumuluru
 Bahman Ghiasi2
94% of researchers rate our articles as excellent or good
Learn more about the work of our research integrity team to safeguard the quality of each article we publish.
Find out more
ORIGINAL RESEARCH article
Front. Energy Res. , 17 September 2021
Sec. Bioenergy and Biofuels
Volume 9 - 2021 | https://doi.org/10.3389/fenrg.2021.728140
This article is part of the Research Topic Torrefaction Pretreatment for Biomass Upgrading: Fundamentals and Technologies View all 7 articles
Torrefaction, a thermal pretreatment process, is gaining attention as it improves the physical properties and chemical composition of biomass for recycling. During torrefaction, biomass is heated slowly in an inert or oxygen-deficit environment to a maximum temperature of 300°C. The torrefaction process creates a solid uniform product with lower moisture and higher energy content than the raw biomass. During torrefaction, moisture and some volatile organic compounds volatilize from the biomass. Depending on stoichiometry and other conditions, non-condensable gas species, including CO and CO2, are formed. The specific objectives of this research are to: 1) understand the impact of torrefaction on product quality in terms of the physical properties, chemical composition, and storage behavior of the biomass; 2) discuss the various reactors used for biomass torrefaction; and 3) develop a model for designing a moving bed torrefier, considering fundamental heat and mass transfer calculations. Torrefaction improves the physical properties, chemical composition, and energy and storage properties of biomass. Torrefaction of biomass at 300°C increases the energy content by about 30% as compared to the raw biomass. For example, when torrefied, the calorific value of the biomass increases from about 18–19 MJ/kg to about 20–24 MJ/kg. The torrefied material has a moisture content of about 1–3% wet basis (w.b.). The loss of the hydroxyl group during torrefaction makes the biomass hydrophobic. The brittle nature of the torrefied biomass makes it easier to grind. The devolatilization and carbonization reactions change the proximate and ultimate composition. The carbon content increases, whereas the hydrogen, oxygen, and nitrogen content of the biomass decreases. Despite its superior properties, the commercialization of torrefaction technology is slow due to challenges associated with reactor design and final product quality. The different types of reactors that are typically used for biomass torrefaction are the fixed bed, rotary drum, microwave, fluidized bed, and horizontal and vertical moving bed. The moving bed reactor has gained popularity among the different torrefaction reactor designs as it is easy to operate and scale. In addition, it helps produce a uniform torrefied product. In this paper, different moving bed torrefaction and gas recycle concepts are conceptualized to assess the features, advantages, and disadvantages of various design and operating concepts. These designs include example concepts for: 1) vertical and horizontal torrefaction reactors; 2) recycle of all or a portion of the torrefier off-gas; 3) counter and co-flowing gas and biomass in the torrefier; 4) controls for the system temperatures, pressures, flow rates, and gas compositions; and 5) the ability to sample the biomass feed, torrefied product, and gas streams for analysis as needed to investigate the thermal decomposition, physical behavior, and operational performance of the torrefaction system. The article also briefly describes the solid feed system, gas supply and recycle system, solid product management, torrefier gas monitoring, control system, and fugitive dust emissions control. The model presented in this paper includes a set of equations for basic calculations to configure the torrefaction reactor dimensions, such as diameter and height of the moving bed torrefier for different capacities based on target and calculated solids and gas velocities, residence times, and temperatures.
Biomass is estimated to contribute on the order of 10–14% of the world’s total energy supply (U.S. Energy Information Administration (EIA), 2018). A joint report published by the United States (U.S.) Department of Energy (DOE) and Oak Ridge National Laboratory (ORNL) suggest that more than 1.2 billion tons of biomass are produced annually (U.S. Department of Energy (DOE), 2016). Various types of biomass, such as woody and herbaceous biomass (i.e., energy crops, fast-growing trees, grasses, and aquatic plants) and waste biomass streams (i.e., agricultural wastes and forest residues composed of branches, dead trees, and tree stumps) are used for bioenergy production (Tumuluru, 2020). Examples of woody biomass wastes include forest, plantation, shrub, and other wood wastes. Herbaceous biomass wastes include non-woody plants and by-products from agriculture, orchards, and horticulture. The other biomasses used for bioenergy production are aquatic biomass, algae, water hyacinth, seaweed, and organic material from municipal solids (Tumuluru, 2020).
Woody, herbaceous aquatic, and municipal solid waste biomass have variable physical properties and chemical compositions. These physical properties—such as bulk density, irregular size, and inconsistent shape—create transportation, storage, handling, and flow challenges that limit biomass use for large-scale bioenergy production applications. Both woody and herbaceous biomass has higher moisture content and lower calorific value than coal and oil. The higher moisture content and lower energy content of biomass reduce conversion efficiency. Higher moisture in the biomass can also increase biological degradation (i.e., molding and rotting) during storage and transport, increase energy consumption during grinding, and produce high particle size distribution variability. Many of the grinding studies conducted by various researchers have indicated that grinding energy increases with increased moisture content (Tumuluru, 2014; Tumuluru and Yancey, 2017; Tumuluru and Heikkila, 2019; Tumuluru et al., 2021). According to Gronnow et al. (2013), the performance of the biomass for direct combustion is poor because of the typically low energy density, high moisture content, poor grindability, poor handling properties, and high heterogeneity in the physical properties and chemical composition. These issues reduce the efficiency and commercial viability of biomass recycling.
The thermal pretreatment process known as torrefaction helps reduce biomass variability in terms of its physical properties and chemical composition, increase its energy content, decrease its moisture content, and reduce its biological degradation. According to Mamvura and Danha (2020), biomass torrefaction can improve biomass properties on a level equal to coal for power generation. In addition, torrefaction can be a pretreatment step before pyrolysis and gasification to improve the process efficiencies. There is a lot of published data on the torrefaction process and product properties, but the literature on torrefaction reactor design concepts based on thermodynamics is scarce. Therefore, the specific objectives of this present research are to: 1) understand the biomass torrefaction process and its impact on the physical properties (such as moisture content, bulk density, and grindability), chemical compositions (such as the proximate, ultimate, and biochemical compositions), and storage stability in terms of hydrophobicity; 2) understand the various reactors used in the biomass torrefaction process; 3) develop a design model for a moving bed torrefaction reactor based on basic torrefier thermodynamics; and 4) use the model to design a torrefier with a throughput of 100 lb/h.
Torrefaction is the slow heating of biomass in an inert or oxygen-deficit environment in the temperature range of 200–300°C. The parameters that impact the torrefaction process are heating rate, reaction temperature, reactor environment, residence time, atmospheric pressure, feedstock flexibility, particle size, and moisture content. Biomass is typically pre-dried to <10% moisture content before torrefaction. In addition, feedstock particle size influences the torrefaction process kinetics, reaction mechanisms, and residence time for a given heating rate (Tumuluru et al., 2011). During the torrefaction process, moisture is evaporated, and some of the hydrogen- and oxygen-containing organic components of organic compounds are thermally decomposed, releasing volatile organic compounds (Beckman et al., 2012). A solid uniform product with lower moisture and higher energy content is produced at the end of the torrefaction process. In addition, some of the hydrophilic bonds are lost during the torrefaction process, making torrefied biomass more hydrophobic, thereby improving storage stability. The remaining solid biomass (solid) contains about 30% more energy per unit of mass based on the torrefaction severity. A temperature between 275 and 300°C, an inert environment, a residence time between 20 and 40 min, and a heating rate of 10°C/min to maintain the reactor temperature make biomass properties comparable to coal (Mamvura et al., 2018).
Figure 1 indicates the changes in biomass color and the chemical reactions that happen in the biomass at different temperature regimes in the thermal pretreatment process. Tumuluru et al. (2011) described the torrefaction process by first considering three temperature zones: 1) non-reactive (e.g., 50–150°C); 2) reactive (e.g., 150–200°C); and 3) destructive (e.g., 200–300°C). Various biomass reactions in these temperature regimes include: 1) dehydration; 2) devolatilization and carbonization of hemicellulose; 3) depolymerization and devolatilization/softening of lignin; and 4) depolymerization devolatilization of cellulose. These reactions bring significant changes in biomass physical properties, chemical composition, and energy content. These changes depend upon temperature and residence time, heating rate, biomass type, and properties such as initial moisture, particle size, and shape. The initial heating of biomass up to 150°C (e.g., the non-reactive drying zone) removes the unbound water. Further increasing the temperature to 150–200°C removes most of the bound water. Temperatures >200°C cause thermal decomposition, devolatilization, and carbonization reactions. The lignin in the biomass softens at the glass transition temperature, where the lignin molecules become more mobile. Most biomass hemicellulose undergoes decomposition reactions, resulting in significant changes in color, chemical composition, and physical characteristics. At higher temperatures >280°C, these reactions can produce gaseous CO, CO2, phenols, acetic acid, and other higher volatile hydrocarbons. These reactions cause hemicellulose degradation, which destroys the O-H and C=O groups functional groups, thereby making the biomass hydrophobic and increasing storage stability.
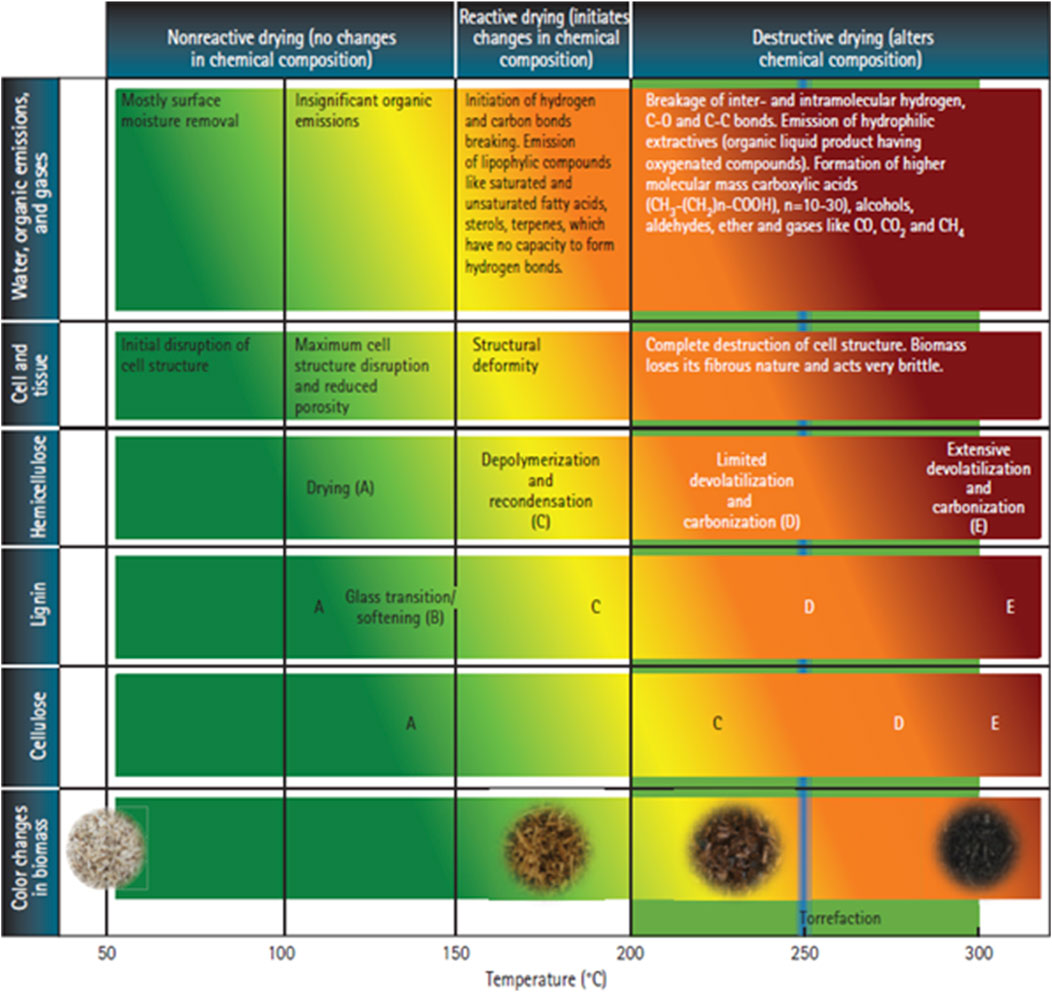
FIGURE 1. Changes in the biomass at different temperature regimes (Tumuluru et al., 2011).
The increased energy density and upgraded quality of the torrefied material is the most important advantage of torrefaction. Energy yield during torrefaction is the function of the temperature and the duration of the process. Two parameters used to understand the effectiveness of torrefaction are mass and energy yield (Dhungana et al., 2012). Biomass components, such as water and ash content, reduce the energy content. Reducing or eliminating these components increases the energy content of the biomass (Fisher et al., 2012). According to Hill et al. (2013), the mass yield during torrefaction is the ratio of dry torrefied biomass to the dry, untreated biomass (Eq. 1). The energy yield during torrefaction is the ratio of the lower heating value of char over the lower heating value of untreated biomass (Eq. 2).
The mass yield from torrefaction usually is less than 1. Therefore, even though there is some biomass energy loss during torrefaction due to the loss of volatile organic material (e.g., between 3–17% as reported by Hilten et al., 2013a), the energy yield usually is greater than one because of the reduced torrefied product mass. Hilten et al. (2013b) also reported that the net thermal process efficiency is defined as the energy yield in the torrefied products divided by the total energy input (e.g., the energy content of the feedstock plus energy added to the heat and run the torrefaction process).
According to published data, the best torrefaction mass and energy balance target is when the biomass loses about 30% of its initial dry mass (Huang et al., 2012). In this case, the material could lose about 10% of its initial energy content, so the energy yield is (100–10%)/(100–30%) = 1.3, as reported by Kim et al. (2012). Thus, the net process thermal efficiency usually is less than one, but can be increased by recovering both the heat and the chemical energy of the torrefier gas.
Moisture is an important parameter during thermochemical conversion as initial high moisture content results in energy loss during biomass burning. Torrefied biomass typically has a moisture content of 1–3% (w.b.). Torrefaction of pine biomass indicated that moisture content decreased with increased torrefaction temperature and residence time (Tumuluru, 2016). At 270°C torrefaction temperature and 120 min residence time, the lowest moisture content of about 1.2% (w.b.) (about 69% moisture loss) was observed. A similar study conducted by Tumuluru (2015) on the torrefaction of corn stover and switchgrass resulted in a similar observation where the moisture loss was about 79–88% at about 270°C and 120 min (Tumuluru et al., 2012a). According to Ribeiro et al. (2018), the significant advantages of lowering the moisture content are: 1) reduced moisture level for downstream energy conversion processes; 2) reduced transportation costs associated with moving unwanted water; and 3) the prevention of biomass decomposition and moisture absorption during storage and transportation.
Biomass torrefaction results in the loss of material that evaporates or volatilizes at torrefaction temperatures. This process results in the increased porosity of the biomass, thereby decreasing the bulk density. The potential bulk density loss can vary widely depending on the initial biomass properties and torrefaction conditions. A study conducted by Oliveira-Rodrigues and Rousset (2009) on the torrefaction impact on Eucalyptus grandis indicated a decrease in bulk density of only about 2% at 220°C, which increased to about 14% at 280°C. Chen et al. (2015) reported a decrease in bulk density of about 180–350 kg/m3 based on the conditions of their studies. Many researchers have observed the increase in the energy content of biomass when torrefied at different temperatures and residence times. (Bergman and Kiel, 2005; Tumuluru et al., 2011; Tumuluru et al., 2012b; Lee et al., 2012; Ribeiro et al., 2018). Bergman et al. (2010) observed that the calorific value of pine woodchips increased from 11 to 20 MJ/kg. Tumuluru (2016) found that the heating value of lodgepole pine increased from about 19 MJ/kg to about 24 MJ/kg when torrefied at 270°C for 30 min. Oyebode and Ogunsuyi (2021) reported that the higher heating value of the stool tree (Alstonia congenisis Engl) was about 30 MJ/kg when torrefied at about 300°C. Phusunti et al. (2018) reported that torrefied microalgae reached the highest calorific value of about 19 MJ/kg after torrefaction at 200°C for 30 min.
Biomass grinding is an essential preprocessing unit operation. It helps reduce the particle size of the biomass and makes it a more usable material for pelletizing or other handling unit operations. The grinding behavior of raw and torrefied biomass is different. Due to its fibrous and potentially soft and moist nature, raw biomass is difficult to grind and consumes more energy, resulting in variability in particle size distribution. Torrefaction can increase grindability by making the biomass particles shrink and become more brittle, improving grindability and reducing grinding energy (Tumuluru, 2017). During torrefaction, the hemicellulose breakdown and depolymerization of the cellulose reduces fiber length (Tumuluru et al., 2011). Many other researchers have also found that torrefaction improves grindability as summarized below:
1) Grinding studies conducted by Bergman and Kiel (2005) on raw and torrefied biomass like willow, demolition wood, wood cuttings, and coal using a heavy-duty cutting mill indicated that the power consumption was reduced by about 70–90% after torrefaction. They also found a 7.5 to 15% increase in grinding throughput.
2) Phanphanich and Mani (2011) observed the grinding energy decreased from about 240 to 40 kWh/t when forest biomass was torrefied at 300°C for 30 min. These authors concluded that the grinding behavior of the torrefied biomass was like coal.
3) Repellin et al. (2010) concluded that dehydration reactions in torrefied woody biomass induce a shrinking of the lignocellulosic material. These authors concluded that lignin passes through a glass transition during the initial stages of torrefaction, whereafter it cools and solidifies. Torrefaction also creates cracks in lignin, decreasing the plastic and viscoelastic behavior. Among the hemicellulose, the xylans degradation happens at lower torrefaction temperatures.
4) A study conducted by Wang et al. (2017) on the torrefaction of woody biomass indicated that the grinding energy decreased by half, and that the particle size also decreased after torrefaction.
5) According to Rousset et al. (2011), the shape of torrefied particles after grinding was more spherical, where the ratio of diameter to length was near to 1. Spherical particles help to improve the fluidization behavior in the particles. Based on the Geldart classification, the size-reduced torrefied biomass is suitable for fluidizing in a gasification reactor (Rousset et al., 2011).
6) Ghiasi (2019) studied the grindability of torrefied pellets. Figure 2A provides a look at the energy consumption of untreated and torrefied pellets. In this study, the pellets are torrefied in N2 and ground in a knife mill equipped with a 3.15 mm screen. The total area under the curve gives the total energy consumption for grinding. It is very clear from Figure 2A that the higher the degree of torrefaction, the lower the power consumption. For example, the untreated pellets took a maximum power of about 1,100 J/s, whereas pellets torrefied at 280°C required maximum power consumption of about 650 J/s. Figure 2B indicates that the fines in the grind changed after torrefaction.
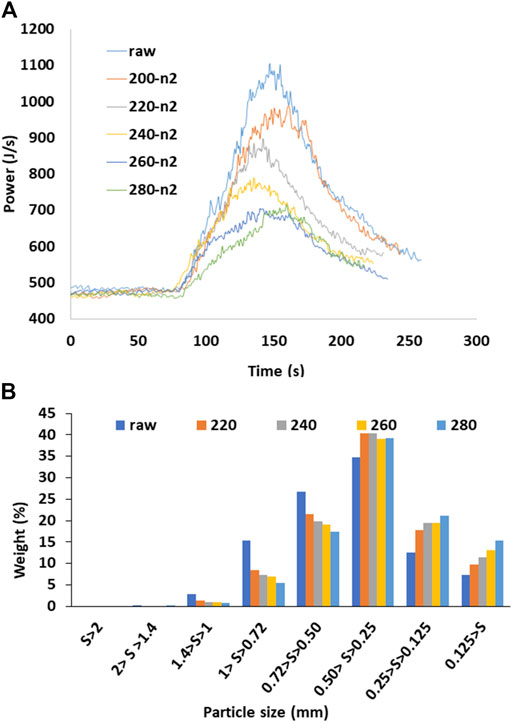
FIGURE 2. (A) Grinding energy consumption and (B) particle size distribution of untreated and torrefied groundwood pellet (Ghiasi, 2019).
Many researchers have reported generally consistent results of chemical changes in biomass from torrefaction: lower moisture, hydrogen, sulfur, and volatile organics content; higher carbon content; and destruction and lower concentrations of organic structures including hydroxyl and methoxyl groups, cellulose, hemicellulose, and lignin. The degree of these chemical changes depends on the biomass and torrefaction conditions. Some results of individual studies are summarized below:
1) According to Tumuluru et al. (2011) and Tumuluru et al. (2012a), the torrefaction of woody and herbaceous biomass resulted in changes to its proximate and ultimate composition, as well as its energy content. The loss of moisture and low energy content material during torrefaction resulted in chemical composition changes in the biomass.
2) Phusunti et al. (2018) studied the impact of torrefaction on microalgae physical properties, chemical composition, and reactivity. The results indicated that torrefaction impacted the particle morphology, proximate analysis, ultimate analysis, higher heating value, and chemical composition. The results also showed that mass yield and changes in the microalgae’s properties were more influenced by torrefaction temperature than residence time. In addition, the authors observed that at higher torrefaction temperatures, the thermal degradation rates decreased for proteins and carbohydrates, whereas the degradation rates accelerated for lipids.
3) Torrefaction of lodgepole pine at 270°C and 120 min decreased the total water and volatile organics content from 80% to about 45%, while the ash content increased from 0.77% to about 1.9% (Tumuluru, 2016). The other chemical components—hydrogen, oxygen, and sulfur—decreased to about 3, 28, and 0.01%, respectively. The elemental mole ratio of hydrogen to carbon and oxygen to carbon (H/C and O/C) after torrefaction were about 0.56 and 0.47, respectively.
4) Oyebode and Ogunsuyi(2021) reported that the torrefaction temperature significantly impacted the chemical composition of stool tree (Alstonia congenisis Engl) samples. These authors also observed that the moisture, volatiles, hydrogen, and oxygen content in the biomass decreased significantly at a higher temperature of 300°C, whereas the hydrogen content decreased from an initial content of about 6.4% to about 3.4%, and the oxygen content decreased from an initial content of roughly 47% to roughly 18%. Further Fourier transform infrared (FTIR) analysis by these same authors indicated that the hydroxyl and methoxyl groups were decomposed during torrefaction. This resulted in the decrease in oxygen and hydrogen content of the biomass. The fiber composition analysis conducted by these authors indicated that the cellulose content increased from about 35 to 40% up to a torrefaction temperature of 250°C. In contrast, after torrefaction at 300°C, the cellulose content decreased to about 7%, while the hemicellulose content decreased from an initial value of about 27% to about 2%. These same authors also found that total lignin increased from an initial value of 30% to about 68% after torrefaction at 300°C. In addition, the extractives and hemicellulose decreased with an increase in torrefaction temperature. These authors concluded that an increase in lignin content increased the pelletability potential of the biomass.
5) A study on the torrefaction of hemicellulose, lignin, and cellulose at 210–300°C and a 20–60 min residence time by Zheng et al. (2015) indicated that the thermal stability of the cellulose was the highest, followed by lignin and hemicellulose. Another torrefaction study at 210–300°C and a residence time of 30 min by Zheng et al. (2017) indicated an increased ash and fixed carbon content, but a reduced volatile organics content.
6) Torrefaction research on woody biomass conducted by Wang et al. (2017) indicated that the hemicellulose content of torrefied stem wood and stump wood decreased with an increase of torrefaction temperature and a residence time with only trace amounts left at 300°C. The cellulose content in the bark decreased at a torrefaction temperature of 275°C.
7) Baicar et al. (2018) studied the relationship between the torrefaction parameters and the physicochemical properties of torrefied products from plant-based biomass. The results indicated that the process increased the calorific value of the biomass by more than 20% under the conditions they studied. This study also indicated an increase in total carbon content and ash content, whereas the hydrogen, oxygen, and moisture content decreased.
8) Ramos-Carmona et al. (2017) studied the effect of torrefaction temperature on the properties of patula pine. The results indicated that the torrefied pine has a higher chemical energy due to reducing O/C and H/C ratios and heating value. Compared to raw biomass, the material’s thermal behavior and chemical composition torrefied at 200°C and 250°C did not significantly change, whereas at 300°C, both the chemical composition and thermal behavior changed significantly. An analysis of torrefied material using pyrolysis gas chromatography (Py-GC) indicated a progressive thermal degradation of hemicellulose, cellulose, and lignin with an increase in torrefaction temperature. The oxygen content decreased from about 42 to 33%, and the highest calorific value of about 24 MJ/kg was achieved. Based on this study, torrefaction destroyed the cellulose and hemicellulose, which reduced the O-H (oxygen-hydrogen) and C-O (carbon-oxygen) content and increased the carbon-carbon bonds.
During the torrefaction process, the hydroxyl groups in the biomass are partially destroyed by dehydration, which prevents the formation of hydrogen bonds, thereby causing the torrefied biomass to become hydrophobic. The hydrophobic nature of biomass makes it less susceptible to degradation during storage. Some studies have indicated that dry matter losses are minimal during storage.
Figure 3 shows the average percentage of water uptake when the pellets are immersed in water for a period of 10–60 min. In the case of untreated pellets, the weight increased considerably in the first 10 min, reaching up to 165% of the initial mass. The moisture uptake slowed after 10 min. Pellets torrefied at 200°C reduced the water uptake to less than 40% of the initial mass of the pellets in the first 10 min. Increasing the torrefaction temperature further decreased the water uptake. Water uptake in pellets torrefied at 240°C was about 4% of the initial weight; for pellets torrefied at up to 280°C and 300°C, the uptake was minimal. It is evident that torrefied pellets resisted the water uptake and any further disintegration.
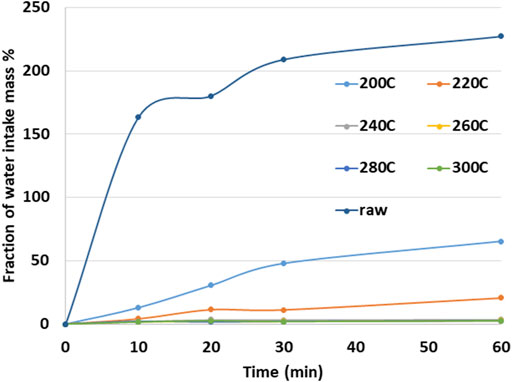
FIGURE 3. Percentage pellet mass increase after immersion of N2 -torrefied pellets in water as a function of time (Ghiasi, 2019).
A set of photos taken at various stages of immersion in water for the pellets is shown in Figure 4A,B. The time interval between each was approximately 10 min. The untreated pellets disintegrated during the first 10 min. Most of the untreated pellets were dispersed in water during the entire 60 min of the test. Pellets torrefied at 200°C maintained their initial form during the first 10 min of immersion in water. After 60 min, these pellets showed a degree of disintegration. Increasing the torrefaction temperature further decreased the degree of pellet disintegration. The pellets torrefied at 240°C stayed firm without any sign of breakdown when immersed in water for about 60 min. This result shows that increasing the severity of the treatment improved hydrophobicity (Figure 4A). Figure 4B shows the image of pellets torrefied at 260, 280, and 300°C, and immersed in water up to 60 min. It is very clear from the photographs the pellets retained their integrity even after 60 min of immersion in water. The study indicated higher torrefaction temperature helped pellets to retain their integrity even after long storage periods.
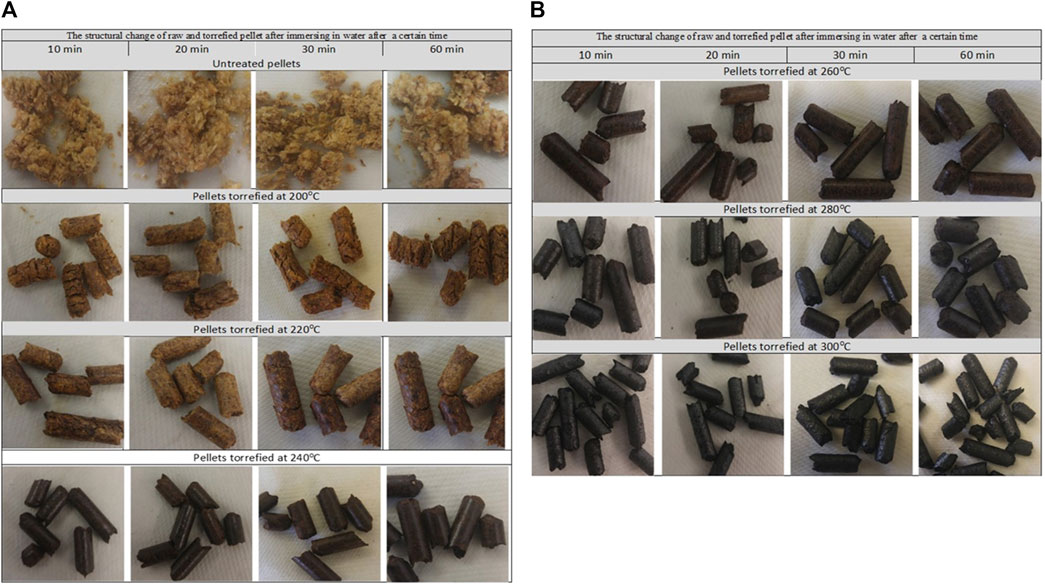
FIGURE 4. (A, B) Physical appearance of non-torrefied and torrefied pellets after immersion in water for 10–60 min (Ghiasi, 2019).
Figure 5A,B, respectively, are photographs of untreated and torrefied pellets kept in boiled water (e.g., 100°C) for 30 min. The untreated pellets disintegrated completely very quickly. A sticky caramel-type liquid was observed in the water, whereas torrefied pellets remained firm and retained their original shape, and the color of the water did not change. The torrefied pellets were also immersed in the water and frozen at ∼–20°C. Figure 5C clearly shows that the torrefied pellets kept their shape and physical form. The water from melt ice remained clear on the surface. The quality and physical structure of the thermally pretreated pellets remained firm even after freezing and thawing.
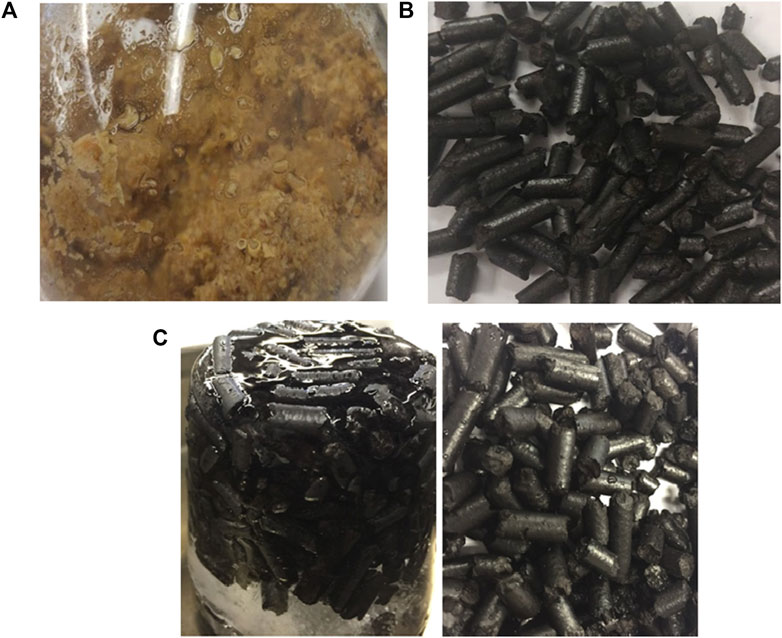
FIGURE 5. (A) Physical appearance of untreated, (B) torrefied pellets boiled in water for 30 min, and (C) frozen torrefied pellets (left) and after de-freezing (right) (Ghiasi, 2019).
Table 1 gives the benefits of using torrefied biomass in terms of physical properties, storage and handling, economic benefit, and bio-oil quality. The improvements in biomass properties are in comparison with the untreated biomass. Studies conducted by Sarker et al. (2014) and Yang et al. (2014) indicated that torrefied and densified switchgrass can successfully be used for gasification and pyrolysis. Gasification studies on torrefied and densified switchgrass resulted in the highest yields of H2 (0.03 kg/kg biomass) and CO (0.72 kg/kg biomass) and the highest syngas of energy content (5 MJ/m3), carbon conversion efficiency (CCE) (93%), and cold gas efficiency (CGE) (68%) at a gasification temperature of 900°C compared to raw switchgrass. Pyrolysis studies of torrefied switchgrass indicated that torrefied switchgrass had higher anhydrous sugars and phenols than raw switchgrass. The higher torrefaction of 270°C increased the anhydrous sugars and phenols in pyrolysis products, whereas the guaiacols content decreased. The same authors concluded that the densification of the torrefied biomass might have increased the depolymerization of cellulose and hemicellulose during pyrolysis.
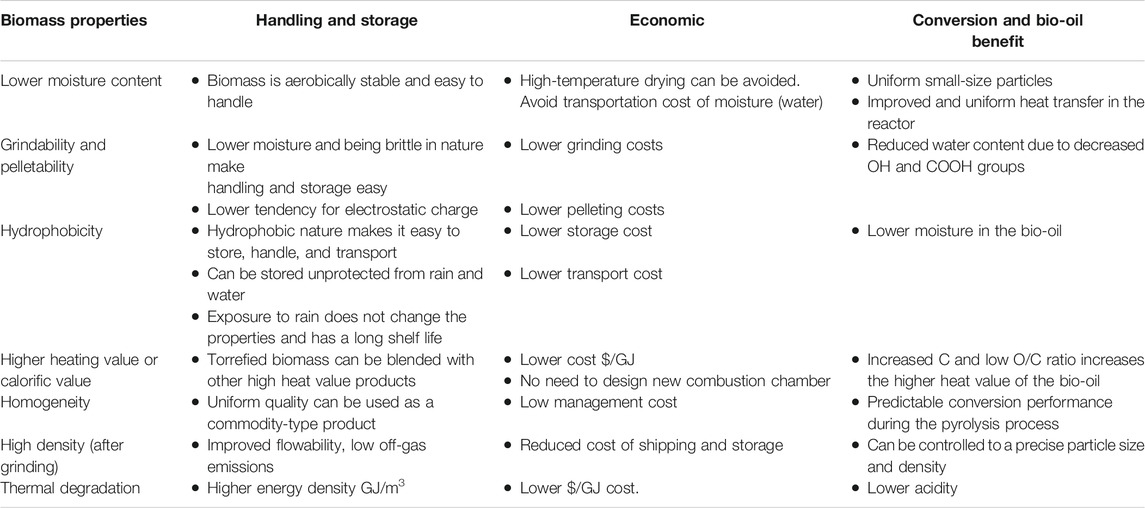
TABLE 1. Benefits of torrefaction on biomass properties, handling, and storage, economics, and bio-oil quality (Ghiasi, 2019).
Many different torrefaction reactor designs—such as fixed bed, microwave, rotary drum, fluidized bed, and augur-driven—have been conceptualized, tested, or operated (Tumuluru et al., 2010; Batidzirai et al., 2013; Chen et al., 2013; Nachenius et al., 2013; Eseyin et al., 2015; Tumuluru, 2017; Basu, 2018; Mamvura and Danha, 2020). According to Chen et al. (2021), torrefaction reactors are classified based on the movement of the biomass and the heat transfer methods. According to these authors, various reactors that commercial companies are working on include: 1) the fixed bed reactor; 2) the rotary drum reactor; 3) the screw reactor; 4) the microwave reactor; 5) the moving bed reactor; and 6) many others, such as the torbed reactor, the belt drier, the multiple hearth furnace, the vibrating electrical elevator, the REVE reactor, the rotating-packed bed reactor, and the spouted-bed reactor. It should be noted that biomass feedstock type plays a major role in reactor selection. Those that are useful for research are less useful for commercial applications. For example, a 2012 study conducted by Tumuluru et al. (2012a) in a sand bed reactor provided positive biomass torrefaction results, but the resulting torrefied product was contaminated with sand, which was difficult to remove and adversely affected the commercial usefulness of the product.
Each reactor design has its advantages and disadvantages. The focus of research on torrefaction reactor design has been to get a uniformly torrefied product. This is achieved by designing a reactor with uniform heat and mass transfer. Several authors identified various reactors that are commonly used for biomass torrefaction (Mamvura and Danha, 2020; Nachenius et al., 2013; Batidzirai et al., 2013). Some torrefaction reactor designs used at the laboratory- and pilot-scales are listed in Table 2 (Ghiasi, 2019).
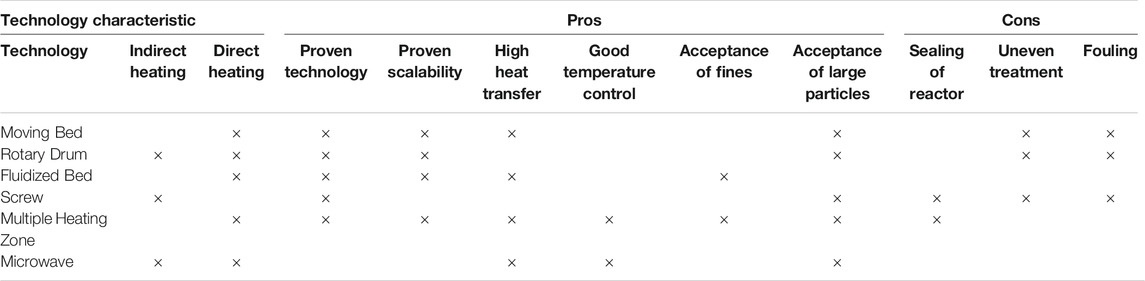
TABLE 2. Various torrefaction designs and qualitative assessments (Ghiasi, 2019).
The fixed bed reactor (Figure 6) is extensively used to conduct laboratory-scale torrefaction studies to understand the impact of process conditions on product properties (Mamvura and Danha, 2020; Tumuluru et al., 2012a). Ribeiro et al. (2018) used a fixed bed reactor where biomass was dried and torrefied in a furnace. According to these authors, this is the simplest form of the reactor for biomass torrefaction. The biomass is cooled at the end of the process and is collected for further analysis. Tumuluru et al. (2012a) used a variation of this design, as shown in Figure 6, for the torrefaction experiments. In this batch process, the biomass is suspended in a metal mesh basket in an industrial fluidized sand bed (Techne Inc., NJ, U.S.) with a temperature range of 50–600°C. A gas line is then used to deliver preheated nitrogen gas to the test chamber to fluidize the sand and maintain the inert environment. The fluidized sand provides heat and mass transfer to the fixed bed of biomass in a basket. An electrically heated thermal oxidizer is placed in line with the torrefaction system to burn out the volatiles before releasing them into the environment. The reactor is instrumented to record both bed and oxidizer temperatures. Some of the limitations of the fixed bed reactor are: 1) sampling of the product; 2) poor heat transfer and temperature control; and 3) scale-up (Chen et al., 2021).
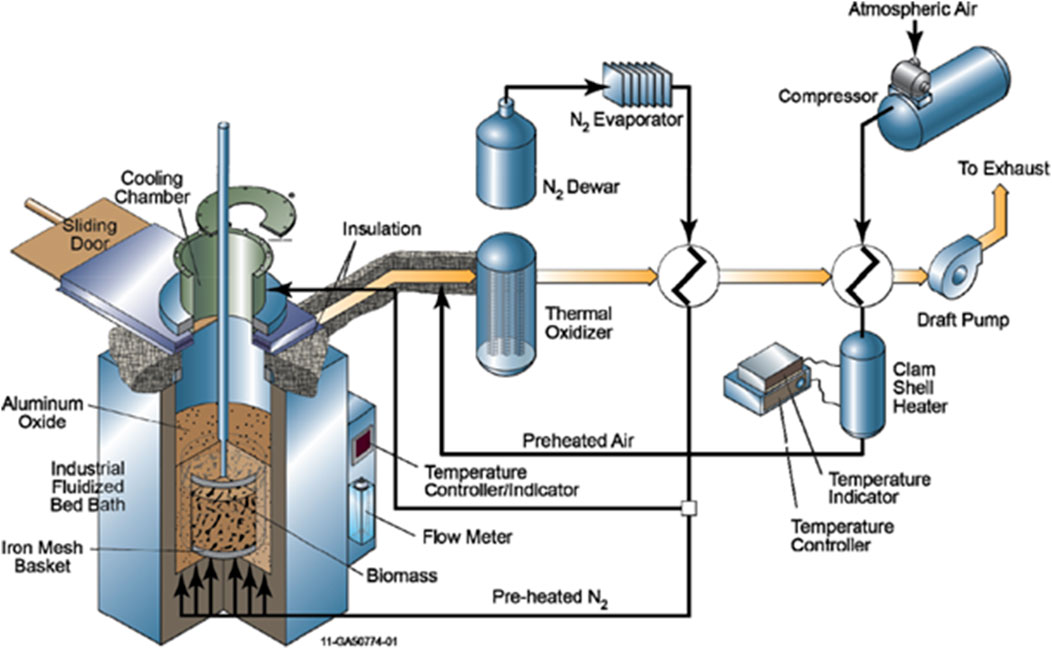
FIGURE 6. Fixed bed reactor for biomass torrefaction (Tumuluru, et al. 2012a).
Figure 7 shows the rotary drum reactor concept (Mamvura and Danha, 2020). Raw biomass is fed to the reactor at the inlet, and the torrefied product is discharged from the reactor outlet. The reactor drum rotates on the vertical axis, as shown in Figure 7. The drum is driven by an electric motor, which controls and regulates the drum rotation. As the drum rotates, the biomass progresses by gravity down the slope of the rotating drum, and internal fixtures mix the biomass. The biomass is heated indirectly from the outside of the drum, heated directly via heaters on the inside of the drum, or heated by preheated inert gas or recycled torrefaction gas that flows through the drum; or via a combination of two or more of these heating methods (Tumuluru et al., 2010).
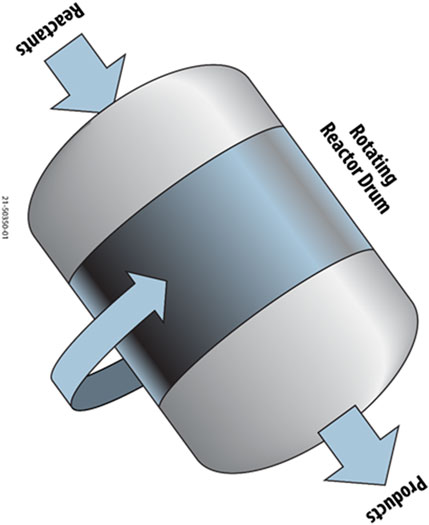
FIGURE 7. Rotary drum reactor for biomass torrefaction.
Manouchehrinejad and Mani (2019) modeled a rotary kiln torrefaction reactor and investigated its thermal and electrical energy requirements. According to these authors, the recycled torrefied gas (e.g., torgas) contributed up to 52% of the total thermal energy demand at 270°C. These authors concluded this is a simple technology and is easy to scale-up. However, the major disadvantage of this design is the generation of fines during the torrefaction process due to attrition caused by the rotating drum. Other disadvantages of rotary drums are fugitive emissions and stoichiometry control as seals at the ends of the drum wear. According to Chen et al. (2021), the disadvantages of the rotary drum bed are: 1) low thermal efficiency due to indirect heating; 2) less plug flow; and 3) scalability limitations as compared to other torrefaction reactors.
In this process, microwave radiation is the heat source (Mamvura and Danha, 2021), as shown in Figure 8. The heating of the biomass is more rapid and is consistently more uniform than in designs that depend on heat transfer from external heat sources. The electromagnetic radiation makes the water molecules or dielectric materials inside the biomass vibrate, which results in an internal energy increase that helps to torrefy the biomass. Typically, the microwave reactor uses 300 MHz to 300 GHz frequencies (Chen et al., 2021). The two main mechanisms that describe microwave torrefaction are dipolar polarization and ionic migration (Chen et al., 2021). The biomass residence in the microwave reactor depends on the type, size, and microwave radiation absorption capacity of the processed material and the reactor power (Stępień et al., 2017). Several researchers have studied microwave reactors (Batidzirai et al., 2013; Nachenius et al., 2013; Ren et al., 2013).
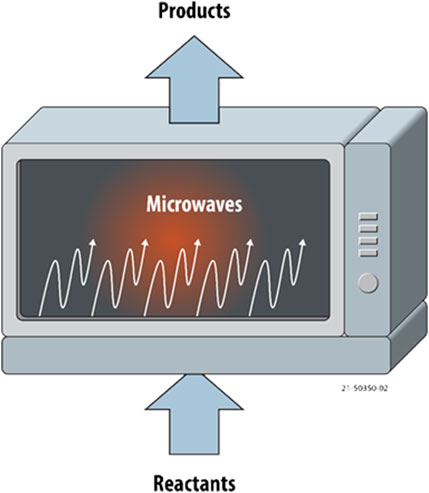
FIGURE 8. Microwave reactor for biomass torrefaction.
Tumuluru et al. (2012b) conducted a microwave torrefaction study on corn stover. These authors found that the biomass product was sufficiently torrefied after six minutes with a maximum calorific value of 21 MJ/kg and a maximum carbon content of approximately 53 wt%. To achieve the same calorific value using the torrefaction technique based on thermal heat, it took about 15 min. According to Zhang et al. (2019), upgrading energy index (UEI) is the ratio of the torrefaction energy yield (based on HHV) to the energy input (supplied electricity, kWh) into the torrefaction system. The UEI is essential to understand torrefaction process efficiency. Torrefaction of coffee grounds and microalgae residue using conventional and microwave torrefaction indicated that UEI values are higher for the microwave torrefaction process (Ho et al., 2018).
In a fluidized bed reactor, the biomass is fluidized using the inert hot gases blown from the bottom of the reactor. The raw biomass is size-reduced to smaller particles to be fluidized in the reactor to ensure a uniform temperature distribution throughout the bed (Nachenius et al., 2013). The major challenge of this process is the size-reduction of biomass to small sizes, which is very energy-intensive. The grinding energy is indirectly proportional to the grind size and inversely proportional to the moisture content. The smaller the grind size, the higher the grinding energy; the higher the moisture content, the higher the grinding energy. The fluidization conditions are met using a suitable velocity for the inert gases, which is usually higher than the minimum fluidization velocity. This system is not very commonly used for biomass torrefaction applications.
The horizontal moving bed reactor has its axis parallel to the ground, as shown in Figure 9A. Since a horizontal reactor cannot rely on gravity to advance the biomass through the torrefier, it must have a mechanism like an auger, screw conveyor, or belt to move the biomass horizontally through the system. The biomass is heated by preheated torrefier gas during transport, or by heating elements located in the reactor, or both. The most efficient way to heat the biomass using preheated torrefier gas is to flow the gas in a direction counter to the direction of the biomass, as shown in Figure 9A. The particle residence time in the reactor depends on the length of the torrefier zone and the speed of the conveyor/auger system. The advantage of auger-type reactors is their relatively low price, simplicity of adaptation to a large industrial scale, and low inert gas demand. The disadvantages include a limited production capacity, uneven heating of the biomass, excessive product charring, and condensed tar and coke build-up, which tends to plug the system.
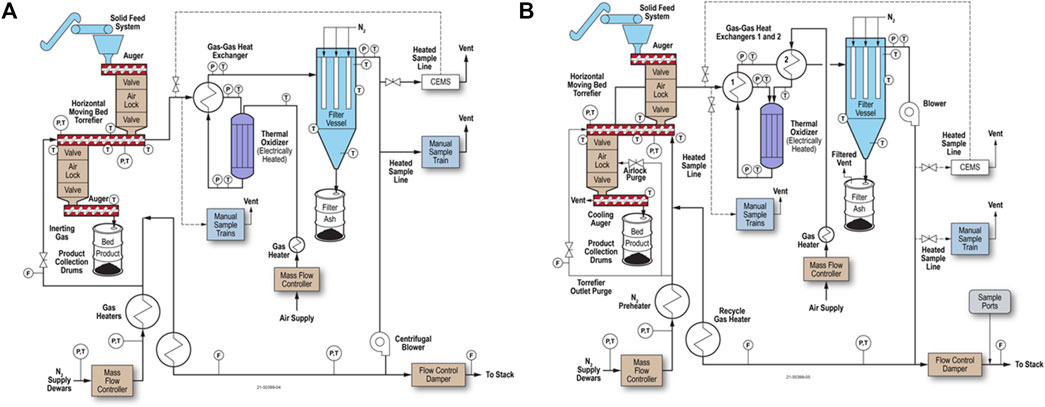
FIGURE 9. Horizontal moving bed torrefaction system with (A) counter-flowing gas and biomass and process gas oxidation upstream of filtration; and (B) co-flowing gas and biomass and process gas oxidation upstream of filtration.
Figure 9B shows a horizontal torrefaction system where the gas flow direction is in the same direction as (co-flow with) the direction of the biomass flow. This design is less efficient for heating biomass using preheated torrefier gas than the gas counter-flow design and has to rely more on indirect heating through the reactor walls. The potential benefit of this design is reduced tar and moisture build-up in the torrefier as compared to the counter-flow designs. In counter-current gas flow, the preheated gas is at its hottest in the gas inlet region (e.g., the torrefied product outlet region). The gas cools as it heats the biomass and from endothermic evaporation and volatilization reactions and will be the coolest at the gas outlet (e.g., the biomass inlet region). Tar species that tend to volatilize in the higher temperature gas inlet (e.g., torrefaction) region tend to condense in the cooler gas outlet (e.g., biomass inlet) region. As the gas cools when it progresses through the biomass heating and drying sections, some of the volatilized tars will condense on the cooler biomass and reactor internal surfaces. This reflux of volatilized and condensed tar will cause tar to build up in the torrefier and cause tar residence times in the torrefier of perhaps minutes to hours, even though the gas residence time is on the order of seconds. In this case, the tar continues to pyrolyze, convert to coke, and eventually cause tar and coke fouling inside the torrefier.
This tar recycle and build-up can be avoided if the gas flow is in the same direction as the biomass flow, as shown in Figure 9B. As the gas and biomass progress through the heating, drying, and torrefaction zones, both the gas and the biomass will be heated through the walls of the heated torrefier. When tars volatilize from biomass, they stay volatilized because the gas and biomass temperatures both increase as both the gas and biomass flow to the torrefier outlet. The tars exit the torrefier with the hot outlet gas instead of condensing, refluxing, and building up inside the torrefier. The residence time of volatilized tars and moisture is only as long as the residence time of the gas in the torrefier, on the order of seconds, thus shortening the time during which the tars could pyrolyze into coke and cause fouling. The tars can be managed downstream of the torrefier by cooling and condensing from the torrefier gas stream, or (as in this case) the gas stream can remain hot with tars still in gaseous form until the tars and volatilized organics are destroyed in the oxidizer.
Figure 10A shows a vertical moving bed reactor design. The reactor operates with gravity down-flow of biomass and buoyant heated gas up-flow. The counter-flow design allows for biomass torrefaction near the bottom of the reactor with drying in the upper zone (Tumuluru et al., 2010), which is more thermally efficient than co-flow or cross-flow designs. The biomass can be heated with recirculating torrefier gas (Nachenius et al., 2013). The bed solids are typically stirred with an axial shaft with mixing appendages, which breaks up gas and particle channels, minimizes biomass sticking together or to the walls, and improves gas distribution. In addition, the freeboard above the moving bed can be expanded in diameter to enable gas-solids disengagement better.
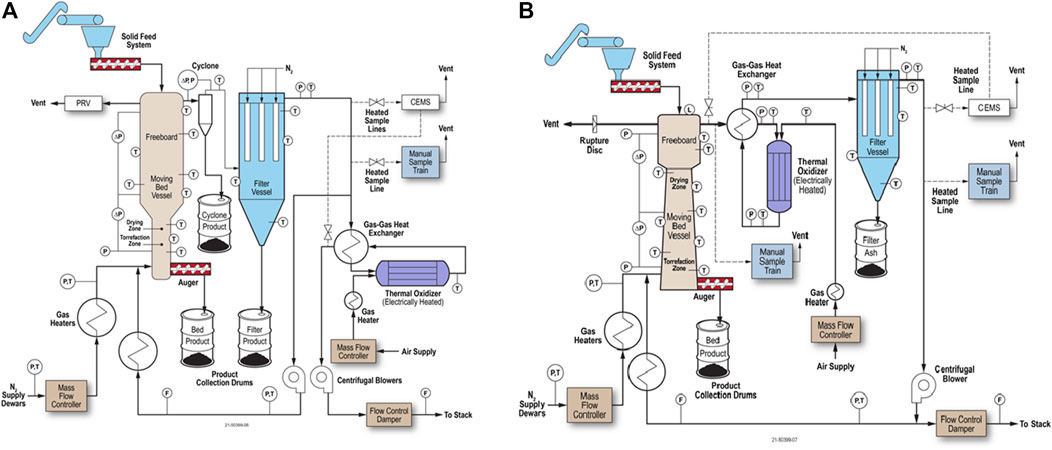
FIGURE 10. Torrefaction system diagram showing a vertical moving bed torrefier: (A) with counter-flowing gas and biomass where only the torrefier gas that is discharged is oxidized; and (B) with a negative-sloped torrefier and process gas oxidation upstream of filtration.
Various inert gas (N2) purge streams are used in the solid feed system, different pressure ports, product auger systems, and product collection drums. These purges have typically low flow rates, but are essential to enable pressure monitoring, reduce ingress of ambient oxygen and fire potential, and migration/condensation of water and condensable volatiles into areas where they could condense and cause plugging or fouling.
The reactor inlet and outlet piping are heated electrically or by other means, such as steam, and insulated to avoid cold spots and ensure uniform temperature control. In this configuration, the torrefier outlet gas remains hot to prevent the condensation of any condensable materials as it flows through a cyclone and filter to remove particulate matter. The filtered torrefier gas is then split so that as much gas is needed is heated further and recycled back to the torrefier. The remaining torrefier gas flows through a gas-gas heat exchanger and oxidizer, which oxidizes CO and hydrocarbons in the gas stream to H2O and CO2 before atmospheric discharge.
Figure 10B shows a negative-sloped vertical torrefier and oxidation of the torrefaction outlet gas before filtration. These two changes reduce the chances of plugging in the torrefier with the negative slope and decrease fouling of the condensing material in the process gas system by destroying the condensable organic material prior to the filter, thereby converting it to primarily CO2 and H2O in the oxidizer. As a result, no torrefied fines are recovered as a product; any fines in the torrefier outlet gas are oxidized to inorganic ash in the oxidizer before filtration.
An advantage of a vertical moving bed reactor is its compact and simple design and a high heat transfer rate via the heat-carrying gaseous medium (Chen et al., 2021). The desired flow rate of the feedstock and the reaction duration will influence the height of the column. With optimized conditions, a short residence time can be achieved. As the reactor fills full in a moving bed reactor, the pressure drop will be high, and it is essential to consider the blower cost when evaluating the cost of the torrefaction process (Chen et al., 2021).
Tumuluru et al. (2010) designed and demonstrated a vertical moving bed torrefier at Idaho National Laboratory (INL). This is a gravity-fed, atmospheric pressure torrefier system and is heated externally using a band heater. The reactor used an internal stirrer to prevent particle bridging. The torrefied biomass coming from the bottom of the reactor was cooled to about 50°C. The reactor could be operated in the temperature range of 150–300°C with a biomass residence time of 15–60 min. The biomass is metered into the reactor using a rotary airlock and a horizontal augur. More details about the process off-gas and equipment are provided in the collaborative work conducted by INL and Oklahoma State University (Sarkar et al., 2014). This study indicated that switchgrass biomass is more uniformly torrefied than the earlier work using the fixed bed torrefaction reactor on miscanthus and white oak sawdust (Tumuluru et al., 2021a).
A Microsoft® Excel™ model design was first developed and reported by Tumuluru et al. (2010). An update of this model is reported in this paper. This model can be used to calculate torrefier size, such as torrefier length—assuming a cylindrical shape and diameter—and the operating conditions of a torrefaction system. This model can also be used to calculate the gas and solids residence times and gas production and recycle rates based on estimated input values, such as the output torrefied product rate, the biomass properties—moisture, volatiles content, particle size, specific heat, etc.—expected heat transfer rates, and desired operating temperatures. The model uses a simplified generic four-zone moving bed torrefier system, as shown in Figure 11A, where biomass is first heated to a user-defined drying temperature in Zone A; dried at constant temperature in Zone B; heated from the drying temperature to a user-defined torrefaction temperature in Zone C; and torrefied at a constant temperature in Zone D.
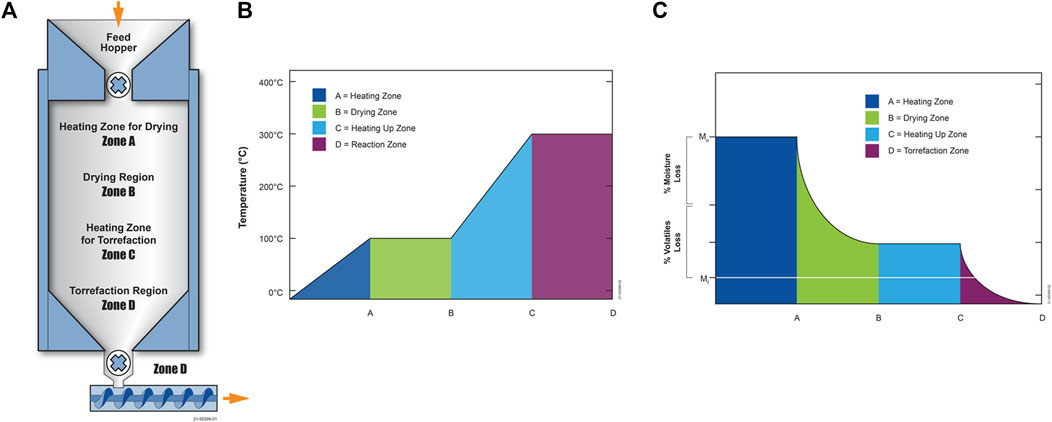
FIGURE 11. (A) Torrefier thermodynamic zones (B) illustration of biomass temperature profile (C) biomass solid mass as it passes through the torrefier.
As the biomass passes through Zones A-D, the temperature profile is shown in Figure 11B, where the drying temperature is 100°C, and the torrefaction temperature is 300°C. Figure 11C illustrates the mass loss of biomass as it dries in Zone B and devolatilizes during torrefaction in Zone D. Of course, in reality, there are no clear temperature or thermodynamic boundaries in the torrefier, and moisture loss and organics volatilization occur in more of a continuum as the biomass temperature increases. This model is merely used to simplify the calculations. However, this model accurately portrays that biomass temperature rise is lowest when moisture evaporation and organics volatilization rates are the highest when the energy input goes proportionately more to the heats of moisture evaporation and volatiles volatilization the biomass. The biomass temperature rises faster in regions where temperatures are not high enough for rapid evaporation and volatilization and when evaporation and volatilization are relatively complete at the user-selected drying and torrefaction temperatures.
The simplified torrefier thermodynamics are in the sections that follow.
Regardless of whether the gas flow is counter-current or co-current to the biomass flow, the gas temperature is higher than the ambient-temperature biomass entering the heating zone. This model also assumes that the walls of the torrefier are heated to a user-defined temperature. As such, heat transfer to the biomass occurs through convection, conduction, and thermal radiation. For simplicity, the model assumes that heat transfer from the gas to the biomass is dominated by convection heat transfer. So only convective heat transfer is calculated for heat transfer from the gas to the biomass in this zone (Eq. 3).
where T is the temperature at time t, Te is the equilibrium temperature, To is the initial temperature, h is the average heat transfer coefficient (W/m2 K), S is the total surface area (m2) of the biomass particles, ρ is the bulk density (kg/m3) of the biomass material, Cp is the specific heat of the biomass material (J/kg K), and V is the bulk volume of the biomass in the zone (m3). This equation, solved for time t, is used to determine the biomass residence time of the biomass in this zone and the length (or height) of this zone, assuming a user-specified cylindrical diameter.
The heat input required to raise the temperature of the biomass in this zone is calculated in (Eq. 4).
where Qh is the heat energy, mp is the mass of the biomass; Cp is the biomass heat capacity, and ΔT is the change in the biomass temperature during heat up in this zone.
In this zone, the biomass temperature is held constant at the drying temperature while the biomass is dried from its initial moisture content to the user-defined dried moisture content. Thus, the moisture loss equation (Eq. 5) is used.
where M, Me, and M0 are moisture content at time t, at equilibrium, and initially, and k is the drying constant for the material. Constant n is an exponent that improves the performance of the drying. For wood chips, (Eq. 6) is used.
where T is in Kelvin and k is the drying constant in 1/min (Tumuluru 2010).
In Zone C, the dried material’s temperature rises to the user-defined torrefaction temperature. The heating process is similar to the heating process in Zone A (Eq. 7).
where T is the temperature at time t, Tf is the temperature at which the torrefaction reaction takes place, To is the initial temperature, h is the average heat transfer coefficient (W/m2K), S is the total surface area of biomass particles in the zone, ρ is the bulk density of the biomass, Cp is the biomass specific heat, and V is the bulk volume of the biomass in the zone.
The required heat energy to raise the temperature of the biomass in this zone is calculated using (Eq. 4).
In this zone, the biomass temperature is held constant at the user-defined torrefaction temperature, while the biomass loses mass through the breakdown of chemical constituents and the loss of volatiles. Similar to the moisture loss in Zone B, the loss of volatiles follows (Eq. 8).
where M, Me, and Mo are moisture content at time t at equilibrium and initially, and k is the mass loss constant for the material. For wood chips, (Eq. 9) is used.
where the values of A, E, and R are listed in Table 3; T is in Kelvin, the units of k are 1/min, A is the pre-exponential factor, E is the activation energy, and R is the ideal gas constant.
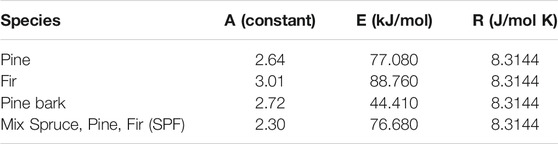
TABLE 3. Constants for the reaction kinetics of Equation 16 (Tumuluru, 2010).
The heat requirement is calculated by estimating the energy required to heat the incoming biomass from ambient temperature to the torrefaction temperature, the latent heat of water vaporization, and the latent heat of devolatilization. The user can also define the percent heat losses for the process. For example, a reasonable heat loss value for a well-insulated process might be about 20%.
The energy to heat the biomass is calculated for Zones A and C using the biomass flowrate, biomass heat capacity, and changes in Zones A and C temperatures.
The latent heat of water vaporization and latent heat of organics volatilization is estimated by (Eq. 10).
where Q is the heat of either water vaporization or organics volatilization, mo is the mass of either the evaporated moisture or volatilized volatiles, and dH is either the heat of water vaporization or organics volatilization.
No exothermic oxidation reactions are assumed in this torrefaction model since any exothermic oxidation reactions are undesired. In reality, several uncertainties exist that will affect the energy balance, including the actual properties of the biomass; relative proportions of convective, conductive, and radiative properties; heat transfer; heat losses; actual temperatures of water vaporization and organics devolatilization; and any exothermic oxidation reactions due to the presence of oxygen in the system. These energy balance calculations should be considered approximations.
The energy needed for biomass heating, drying, and torrefaction must come from either the preheated input/recycled gas stream or the heated torrefier walls. Heat transfer from the gas stream and the torrefier walls depends on the convection, conduction, and radiation heat transfer coefficients; wall and biomass surface areas; wall; gas; biomass temperatures; gas flowrate; gas-solids mixing; and biomass contact with the torrefier walls. The heat transfer from the gas stream and the walls needs to be balanced so that the required amount of heat transfer from each source does not exceed practical limits considering wall and gas temperature limits (e.g., 300°C or as user-defined) and gas flowrates (e.g., limited by superficial space velocities [SSVs]). SSVs in packed and fluidized beds are typically limited to about 0.3 m/s (1 f/s), but the user can define this value.
The torrefier design model enables the user to determine the split between heat transfer from the preheated gas and the walls based on user-defined or calculated temperatures, heat transfer coefficients, biomass properties, gas velocity, gas flow rate, and torrefier geometry conditions.
Inert gas (N2) supply is needed during startup, for purges during operation, and throughout post-operation purging. Even under conditions of torrefaction gas recycle, these N2 gas flows require eventual treatment and atmospheric discharge. Water and volatiles from the biomass contribute to the total torrefier gas flow. The torrefier outlet gas, laden with moisture, volatilized organics, permanent gas evolution (primarily CO and CO2), and particulate matter must be treated before it can be released to the atmosphere to remove the particulate matter, CO, and condensable/non-condensable organics.
In order for the torrefaction process to be more thermally and economically efficient, it is expected that as much of the torrefier gas as needed is recycled to heat the torrefier. However, not all the torrefier outlet gas can or needs to be recycled because of the addition of inert gas purges, generation of evaporated water, and volatilized organics in the gas stream. This is why the example torrefaction systems described above all indicate treatment of the torrefier outlet gas and recycle a portion of the torrefier gas. At the same time, the remainder is discharged to the atmosphere. Features of the torrefier gas treatment and recycle systems in the examples above include:
1) Filtration of particulate matter either upstream or downstream of thermal oxidation. Filtration and oxidation are needed to prevent fouling from particulate matter and condensable organics and to remove or destroy potential air pollutants before the cleaned gas is discharged into the atmosphere. Filtration before oxidation can enable the capture and use of torrefied fines but is more prone to fouling. Filtration after oxidation is less prone to fouling and results in less captured fines because the organic moiety of the particulate matter is destroyed during oxidation. Catalytic oxidation is an option for eliminating the volatilized organics. However, when used upstream of filtration, it can be prone to catalyst fouling, so thermal oxidation is used in the example.
2) Heat recovery by using the hot thermal oxidizer outlet gas to preheat the torrefier outlet gas and to preheat air used for stoichiometry control in the thermal oxidizer.
3) A blower downstream of oxidation and filtration pressurizes the cleaned torrefier gas stream so that it can be recycled to the torrefier recycle gas inlet or discharged to the atmosphere.
4) Flowrate monitoring and control are needed so that only the amount of gas required is recycled to the torrefier; the excess cleaned gas is discharged through a stack to the atmosphere.
5) Reheating, as needed, of the recycled gas to the desired torrefaction temperature.
The oxidized, cleaned torrefier gas that is recycled/discharged is a mixture of primarily N2, H2O, CO2, and O2, with trace, ppm-level, regulatorily compliant levels of CO and total hydrocarbons (THC) for atmospheric release. Since there is no acid gas scrubbing in these designs, there could be acid gases (e.g., SOx and halogen gases) to the extent that S and halogens are in the biomass feedstock; levels of these acid gas precursor elements should be controlled to acceptable levels in the feedstock. NO and NO2 are also expected at ppm levels, generated during thermal oxidation, but at low enough concentrations to meet expected regulatory emission limits.
Over time during steady-state operation, the H2O and CO2 concentrations in the recycle and discharge gas rise and approach a steady-state concentration when the H2O and CO2 concentrations in the recycle and discharge gas reaches a high enough concentration so that the amount of H2O and CO2 discharged to the atmosphere equals the amount of H2O and CO2 entering the system from the biomass and oxidizer combustion air. Thus, H2O and CO2 in the torrefier gas during biomass heat up and torrefaction is beneficial due to their higher heat capacities than N2, as long as cold spots are avoided that could cause moisture condensation.
The example torrefaction system diagrams illustrate the need for process temperature, pressure, pressure drop, flow rate, and gas stoichiometry monitoring and control. Temperatures are monitored using thermocouples and controlled using electrical heaters, heat exchangers, and gas flowrate control. Pressures are monitored using N2-purged pressure ports and controlled using input and recycle gas flow rate and pressure control. The entire torrefaction system is expected to be under neutral or slightly negative pressure to reduce fugitive emissions, but not so negative as to cause significant, undesired air in leakage. The pressure at the gas inlet to the torrefier would, of course, be higher than the pressure at the inlet to the recycle blower due to the pressure drop through the entire system.
Biomass, product, and filtered fines flow rate monitoring and control are done using calibrated auger feed systems and weigh scale measurements. Input gas flowrate monitoring and control are done using mass flow controllers, and the recycle gas flowrate control is done using a flow control damper in these examples. Other gas flow rate monitoring and control options are also available. The thermal oxidizer stoichiometry is controlled using O2 monitoring that is part of the oxidizer controls.
Process stream sampling and analysis are needed to maintain needed control over the process and the torrefied product and ensure regulatory compliance of air emissions. Process sampling can include: 1) periodic sampling and analysis of the input biomass, torrefied product, and filtered fines; 2) periodic sampling and analysis of particulate matter in the recycle gas stream; and 3) periodic or continuous sampling and analysis of the recycling gas. Samples that are periodically collected are subsequently analyzed for mass and composition.
Table 4 summarizes user-defined inputs and calculated outputs for the example torrefaction system illustrated in Figure 9B for a horizontal moving bed torrefier with co-flowing gas and biomass and process gas oxidation upstream of filtration. This model is equally applicable to other vertical, horizontal, counter-flow, or co-flow configurations. The calculated outputs, of course, depend on the user inputs. Key results of this example model calculation include:
1) Using the assumed input thermodynamic data, biomass properties, and torrefaction temperatures, the overall inside dimensions of the torrefaction unit are 0.31 m diameter and 2.1 m long for a torrefied product output rate of 45.4 kg/h (100 lb/hr). The total residence time is 33 min. The heights (e.g., lengths when the torrefier is horizontal) of Zone A (Heating Region for Drying) and Zone C (Heating Region for Torrrefaction) are both short, under 0.1 m. This seems unrealistically short for a real process in which there are no clear temperature or thermodynamic boundaries. These values also do not include any engineering design safety factors, which, if used, may increase the dimensions by 10–50%; recognizing that with such increases, other parameters such as gas flow rates, gas compositions, and heat losses may also change.
2) The torrefier energy input rate required to heat the biomass, evaporate water, volatilize some organics, and assumed heat losses of 20% totals 24 kW. This heat input is from heating the input and recycled gas to 400°C (at the preheater outlet) and a torrefier wall temperature of 300°C. The input gas preheater temperature is allowed to be 400°C because of some expected heat loss, and due to the gas-biomass co-flow condition, the temperature of the preheated gas more rapidly transfers heat to the cool incoming biomass; so the gas temperature rapidly decreases to well below the assumed torrefier maximum temperature of 300°C.
3) With an assumed gas SSV of 0.30 m/s in Zone D (Torrefaction Region) and the assumed inside diameter of 0.31 m, the nominal torrefier outlet gas flowrate is 39 scfm (0.018 m3/s) at 20°C and 1 atm. Thus, the initial torrefier outlet gas composition is 13 volume% (vol%) volatilized organics, 18 vol% evaporated water, and 69 vol% N2.
4) The volatile organics in the torrefier outlet gas are oxidized to CO2 and H2O in the oxidizer so that the initial composition of the oxidizer outlet gas is as shown in Table 4, with trace ppb-ppm levels of incompletely oxidized CO and total hydrocarbons (THC). If the level of about 1.3 vol% O2 in the recycled gas to the torrefier is unacceptably high, possible options include: 1) adjusting the oxidizer to operate with lower excess O2; or 2) bypassing the oxidizer for the torrefier recycle gas. However, bypassing the oxidizer would result in recycling un-oxidized organics back to the torrefier as described in Figure 10A, which would increase the need to ensure that the volatilized organics do not condense and foul the torrefier and recycle system.
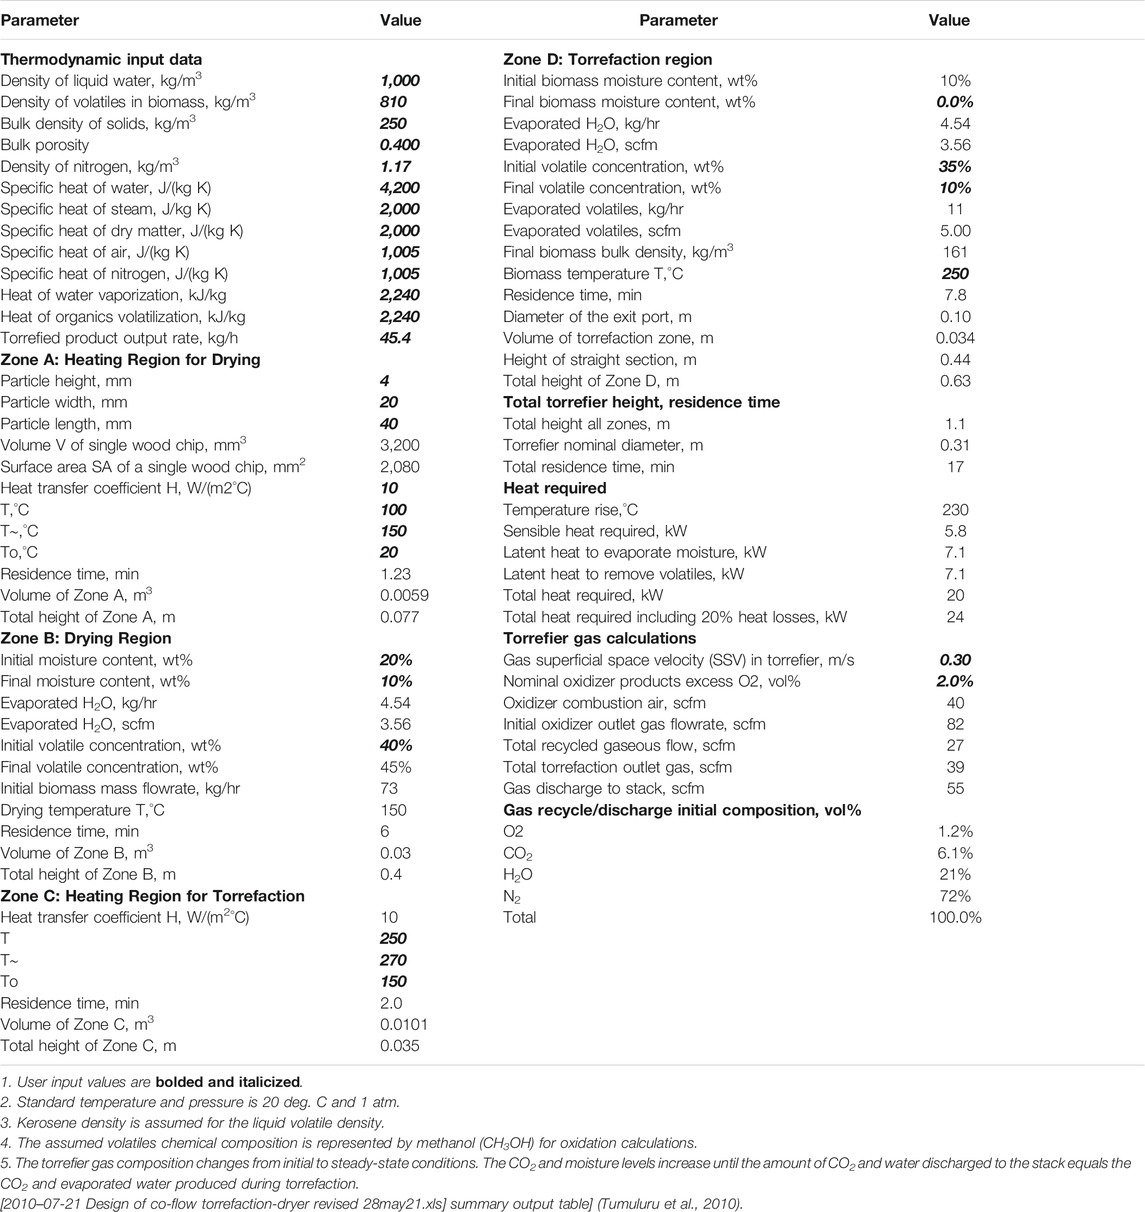
TABLE 4. Summary torrefaction model input and output values.
This model portrays initial torrefaction conditions upon startup. Since the torrefier recycle gas contains CO2 and H2O from the torrefaction and oxidation processes, the CO2 and H2O concentrations increase (and the concentration of N2 and the need for makeup N2 decrease) as the process transitions from startup to steady-state conditions until the flowrate of CO2 and H2O discharged to the stack equals the CO2 and H2O produced during torrefaction and oxidation. Even in the bounding condition that no makeup N2 is needed, N2 will still be added to the system as N2 purges and N2 in the combustion air used in the oxidizer. N2 purge flowrates are not included in these model calculations. N2 purges are expected to be relatively small, on the order of 2.8 standard liters per minute (slpm) (0.1 scfm), except for purges on the biomass input and product output airlock systems, which may be up to about 100 slpm (3.5 scfm) each.
The model can be used in the initial conceptual design for torrefier systems with different uses such as torrefier research or torrefied product production and for estimating capacities and process conditions such as temperature and residence time. The model can also be used for “what-if” studies to determine preferences in torrefier system design such as the process rate, methods of heat input, oxidation of the torrefier outlet gas, torrefier outlet gas recycle, energy requirements and efficiency, and air emissions compliance. INL recently upgraded its model to this version so that the model can be used to design a torrefaction test system with an output torrefied product rate of 100 lb/h.
Torrefaction removes moisture, improves grindability, improves carbon/hydrogen/oxygen ratios, and makes biomass more physically uniform and hydrophobic. Torrefaction can be a pretreatment step prior to storage, transport, grinding, or downstream energy production processes. Since torrefaction makes biomass behave like coal in terms of its properties, it could be used to prepare biomass for downstream processes like cofiring with coal. Replacing coal usage with biomass usage reduces the consumption of fossil fuels and provides a value-added use of otherwise waste biomass. Other applications of torrefied biomass include using it as a heat source for cement kilns, dedicated combustion in small-scale pellet burners, and gasification in entrained flow gasifiers that normally operate on pulverized coal. The major advantage of cofiring torrefied biomass with coal is that existing power plants can be used with minimal modifications. Most power plants have not been designed to cofire raw biomass, and major modifications to existing power plants are capital-intensive. Since torrefied ground biomass has a uniform particle size and shape and a very low moisture content as compared to raw biomass, torrefaction can upgrade biomass feedstock for biofuels production. The thermochemical conversion of biomass using gasification and pyrolysis is a promising technology that is environmentally friendly. Many studies have indicated that torrefied biomass performs better than non-torrefied biomass for gasification and pyrolysis applications (Sarker et al., 2014; Yang et al., 2014).
According to Eseyin et al. (2015), global efforts are underway to develop torrefaction technologies, but many challenges must be overcome before the torrefaction technology is commercialized. Companies have made some progress in building pilot- and commercial-scale torrefaction systems and have produced a product with desired physical properties, chemical composition, and energy content. Further research is needed to optimize the torrefaction process to meet the end-use requirements. Currently, torrefaction demonstration plants have technical challenges to scale-up to commercial operations. Data still lacks regarding the optimization of torrefaction reactors to produce a product with the desired quality for different end-use requirements is still scarce. Several characteristics of torrefaction processes must be demonstrated or scaled-up for successful commercialization. Specific areas of torrefaction, especially the reactor design and its impact on producing a uniform torrefied product, need to be demonstrated or scaled-up for commercialization purposes (Wild, 2011; Agar and Wihersaari, 2012; Jones et al., 2012; Lu et al., 2012; Van Essendelft et al., 2013). It is also important to design torrefaction reactors that can handle various heterogenous biomass with variable particle size and moisture as it results in non-uniform heat and mass transfer and produces a non-uniform torrefied product, which can impact the torrefaction process efficiency. There is still a lack of data regarding torrefaction product production cost at the pilot- and commercial- scales.
The torrefaction design model developed in this research based on thermodynamic equations can help academicians and the biomass industry to design a torrefaction system with different configurations with better product quality control. The various modules in the model help design the different zones of the torrefaction systems, the heat-required, torrefier gas calculations, and gas recycle/discharge compositions based on the physical properties and thermal properties of the biomass being used. Also, the model uses the thermodynamic data of the gases that are used in the torrefaction process. These models also calculate the heat required for each of the torrefaction reactor heating zones.
This study indicates that the torrefaction process could upgrade raw biomass materials to higher-quality fuel with better physical properties, chemical composition, heating values, and rheological properties. As a result, torrefied biomass can be used for heat generation, power production, and liquid-fuel production. The following conclusions are drawn based on the present research:
1) Torrefaction is a slow heating process in an inert atmosphere in the temperature range of 200–300°C. Torrefaction produces a solid, more uniform product with lower moisture and higher energy content than the initial biomass.
2) Devolatilization and carbonization of hemicelluloses and depolymerization and devolatilization of lignin and cellulose are common biomass torrefaction reactions. In addition, lignin softens at the glass transition temperature during torrefaction, which can help to improve the pelleting characteristics of torrefied biomass.
3) The torrefaction process produces: 1) torrefied solids, including original sugar structures and other newly formed polymeric structures; 2) condensable gases, including H2O and volatilized organic compounds; and 3) permanent gases like CO and CO2.
4) Torrefaction eliminates the low energy content volatiles and creates a consistent solid feedstock with better physical, chemical, and biochemical composition.
5) Torrefaction improves biomass grindability by making it more brittle. The grinding throughput rate can increase by more than two times, and grinding energy consumption can decrease by more than half as compared to raw biomass. The size-reduced torrefied material has a more uniform particle size distribution with improved size and shape characteristics.
6) The OH functional group loss during torrefaction makes torrefied biomass hydrophobic and improves the storage stability.
7) Different torrefaction reactor designs have been conceptualized and used at various experimental and demonstration scales. These designs have different features in terms of operation, heating methods, feeding, material handling and movement, product handling, off-gas collection, operational efficiencies, and scale-up.
8) The Excel torrefier design model can be used to design and evaluate torrefier systems. This model can be used to calculate reactor dimensions, gas and solids residence times, energy requirements, and gas production and recycle rates, based on estimated input values such as the output torrefied product rate, the biomass properties (e.g., moisture volatiles content, particle size, specific heat, etc.), the expected heat transfer rates, desired operating temperatures, and other operating conditions of a torrefaction system.
The original contributions presented in the study are included in the article/Supplementary Material, further inquiries can be directed to the corresponding author.
JST developed the manuscript. JST, SS, and NS developed the Excel spreadsheet for designing the moving bed reactor. JST, NS, and SS worked on developing the concepts on the moving bed reactor. BG provided additional data based on his Ph.D. work regarding how the torrefaction process impacts the fuel properties, as well as the advantages of torrefied fuel and torrefaction reactor designs and qualitative assessments. JST, BG, NS, and SS reviewed the revised manuscript and submitted it to the journal.
This work was supported by the U.S. Department of Energy, Office of Energy Efficiency and Renewable Energy under U.S. DOE Idaho Operations Office Contract DE-AC07-05ID14517. Accordingly, the publisher, by accepting the article for publication, acknowledges that the U.S. government retains a nonexclusive, paid-up, irrevocable, worldwide license to publish or reproduce the published form of this manuscript or allow others to do so for U.S. government purposes.
The views and opinions of the authors expressed herein do not necessarily state or reflect those of the United States government or any agency thereof.
The authors declare that the research was conducted in the absence of any commercial or financial relationships that could be construed as a potential conflict of interest.
All claims expressed in this article are solely those of the authors and do not necessarily represent those of their affiliated organizations, or those of the publisher, the editors and the reviewers. Any product that may be evaluated in this article, or claim that may be made by its manufacturer, is not guaranteed or endorsed by the publisher.
Agar, D., and Wihersaari, M. (2012). Bio-coal, Torrefied Lignocellulosic Resources - Key Properties for its Use in Co-firing with Fossil Coal - Their Status. Biomass and Bioenergy 44, 107–111. doi:10.1016/j.biombioe.2012.05.004
Baicar, M., Zagula, G., Saletnik, B., Tarapatskyy, M., and Puchalski, C. (2018). Relationship between Torrefaction Parameters and Physicochemical Properties of Torrefied Products Obtained from Selected Plant Biomass. Energies 11, 2919. doi:10.3390/en11112919
Basu, P. (2018). Torrefaction: Biomass Gasification, Pyrolysis, and Torrefaction – Practical Design and Theory. 3rd Ed. San Diego, CA, USA: Academic Press, 93–154. doi:10.1016/C2011-0-07564-6
Batidzirai, B., Mignot, A. P. R., Schakel, W. B., Junginger, H. M., and Faaij, A. P. C. (2013). Biomass Torrefaction Technology: Techno-Economic Status and Future Prospects. Energy 62, 196–214. doi:10.1016/j.energy.2013.09.035
Beckman, J., Hertel, T., Taheripour, F., and Tyner, W. (2012). Structural Change in the Biofuels Era. Eur. Rev. Agric. Econ. 39 (1), 137–156. doi:10.1093/erae/jbr041
Bergman, P. C. A., Boersma, A. R., Zwart, R. W. H., and Kiel, J. H. A. (2010). BIOCOAL. ECN Report #ENC-C--05-013.Torrefaction for Biomass Co-firing in Existing Coal-Fired Power Stations,
Bergman, P. C. A., and Kiel, J. H. A. (2005). Torrefaction for Biomass Upgrading. Proceedings of the 14th European Biomass Conference & Exhibition. Paris, France. 17–21. Availableat: at: http://www.energy.ca.gov/2009_energypolicy/documents/2009-04-21_workshop/comments/Torrefaction_for_Biomass_Upgrading_TN-51257.pdf.
Chen, W.-H., Lin, B.-J., Lin, Y.-Y., Chu, Y.-S., Ubando, A. T., Show, P. L., et al. (2021). Progress in Biomass Torrefaction: Principles, Applications and Challenges. Prog. Energ. Combustion Sci. 82, 100887. doi:10.1016/j.pecs.2020.100887
Chen, W.-H., Lu, K.-M., Liu, S.-H., Tsai, C.-M., Lee, W.-J., and Lin, T.-C. (2013). Biomass Torrefaction Characteristics in Inert and Oxidative Atmospheres at Various Superficial Velocities. Bioresour. Tech. 146, 152–160. doi:10.1016/j.biortech.2013.07.064
Chen, W.-H., Peng, J., and Bi, X. T. (2015). A State-Of-The-Art Review of Biomass Torrefaction, Densification and Applications. Renew. Sust. Energ. Rev. 44, 847–866. doi:10.1016/j.rser.2014.12.039
Dhungana, A., Basu, P., and Dutta, A. (2012). Effects of Reactor Design on the Torrefaction of Biomass. J. Energ. Resour. Technol. 134 (4), 1–11. doi:10.1115/1.4007484
Eseyin, A. E., Steel-e, P. H., and Pittman, C. U. (2015). Current Trends in the Production and Appliation of Trrefiedwood/biomass — A Review. BioResources, 10 (4), 8812–8858.
Fisher, E. M., Dupont, C., Darvell, L. I., Commandré, J.-M., Saddawi, A., Jones, J. M., et al. (2012). Combustion and Gasification Characteristics of Chars from Raw and Torrefied Biomass. Bioresour. Tech. 119, 157–165. doi:10.1016/j.biortech.2012.05.109
Ghiasi, B. (2019). Steam Assisted Pelletization and Torrefaction of Lignocellulosic Biomass. PhD. Vancouver, British Columbia, Canada: Thesis submitted to the University of British Columbia.
Gronnow, M. J., Budarin, V. L., Mašek, O., Crombie, K. N., Brownsort, P. A., Shuttleworth, P. S., et al. (2013). Torrefaction/biochar Production by Microwave and Conventional Slow Pyrolysis - Comparison of Energy Properties. GCB Bioenergy 5 (2), 144–152. doi:10.1111/gcbb.12021
Hill, S. J., Grigsby, W. J., and Hall, P. W. (2013). Chemical and Cellulose Crystallite Changes in Pinus Radiata during Torrefaction. Biomass and Bioenergy 56, 92–98. doi:10.1016/j.biombioe.2013.04.025
Hilten, R. N., Speir, R. A., Kastner, J. R., Mani, S., and Das, K. C. (2013a). Effect of Torrefaction on Bio-Oil Upgrading over HZSM-5. Part 1: Product Yield, Product Quality, and Catalyst Effectiveness for Benzene, Toluene, Ethylbenzene, and Xylene Production. Energy Fuels 27 (2), 830–843. doi:10.1021/ef301694x
Hilten, R. N., Speir, R. A., Kastner, J. R., Mani, S., and Das, K. C. (2013b). Effect of Torrefaction on Bio-Oil Upgrading over HZSM-5. Part 2: Byproduct Formation and Catalyst Properties and Function. Energy Fuels 27 (2), 844–856. doi:10.1021/ef301695c
Ho, S.-H., Zhang, C., Chen, W.-H., Shen, Y., and Chang, J.-S. (2018). Characterization of Biomass Waste Torrefaction under Conventional and Microwave Heating. Bioresour. Tech. 264, 7–16. doi:10.1016/j.biortech.2018.05.047
Huang, Y. F., Chen, W. R., Chiueh, P. T., Kuan, W. H., and Lo, S. L. (2012). Microwave Torrefaction of Rice Straw and Pennisetum. Bioresour. Tech. 123, 1–7. doi:10.1016/j.biortech.2012.08.006
Jones, J. M., Bridgeman, T. G., Darvell, L. I., Gudka, B., Saddawi, A., and Williams, A. (2012). Combustion Properties of Torrefied Willow Compared with Bituminous Coals. Fuel Process. Tech. 101, 1–9. doi:10.1016/j.fuproc.2012.03.010
Kim, Y.-H., Lee, S.-M., Lee, H.-W., and Lee, J.-W. (2012). Physical and Chemical Characteristics of Products from the Torrefaction of Yellow poplar (Liriodendron Tulipifera). Bioresour. Tech. 116, 120–125. doi:10.1016/j.biortech.2012.04.033
Lee, J.-W., Kim, Y.-H., Lee, S.-M., and Lee, H.-W. (2012). Optimizing the Torrefaction of Mixed Softwood by Response Surface Methodology for Biomass Upgrading to High Energy Density. Bioresour. Tech. 116, 471–476. doi:10.1016/j.biortech.2012.03.122
Lu, K.-M., Lee, W.-J., Chen, W.-H., Liu, S.-H., and Lin, T.-C. (2012). Torrefaction and Low Temperature Carbonization of Oil Palm Fiber and Eucalyptus in Nitrogen and Air Atmospheres. Bioresour. Tech. 123, 98–105. doi:10.1016/j.biortech.2012.07.096
Mamvura, T. A., and Danha, G. (2020). Biomass Torrefaction as an Emerging Technology to Aid in Energy Production. Heliyon 6, e03531, doi:10.1016/j.heliyon.2020.e03531
Mamvura, T. A., Pahla, G., and Muzenda, E. (2018). Torrefaction of Waste Biomass for Application in Energy Production in South Africa. South Afr. J. Chem. Eng. 25, 1–12. doi:10.1016/j.sajce.2017.11.003
Manouchehrinejad, M., and Mani, S. (2019). Process Simulation of an Integrated Biomass Torrefaction and Pelletization (iBTP) Plant to Produce Solid Biofuels. Energy Convers. Manag. X 1, 100008. doi:10.1016/j.ecmx.2019.100008
Nachenius, R. W., Ronsse, F., Venderbosch, R. H., and Prins, W. (2013). “Biomass Pyrolysis,” in Chemical Engineering for Renewables Conversion. Editor D. Y. Murzin (Waltham, MA, USA: Academic Press), .
Oliveira-Rodrigues, T., and Rousset, P. L. A. (2009). Effects of Torrefaction on Energy Properties of Eucalyptus Grandis Wood. Cerne 15 (4), 446–452, .
Oyebode, W. A., and Ogunsuyi, H. O. (2021). Impact of Torrefaction Process Temperature on the Energy Content and Chemical Composition of Stool Tree (Alstonia congenisis Engl) Woody Biomass. Curr. Res. Green Sust. Chem. 4, 100115. doi:10.1089/ind.2011.7.38410.1016/j.crgsc.2021.100115
Phanphanich, M., and Mani, S. (2011). Impact of Torrefaction on the Grindability and Fuel Characteristics of Forest Biomass. Bioresour. Tech. 102 (2), 1246–1253. doi:10.1016/j.biortech.2010.08.028
Phusunti, N., Phetwarotai, W., and Tekasakul, S. (2018). Effects of Torrefaction on Physical Properties, Chemical Composition and Reactivity of Microalgae. Korean J. Chem. Eng. 35 (2), 503–510. doi:10.1007/s11814-017-0297-5
Ramos-Carmona, S., Pérez, J. F., Pelaez-Samaniego, M. R., Barrera, R., and Garcia-Perez, M. (2017). Effect of Torrefaction Temperature on Properties of Patula pine. Maderas, Cienc. Tecnol. 19 (1), 39–50. doi:10.4067/S0718-221X2017005000004
Ren, S., Lei, H., Wang, L., Bu, Q., Chen, S., Wu, J., et al. (2013). The Effects of Torrefaction on Compositions of Bio-Oil and Syngas from Biomass Pyrolysis by Microwave Heating. Bioresour. Tech. 135, 659–664. doi:10.1016/j.biortech.2012.06.091
Repellin, V., Govin, A., Rolland, M., and Guyonnet, R. (2010). Energy Requirement for fine Grinding of Torrefied wood. Biomass and Bioenergy 34 (7), 923–930. doi:10.1016/j.biombioe.2010.01.039
Ribeiro, J., Godina, R., Matias, J., and Nunes, L. (2018). Future Perspectives of Biomass Torrefaction: Review of the Current State-Of-The-Art and Research Development. Sustainability 10 (7), 2323. doi:10.3390/su10072323
Rousset, P., Aguiar, C., Labbé, N., and Commandré, J.-M. (2011). Enhancing the Combustible Properties of Bamboo by Torrefaction. Bioresour. Tech. 102, 8225–8231. doi:10.1016/j.biortech.2011.05.093
Sarkar, M., Kumar, A., Tumuluru, J. S., Patil, K. N., and Bellmer, D. D. (2014). Gasification Performance of Switchgrass Pretreated with Torrefaction and Densification. Appl. Energ. 127, 194–201. doi:10.1016/j.apenergy.2014.04.027
Stępień, P., Pulka, J., and Białowiec, A. (2017). “Organic Waste Torrefaction – A Review: Reactor Systems and the Biochar Properties,” in Pyrolysis. Editor M. Samer (London, UK: IntechOpen).
Tumuluru, J., Boardman, R., Wright, C., and Hess, J. (2012a). Some Chemical Compositional Changes in Miscanthus and White Oak Sawdust Samples during Torrefaction. Energies 5, 3928–3947. doi:10.3390/en5103928
Tumuluru, J. (2016). Effect of Deep Drying and Torrefaction Temperature on Proximate, Ultimate Composition, and Heating Value of 2-mm Lodgepole Pine (Pinus contorta) Grind. Bioengineering 3 (2), 16. doi:10.3390/bioengineering3020016
Tumuluru, J., and Heikkila, D. (2019). Biomass Grinding Process Optimization Using Response Surface Methodology and a Hybrid Genetic Algorithm. Bioengineering 6 (1), 12. doi:10.3390/bioengineering6010012
Tumuluru, J. S. (2020). “Bioenergy Feedstock Types and Properties,” in Biomass Densification. Editor J. S. Tumuluru New York, NY, USA: Springer, 1–21. doi:10.1007/978-3-030-62888-8_1
Tumuluru, J. S. (2015). Comparison of Chemical Composition and Energy Property of Torrefied Switchgrass and Corn Stover. Front. Energ. Res. 3, 46. doi:10.3389/fenrg.2015.00046
Tumuluru, J. S., Kremer, T., Wright, C. T., and Boardman, R. D. (2012b). Proximate and Ultimate Compositional Changes in Corn stover during Torrefaction Using Thermogravimetric Analyzer and Microwaves. ASABE Annual International Meeting. 29 July-1 August 2012, Dallas, TX, USA, Paper Number 121337398.
Tumuluru, J. S., Sokhansanj, S., Hess, J. R., Wright, C. T., and Boardman, R. D. (2010). Biomass Torrefaction Process Review and Moving Bed Torrefaction System Model Development, INL/EXT-10-19569. Idaho Falls, ID, USA: Idaho National Laboratory.
Tumuluru, J. S., Sokhansanj, S., Hess, J. R., Wright, C. T., and Boardman, R. D. (2011). Review: A Review on Biomass Torrefaction Process and Product Properties for Energy Applications. Indust. Biotech. 7 (5), 384–401. doi:10.1089/ind.2011.7.384
Tumuluru, J. S., Tabil, L. G., Song, Y., Iroba, K. L., and Meda, V. (2014). Grinding Energy and Physical Properties of Chopped and Hammer-Milled Barley, Wheat, Oat, and Canola Straws. Biomass Bioenerg. 119, 44–57. doi:10.1016/j.biosystemseng.2013.11.012
Tumuluru, J. S. (2017). “Thermal Pretreatment of Biomass to Make it Suitable for Biopower Application,” in Biomass Preprocessing and Pretreatments for Production of Biofuels: Mechanical, Chemical, and Thermal Methods. Editor J. S. Tumuluru (Boca Raton, FL, USA: CRC Press), 255–291.
Tumuluru, J. S., and Yancey, N. A. (2017). “Conventional and Advanced Mechanical Preprocessing Methods for Biomass: Performance Quality Attributes and Cost Analysis,” in Biomass Preprocessing and Pretreatments for Production of Biofuels. Editor J. S. Tumuluru (Boca Raton, FL, USA: CRC Press), 15–49.
Tumuluru, J. S., Yancey, N. A., and Kane, J. J. (2021). Pilot-scale Grinding and Briquetting Studies on Variable Moisture Content Municipal Solid Waste Bales - Impact on Physical Properties, Chemical Composition, and Calorific Value. Waste Manag. 125 (15), 316–327. doi:10.1016/j.wasman.2021.02.013
U.S. Department of Energy (DOE) (2016). “Billion-ton Report Advancing Domestic Resources for a Thriving Bioeconomy (Oak Ridge, TN, USA: Oak Ridge National Laboratory) Vol. 1.Economic Availability of Feedstocks ORNL/TM‐2016/160.
U.S. Energy Information Administration (EIA) (2018). Biomass Explained. Washington, DC, USA: EIA. Available at: https://www.eia.gov/energyexplained/biomass/.
Van Essendelft, D. T., Zhou, X., and Kang, B. S.-J. (2013). Grindability Determination of Torrefied Biomass Materials Using the Hybrid Work index. Fuel 105, 103–111. doi:10.1016/j.fuel.2012.06.008
Wang, L., Barta-Rajnai, E., Skreiberg, Ø., Khalil, R., Czégény, Z., Jakab, E., et al. (2017). Impact of Torrefaction on Woody Biomass Properties. Energ. Proced. 105, 1149–1154. doi:10.1016/j.egypro.2017.03.486
Wild, M. The Ratio behind Torrefaction: Trade-Off between Additional Investment & Energy Use vs. Logistical & End-Use Advantages. Proceedings of the IEA Bioenergy Task 32 and Task 40 Workshop. January 2011.
Yang, Z., Sarkar, M., Kumar, A., Tumuluru, J. S., and Huhnke, R. L. (2014). Effects of Torrefaction and Densification on Switchgrass Pyrolysis Products. Bioresour. Tech. 174, 266–273. doi:10.1016/j.biortech.2014.10.032
Zhang, C., Ho, S.-H., Chen, W.-H., Fu, Y., Chang, J.-S., and Bi, X. (2019). Oxidative Torrefaction of Biomass Nutshells: Evaluations of Energy Efficiency as Well as Biochar Transportation and Storage. Appl. Energ. 235, 428–441. doi:10.1016/j.apenergy.2018.10.090
Zheng, A., Jiang, L., Zhao, Z., Huang, Z., Zhao, K., Wei, G., et al. (2015). Impact of Torrefaction on the Chemical Structure and Catalytic Fast Pyrolysis Behavior of Hemicellulose, Lignin, and Cellulose. Energy Fuels 29 (12), 8027–8034. doi:10.1021/acs.energyfuels.5b01765
Keywords: biomass, torrefaction, torrefied material properties, torrefaction reactors, reactor design concepts, moving bed reactor
Citation: Tumuluru JS, Ghiasi B, Soelberg NR and Sokhansanj S (2021) Biomass Torrefaction Process, Product Properties, Reactor Types, and Moving Bed Reactor Design Concepts. Front. Energy Res. 9:728140. doi: 10.3389/fenrg.2021.728140
Received: 21 June 2021; Accepted: 04 August 2021;
Published: 17 September 2021.
Edited by:
Hu Li, Guizhou University, ChinaReviewed by:
Xiaofang Liu, Guiyang University, ChinaCopyright © 2021 Tumuluru, Ghiasi, Soelberg and Sokhansanj. This is an open-access article distributed under the terms of the Creative Commons Attribution License (CC BY). The use, distribution or reproduction in other forums is permitted, provided the original author(s) and the copyright owner(s) are credited and that the original publication in this journal is cited, in accordance with accepted academic practice. No use, distribution or reproduction is permitted which does not comply with these terms.
*Correspondence: Jaya Shankar Tumuluru, SmF5YVNoYW5rYXIuVHVtdWx1cnVAaW5sLmdvdg==
Disclaimer: All claims expressed in this article are solely those of the authors and do not necessarily represent those of their affiliated organizations, or those of the publisher, the editors and the reviewers. Any product that may be evaluated in this article or claim that may be made by its manufacturer is not guaranteed or endorsed by the publisher.
Research integrity at Frontiers
Learn more about the work of our research integrity team to safeguard the quality of each article we publish.