 Gang Lu1
 Na Duan
94% of researchers rate our articles as excellent or good
Learn more about the work of our research integrity team to safeguard the quality of each article we publish.
Find out more
ORIGINAL RESEARCH article
Front. Energy Res. , 14 October 2021
Sec. Sustainable Energy Systems
Volume 9 - 2021 | https://doi.org/10.3389/fenrg.2021.724308
This article is part of the Research Topic Economics and Policies in Formulating Renewable Power Development Plans View all 11 articles
As the largest processing sector of primary energy, the transformation and upgrading of the power sector is undoubtedly an effective way to alleviate the situation of energy and environment. This article studies the gradual goals of the transformation and upgrading of China’s power industry, where the conditions of technical judgment, specific profile, and moderate agenda are incorporated. The empirical analysis of China’s provincial power sectors based on the constructed models came to the following results. First, it is of great importance to consider the profile of each region’s power sector in setting energy-saving and emission reduction targets. The analysis of variance demonstrates significant differences in the reference points of inputs and outputs under the 1% confidence level. Second, regardless of the specific quantity, the strongly consistent trends of the short- and long-term targets demonstrated the feasibility and effectiveness of the gradual goals. Finally, realizing the potential of energy-saving and emission reduction needs a gradual pathway instead of accomplishing in one stroke. The targets of this study, which are attainable for the power sector and still represent a best practice, could serve as transitional benchmarks in power supply and emission reduction. To further achieve carbon neutrality, the management strategy to coordinate power supply and renewable energy accommodation needs to be transformed.
Energy issues and climate change are increasing concerns over the world. As an important energy processing and conversion sector, power industry plays a dominant role in supporting the national economic and social development. At the same time, it consumes a lot of energy, causing serious environmental pollution. The total electricity consumption was 7,511 billion kWh in 2020, and the installed capacity of power plants of 6,000 kW and above was 2.2 billion kilowatts to meet the ever-increasing power demand in China, of which thermal power and nonfossil energy (hydropower, wind power, and photovoltaics) accounted for 56.6 and 43.4%, respectively. As for CO2 emissions, the power industry accounts for about 40% of the total emissions of the whole society, and the carbon emissions of other industries also come from their demand for electricity to a large extent (Holladay and LaRiviere, 2017).
Faced with the increasingly difficult situation of energy conservation and emission reduction, there has been an international effort to develop a low-carbon economy, especially in the power industry. For example, the growth rate of carbon emissions has declined in the United States due to the reduction in coal-fired power generation. European countries have also realized a continuous rate of reduction in emissions by reducing fossil fuel consumption in power generation (Mohsin et al., 2019). A relatively great potential of preserving the environment could be realized by more robust environmental policies and renewable energy resources for the set of 25 developing countries (Mohsin et al., 2021b). In China, the power development plan, the Sino-US joint statement on climate change, and the climate ambition summit have all put forward clear optimization goals for China’s energy consumption structure, namely, by 2030, carbon emissions per unit of GDP will be reduced by 60–65% compared to 2005, and nonfossil energy will account for about 25% (Lo, 2014; 2020). In September 2020, China pledged at the United Nations General Assembly to reach the peak of carbon emissions by 2030 and achieve carbon neutrality by 2060. The carbon peak goal and the carbon-neutral vision have been listed as the key tasks of the Central Economic Work Conference. The proportion of electricity in the terminal energy consumption increased year by year, and accordingly, the total primary energy consumption of this sector increased. Electric power is the hub of energy consumption. The “30·60” targets put forward higher requirements for carbon emission reduction in the electric power industry. Therefore, it is very important to formulate a rational pathway for the power industry to take the lead in realizing the targets of emission peak and carbon neutrality.
The first step for the pathway design is to evaluate the present status and improvement potential of the decision-making units (DMUs). In this regard, the DMUs are usually compared to the benchmarks to determine the corresponding operation situation and the possible inefficiency levels. The nonparametric data envelopment analysis (DEA) (Charnes et al., 1978) is considered a popular tool to assess the relative efficiency of the DMUs (Xia et al., 2020). It is also applied to the aggregation of sub-indicators, taking the low-carbon finance index for example (Mohsin et al., 2020). Based on the efficiency analysis results, the potentials of input reduction or output expansion are evaluated (Bello et al., 2018; Li et al., 2019; Nakaishi et al., 2021a). The neighborhood approach is also used to estimate the potential (Aarakit et al., 2021). In an environmental efficiency analysis, various methods have sprung up to incorporate undesirable outputs, for example, carbon emissions, into the models (Monastyrenko, 2017; An and Zhai, 2020; Li et al., 2021; Zhang et al., 2021). Among them, directional distance function (DDF) (Chung et al., 1997) methods have come into focus recently due to their feasibility in dealing with multiple inputs and outputs and nonradial characteristics (Zhou et al., 2018; Wang et al., 2019; Sun et al., 2020). In practice, the directional vectors can serve as guidance for the policy implementation or promotion direction. Along the directional vectors, the potential on inputs or outputs can be captured with policy or economic implications (Long et al., 2018; Song and Wang, 2018; Xian et al., 2019). The growth potential of environmental efficiency in China’s power generation sector was found to be 27% on average (Nakaishi et al., 2021b). However, it is a long-term task to realize the full potential of emission reduction, not to accomplish in one move, which has rarely been considered in the previous efficiency studies for the power industry. It needs to find an appropriate pathway to realize energy-saving and emission reduction targets for the DMUs of the power industry step by step. In addition, there exists regional diversity in the marginal abatement costs of China’s power industry (Xian et al., 2019). There is a need to investigate the impacts of resource endowment, the technological level, economic development, and other factors in the efficiency analysis to find out the sources of difference in operation status.
In analyzing the influence of individual characteristics, external environment, and other factors on environmental efficiency, various forms of regression analysis were commonly used. Among them, some directly analyze the efficiency and some research on the impact of a certain function of efficiency. For example, Halkos and Polemis (2018) analyzed the relationship between the environmental efficiency of the power sector and economic growth through curve fitting. There are also studies using the production function to analyze the impact of factors such as the economic level, population, industrial structure, production scale, electricity price, and bargaining power on the efficiency of the power system (Lozano et al., 2019; Lin and Zhu, 2020; Eguchi et al., 2021). Mohsin et al. (2021a) combined DEA and the difference-in-difference method to study the impacts of power reforms on energy efficiency and found that energy reform can be a good means to achieve high energy efficiency. The drivers of CO2 emissions in China’s power industry were assessed by the production-theoretical decomposition analysis based on DEA. The emission efficiency changes and the growth in installed capacity are identified as key contributors (Wang et al., 2019; Xie et al., 2021). The above analysis could provide an important reference for the existing inefficiency levels. However, from the practical perspective, it is of more operation significance and reference value to find out goals than to determine the efficiency/inefficiency levels for the purpose of realizing the full potential of emission reduction.
From the perspective of performance management, DEA methods are extended to evaluate performance in the context of improvement plans where certain management goals are set (Ruiz and Sirvent, 2019). To avoid setting unachievable or unambitious goals, studies established various models for target setting. Taking the closest target setting as an example, it guarantees that the targets are achievable and represent best practices (An et al., 2015; Ramón et al., 2016). Zhou et al. (2019) used a DEA benchmarking approach to determine goals and designed the reward and penalty plan accordingly. The target setting approach was used in the case study of 10 cities of the Chinese Huaihe River Basin. The impacts of decision-maker’s preferences on the target setting are investigated (Lim and Zhu, 2019; Chen and Wang, 2020). The above analyses of influencing factors and goal setting could provide important references for the targets of DMUs in the power industry in the case of inputs and desirable outputs. However, there exists correlation between the desirable and undesirable outputs in China’s power industry. The most feasible transitional path is ensuring benefits and social awareness and at the same time realizing energy-saving and emission reduction (Chai et al., 2020); that is, both desirable and undesirable outputs should be considered in setting gradual goals for the power industry. In addition, the goals set in the initial stage would necessarily affect the operational process. The efficiency analysis should not neglect the impacts of initial goals.
Given the above, this study expands the target model to include undesired outputs in recognition of benchmarking to monitor operation as well as plans (Stewart, 2010). The contributions of this work are twofold. First, it constructs short-term and long-term learning target models for the power sector under different goals and explores its energy conservation and emission reduction potential; it also explores reasonable steps to achieve energy conservation and emission reduction. The urgent need for a clean power structure and the structural characteristics of the provincial power sector itself, as well as the coordination between energy conservation and emission reduction, and power supply goals, are integrated into the constructed models. Second, in order to build realistic and feasible goals for the provincial power sector, it explores the emission reduction potential under different target systems based on the established efficiency analysis models and provides practical and feasible strategies and pathways for energy conservation and emission reduction in the provincial power sector based on the corresponding benchmark analysis.
The remainder of this article proceeds as follows. “Methods” section sets out the methods. In “The Gradual Targets of China’s Power Industry” section, we investigate the short- and long-term goals of China’s provincial power sector in energy-saving, emission reduction, and responsibility fulfillment, analyze the impacts of initial goal setting on efficiency, and explore feasible pathways. “Conclusion” section comes to conclusions.
This study will investigate the gradual goals for China’s provincial power sector in energy-saving, emission reduction, and responsibility fulfillment to explore feasible paths to realize the potential. To this end, we first apply the directional distance function to determine the energy-saving and emission reduction potential for the power sector. Second, we develop a target-setting model where the reference points are both attainable and representing best practice based on the closest target model.
Energy-saving and emission reduction targets based on the directional distance function.
Consider
Subscript 0 indicates the DMU being evaluated.
As stated in the previous section, decision-makers usually set goals at the beginning of the period. Moreover, the goals will orient the operation process at that period of time. In this subsection, we will establish a benchmark model in the framework of DEA to find out the targets for the DMUs. The targets would satisfy the following features. The targets represent the best practice which are expressed in terms of inputs and/or outputs and are attainable with reasonable distance from the current situation of the DMU; that is, in the short term, the power industry will pursue goals similar to its current profile to some extent. We denote the targets by vector
The objective function is to minimize a weighted L1 distance to the DMU under estimation.
We employ the methods introduced in the “Methods” section to explore the gradual pathway of China’s power industry in 30 provincial administrative regions (PARs) in terms of energy-saving, CO2 emission reduction, and responsibility fulfillment during the period 2010–2019; Tibet is not included due to data unavailability. The inputs include labor, installed capacity, and energy. Similar to the study of Duan et al. (2016), we take the sum of energy inputs as a single energy input indicator. The desirable output is electricity generated, and undesirable outputs are CO2 emissions stemming from three primary fossil fuels include coal, petroleum, and natural gas. The data of labor, installed capacity, energy, and electricity generated are from the China labor statistical yearbook, China electric power yearbook, China energy statistics yearbook, and compilation of statistical data of the electric power industry. The CO2 emissions are calculated through the method of IPCC. The descriptive statistics of the inputs and outputs are shown in Table 1.
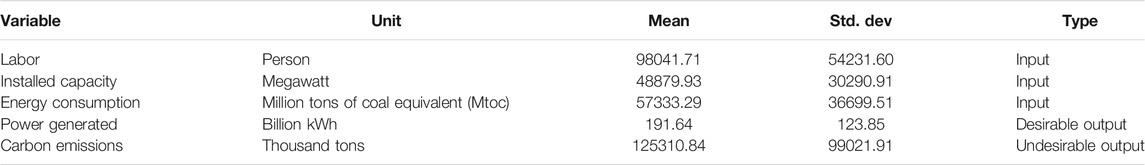
TABLE 1. Descriptive statistics of inputs and outputs.
Based on the DDF, where the directional vectors are the quantity of inputs and outputs indicators of the observations, the values of the distance function of the power sector in China’s 30 PARs during 2010–2019 are obtained. The distances of 2010, 2015, and 2019 and the average distances during the study period are shown in Figure 1. It shows that nine PARs get the lowest distance of zero on average, including Beijing, Tianjin, and Shanghai. Most of these areas are municipalities directly under the central government or located in the eastern developed areas. The corresponding power generation process is superior to others in terms of production and emission, and the observations are located on the production frontier. The lowest distance from the frontier of Sichuan and Yunnan might benefit from the advantages of energy resources and the development of external power transmission. The longest distance occurs in Heilongjiang Province. As an energy base, it is urgent to improve the environmental efficiency in power generation facing the pressure from primary energy-dominated energy mix and emission reduction. The trends of distance functions vary from one to another. Some have experienced growth, some have been declining, and some have risen before falling. Taking a new round of electric power reform in 2015 as the boundary, it shows that most of the regions have experienced the narrowing of the distance, which is inseparable from the promotion effect of power reform.
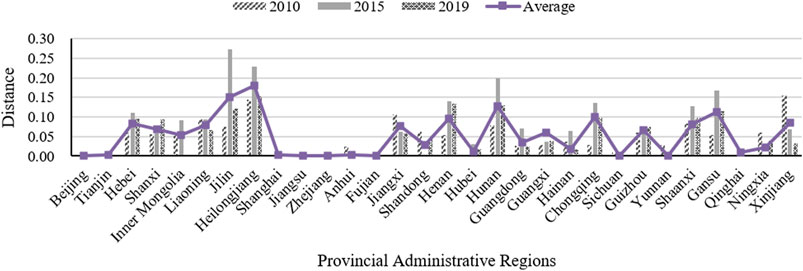
FIGURE 1. Directional distance of the power sector of provincial administrative regions.
In order to more intuitively reflect the performance of each region’s power sector, a scatter diagram of the environmental efficiency during the study period is shown in Figure 2. It shows that the relative efficiency has experienced a trend of slight decentralization around 2015. Most of the observations on the efficient frontier have always been in the lead. The slight changes in environmental efficiency indicate a catch-up effect among the regions in power generation and emission reduction.
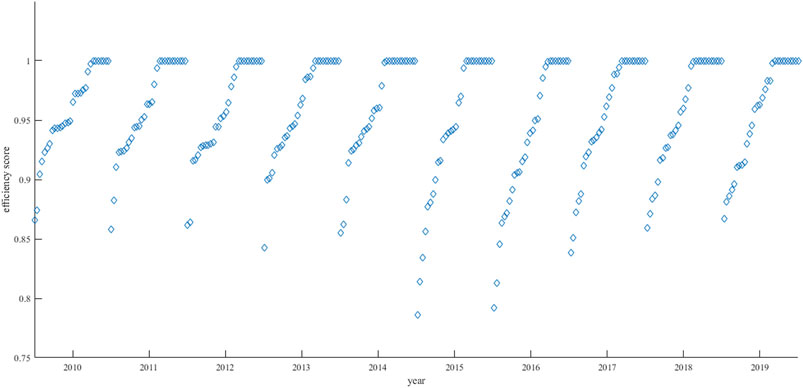
FIGURE 2. Environmental efficiency of the power sector during 2010–2019.
From the perspective of practice, it is more meaningful to know the specific goals of each input/output indicator for the plans than the relative efficiency levels. Therefore, the reference targets for each DMU in terms of inputs, desirable outputs, and undesirable outputs are calculated by the weighted sum of the observations on the efficient frontier participating in constructing the benchmarks. Taking the ith input for example, the target can be obtained by
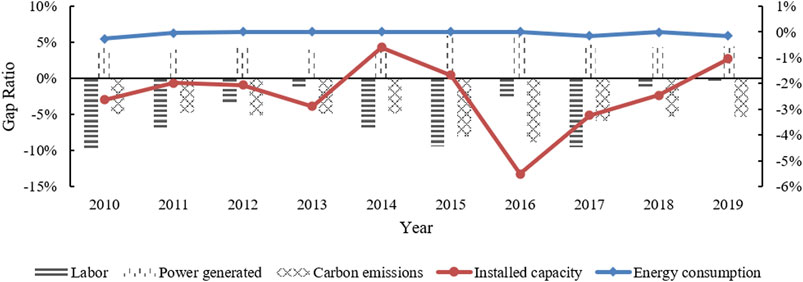
FIGURE 3. Gap ratio of the inputs/outputs in the power sector during 2010–2019.
For the input indicators, the gap ratio of installed capacity moves around 2.41%. The gap ratio of energy input slightly fluctuates around zero, which may be due to the energy input, and in this study, it is the total energy input rather than a certain energy type. The energy input needs to support the power supply and economic operation, and the way to further improve the environmental efficiency of the power generation sector is to optimize the power mix rather than simply reducing the energy input. As for the labor input, it is approximated by the total input in the production and supply of electric power and heat power industry. The fluctuation of the gap ratio needs to further clarify the exact values of the power generation industry. From the point of view of outputs, we can find that the gap ratio of electricity generated is relatively stable at 4% except for 2015 and 2016. It indicates that the relative gap among the regions regarding desirable output has not been widened or narrowed to some extent during the study period. When turning to the undesirable output, the gap ratio is larger than the desirable one. The maximum gap of 8.80% is in 2016, the year after the new round of power reform. On average, the carbon emissions could be reduced by 5.79% through environmental efficiency improvement.
In detail, we can obtain the specific quantity of targets in the inputs and outputs for each region to realize. From the perspective of serving society and emission reduction, the targets of desirable and undesirable output in the latest year of the study period 2019 are listed in Table 2. The emission reduction potentials of Heilongjiang and Henan were over 15% in the measurement of the gap ratio. Large potential abatement cost savings would be realized by trading emission permits for these regions (Xian et al., 2019). In terms of the total amount, the carbon emission reduction could have been up to 196.35 million tons in 2019 if the power sector of all regions achieved the best practice of that time. It is hard to realize the amount of emission reduction by a nonstop process. A feasible and smooth transition target for each provincial power sector needs to be investigated.
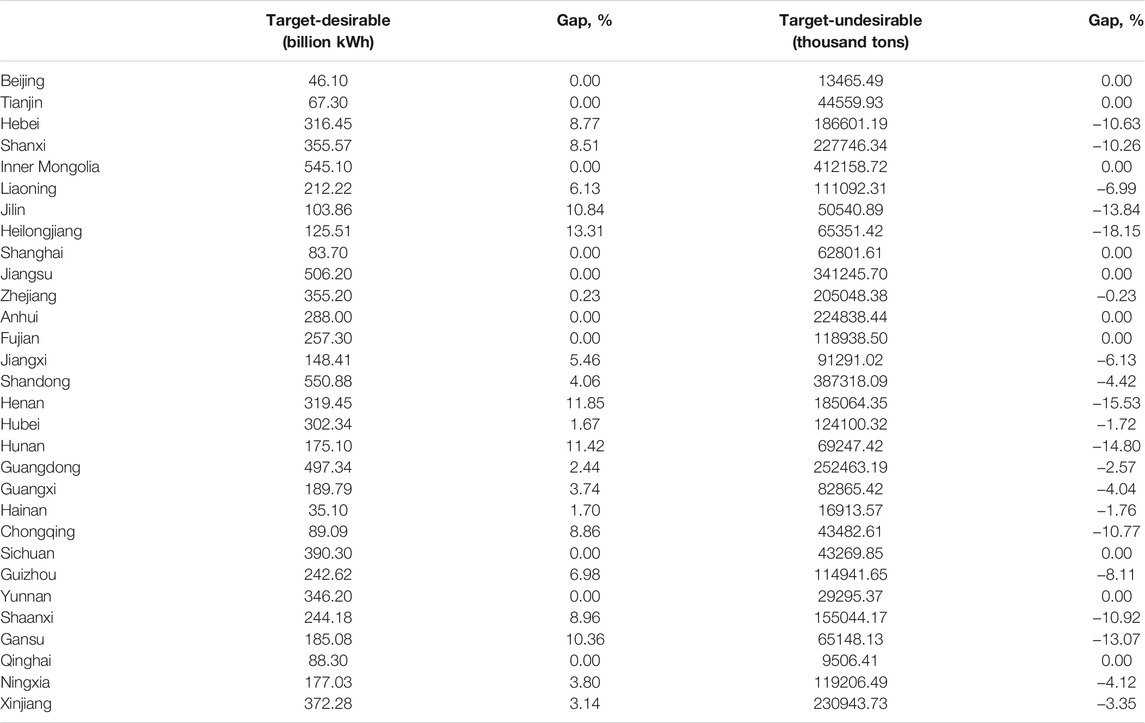
TABLE 2. Reference targets of desirable and undesirable outputs for the power sector in 2019.
As stated in the “Methods” section, realizing the potential of input saving and emission reduction needs a gradual pathway instead of accomplishing in one stroke. For this reason, we applied the models of attainable and best practice targets setting in the previous section to the power generation sectors of 30 PARs. The gap ratios, of which the calculation process is the same as the “Environmental Efficiency Analysis of the Power Sector Under DDF” section, of each region during the study period 2011–2019 are shown in Table 3. In order to compare the gap ratio of each region’s power sector as a whole, the weighted sum of the gap ratios of each input/output indicator is constructed. Herein, the inputs (labor, installed capacity, and energy) and outputs (electricity generated and carbon emissions) are endowed with the same weight of 1/2, of which each input indicator gets a weight of 1/6. For the outputs, power supply and emission reduction are assumed to be equally important; that is, the weights of desirable and undesirable output are both equal to 1/4. The weighted sums of the indicators for the power sectors in Table 3 are sorted by the average values of the 10 years in the last column.
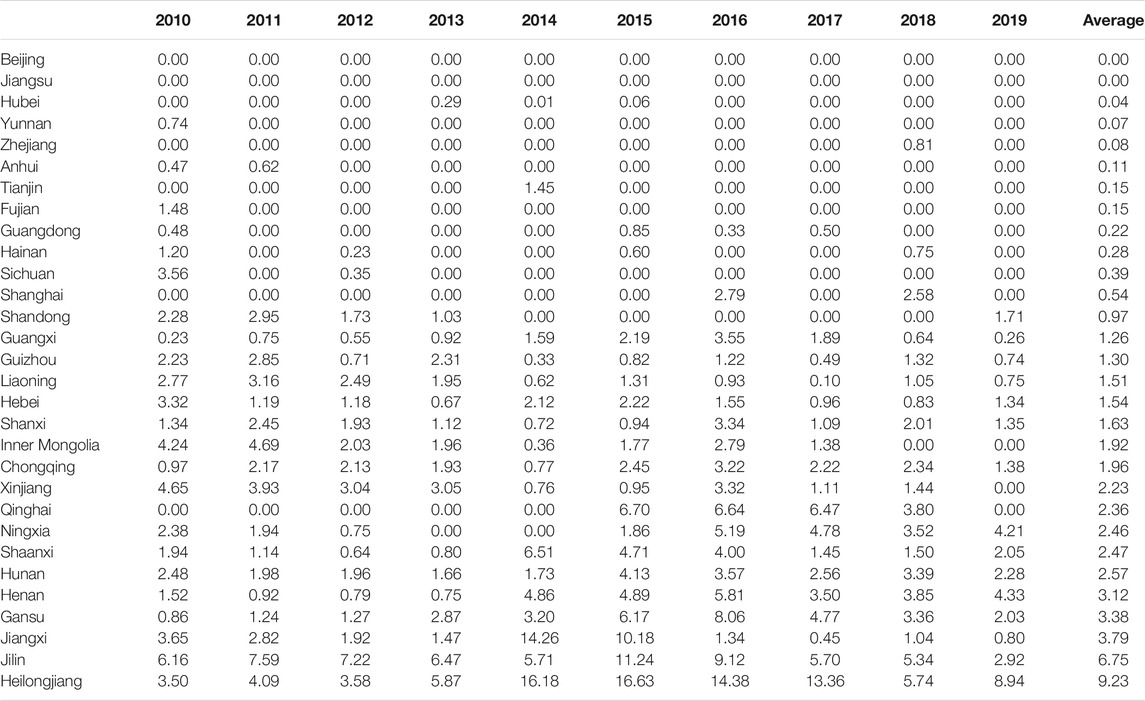
TABLE 3. Gap ratios between the observations and the closest targets of the power sector (%).
On average, Beijing and Jiangsu have obtained the lowest gap ratio of zero during the study period, which means that these two regions provide an example in power generation for others in terms of environmental efficiency. If all the regions realized the closest targets, a 1.75% increase could have been achieved. The gap ratios for Hubei, Yunnan, and Zhejiang are all below 1%, which indicates the power sectors of these regions are near the best practice. The highest ratios for Heilongjiang and Jilin indicate that it is very urgent for these two regions to realize the transformation in the power industry. After all, the targets here are the closest ones of the best practice frontier for these regions with consideration of their specialties. The variance analysis of the gap ratios shows that there exist significant differences in both the regions and different years under the 1% confidence level, as shown in Table 4. It further enhances the importance of learning about each other’s practices in terms of power generation and emission reduction.
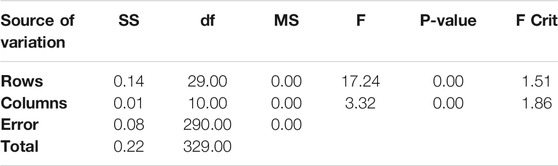
TABLE 4. ANOVA statistics of the gap ratios.
The gap ratios of the inputs and outputs could provide strategic references for the improvement of environmental efficiency and transformation of the power industry. To realize the potential of input/undesirable output reduction and desirable output increase in the previous subsection, it needs a specific roadmap. Figure 4 presents the gap ratios of each indicator compared to the closest targets, which are attainable and represent the best practice. The column charts (labor, installed capacity, and power generated) and line charts (energy consumption and carbon emissions) correspond to the left and the right coordinate, respectively. The empirical results also provide evidence for the importance of gradual goals by comparing the gap ratios of DDF results and closest targets in Figures 3, 4.
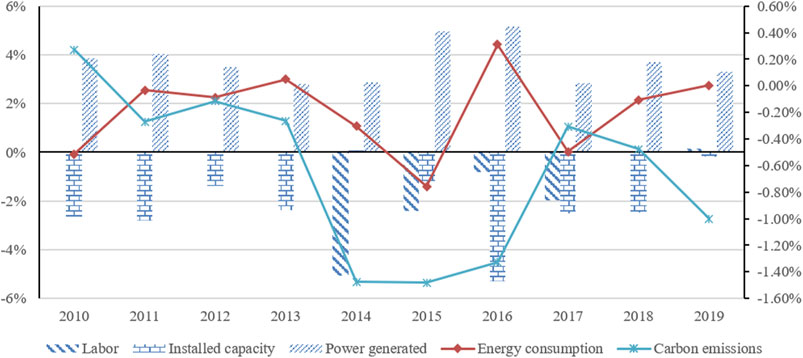
FIGURE 4. Gap ratio of the inputs/outputs compared to the closest targets.
From the perspective of inputs, the gap ratios of energy input fluctuate around zero during the study period, which may be due to the total quantity of energy input that neglects the power mix. The gap existing in the labor input is relatively high during 2014–2017. For the installed capacity, we can find that the largest gap occurred in 2016 after the new round of power reform. The gap has been narrowed after 2017. As to the desirable output, a 3.71% increase could have been realized if the closest targets were reached. The line of carbon emissions shows that the gaps for the years around 2015 are the largest. The reform may promote the renewal and practice of emission reduction strategies in some regions.
The targets of desirable output increase and undesirable output decrease are calculated and shown in Figure 5. The quantities corresponding to DDF and the closest targets are presented, respectively. The positive and negative signs in the figure indicate the increase or decrease and cannot be calculated by simply adding up. There exists a clear gap between the two curves for both the desirable and undesirable outputs. That is, the closest targets are lower than the ones under directional distance functions without considering the profile of the regions under estimation. It again demonstrated the feasibility and necessity of periodical target setting. Regardless of the specific value, the trends of the short- and long-term targets have strong consistency. From the perspective of the transformation of the power industry, it provides gradual goals for power supply and emission reduction.
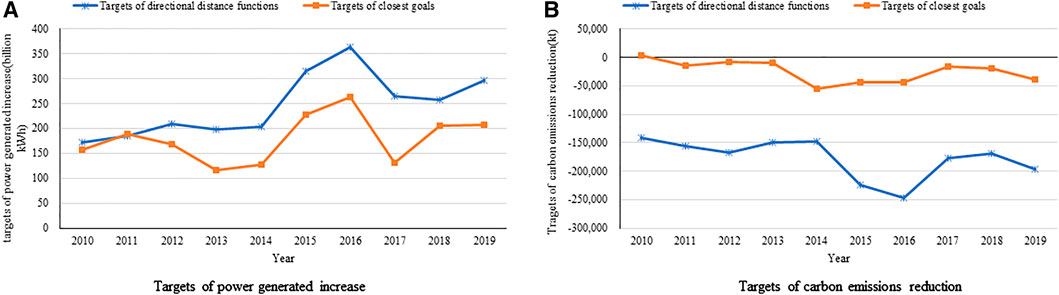
FIGURE 5. Targets of desirable and undesirable outputs.
As a dominant industry in supporting the national economic and social development and realizing energy-saving and emission reduction targets, it is very urgent to formulate a rational pathway for the power industry to realize its transformation. In this study, we established models for target setting of the power industry in the framework of DEA where the reference sets participating in constructing benchmarks for the DMUs and the potentials of input and output adjustment were obtained first. Considering that it is a long-term task to realize the full potential of the indicators, the attainable targets in the short-term representing best practice were found out by a mixed-integer programming model. The models are used to analyze the gradual goals of the power sectors in China’s 30 provincial administrative regions. Based on the empirical analysis, the main conclusions are as follows. First, it is of great importance to consider the profile of each region’s power sector in setting energy-saving and emission reduction targets. The analysis of variance demonstrates significant differences in the reference points of inputs and outputs in both regions and different years under the 1% confidence level. Second, short- and long-term targets of inputs and outputs are investigated by the constructed models for each region’s power sector. Regardless of the specific quantity, the strongly consistent trends of the targets demonstrated the feasibility and effectiveness of the gradual goals. In terms of the total amount, 196.35 million tons of carbon emission reduction could have been realized in 2019 if the power sector of all regions achieved the best practice of that time. Finally, realizing the potential of input saving and emission reduction needs a gradual pathway instead of accomplishing in one stroke. The targets of this study which are attainable for the present profile of the power sector and still represent best practice could serve as transitional benchmarks in power supply and emission reduction. To further achieve carbon neutrality, it needs to transform the management strategy to coordinate power supply and renewable energy accommodation.
There are still some deficiencies in our research. First, due to data availability, the labor input is the total number of employees of production and supply of electric power and heat power industry rather than electric power industry, which may affect the estimation results. Second, it lacks analysis on the influence of external environmental factors. The limitations will be addressed in future research.
The original contributions presented in the study are included in the article/Supplementary Material; further inquiries can be directed to the corresponding author.
All authors have significant contributions to the manuscript. GL: conceptualization, writing—review and editing, and supervision. XY: supervision and writing—review and editing. ND: conceptualization, establishing models, empirical analysis, and writing—original draft, review, and editing.
This research was funded by the National Natural Science Foundation of China under grant No. 71874121, the National Key R&D Program of China (No. 2018YFC0704400), the Major Projects of the National Social Science Fund (No. 17ZDA065), and the project of development strategy of clean energy demonstration of Qinghai Province.
Authors GL and XY are employed by State Grid Energy Research Institute Co., Ltd.
The remaining author declares that the research was conducted in the absence of any commercial or financial relationships that could be construed as a potential conflict of interest.
All claims expressed in this article are solely those of the authors and do not necessarily represent those of their affiliated organizations, or those of the publisher, the editors, and the reviewers. Any product that may be evaluated in this article, or claim that may be made by its manufacturer, is not guaranteed or endorsed by the publisher.
We gratefully acknowledge the financial support from the above funding. We also appreciate the valuable comments of the reviewers.
Aarakit, S. M., Ssennono, V. F., and Adaramola, M. S. (2021). Estimating Market Potential for Solar Photovoltaic Systems in Uganda. Front. Energ. Res. 9 (36). doi:10.3389/fenrg.2021.602468
An, Q., Pang, Z., Chen, H., and Liang, L. (2015). Closest Targets in Environmental Efficiency Evaluation Based on Enhanced Russell Measure. Ecol. Indicators 51, 59–66. doi:10.1016/j.ecolind.2014.09.008
An, Y., and Zhai, X. (2020). SVR-DEA Model of Carbon Tax Pricing for China's thermal Power Industry. Sci. Total Environ. 734, 139438. doi:10.1016/j.scitotenv.2020.139438
Bello, M. O., Solarin, S. A., and Yen, Y. Y. (2018). Hydropower and Potential for Interfuel Substitution: The Case of Electricity Sector in Malaysia. Energy 151, 966–983. doi:10.1016/j.energy.2018.03.055
Chai, J., Fan, W., and Han, J. (2020). Does the Energy Efficiency of Power Companies Affect Their Industry Status? A DEA Analysis of Listed Companies in Thermal Power Sector. Sustainability 12 (1), 138. doi:10.3390/su12010138
Charnes, A., Cooper, W. W., and Rhodes, E. (1978). Measuring the Efficiency of Decision Making Units. Eur. J. Oper. Res. 2 (6), 429–444. doi:10.1016/0377-2217(78)90138-8
Chen, L., and Wang, Y.-M. (2020). DEA Target Setting Approach within the Cross Efficiency Framework. Omega 96, 102072. doi:10.1016/j.omega.2019.05.008
Chung, Y. H., Färe, R., and Grosskopf, S. (1997). Productivity and Undesirable Outputs: a Directional Distance Function Approach. J. Environ. Manag. 51, 229–240. doi:10.1006/jema.1997.0146
Duan, N., Guo, J.-P., and Xie, B.-C. (2016). Is There a Difference between the Energy and CO2 Emission Performance for China's thermal Power Industry? A Bootstrapped Directional Distance Function Approach. Appl. Energ. 162 (0), 1552–1563. doi:10.1016/j.apenergy.2015.02.066
Eguchi, S., Takayabu, H., and Lin, C. (2021). Sources of Inefficient Power Generation by Coal-Fired thermal Power Plants in China: A Metafrontier DEA Decomposition Approach. Renew. Sustain. Energ. Rev. 138, 110562. doi:10.1016/j.rser.2020.110562
Färe, R., Grosskopf, S., and Lovell, C. K. (1985). The Measurement of Efficiency of Production. Dordrecht: Springer.
Halkos, G. E., and Polemis, M. L. (2018). The Impact of Economic Growth on Environmental Efficiency of the Electricity Sector: A Hybrid Window DEA Methodology for the USA. J. Environ. Manage. 211, 334–346. doi:10.1016/j.jenvman.2018.01.067
Holladay, J. S., and LaRiviere, J. (2017). The Impact of Cheap Natural Gas on Marginal Emissions from Electricity Generation and Implications for Energy Policy. J. Environ. Econ. Manage. 85 (Suppl. C), 205–227. doi:10.1016/j.jeem.2017.06.004
Li, H.-Z., Kopsakangas-Savolainen, M., Yan, M.-Z., Wang, J.-L., and Xie, B.-C. (2019). Which Provincial Administrative Regions in China Should Reduce Their Coal Consumption? an Environmental Energy Input Requirement Function Based Analysis. Energy Policy 127, 51–63. doi:10.1016/j.enpol.2018.11.037
Li, W., Chien, F., Hsu, C.-C., Zhang, Y., Nawaz, M. A., Iqbal, S., et al. (2021). Nexus between Energy Poverty and Energy Efficiency: Estimating the Long-Run Dynamics. Resour. Pol. 72, 102063. doi:10.1016/j.resourpol.2021.102063
Lim, S., and Zhu, J. (2019). Primal-dual Correspondence and Frontier Projections in Two-Stage Network DEA Models. Omega 83, 236–248. doi:10.1016/j.omega.2018.06.005
Lin, B., and Zhu, J. (2020). Chinese Electricity Demand and Electricity Consumption Efficiency: Do the Structural Changes Matter? Appl. Energ. 262, 114505. doi:10.1016/j.apenergy.2020.114505
Lo, K. (2014). A Critical Review of China's Rapidly Developing Renewable Energy and Energy Efficiency Policies. Renew. Sustain. Energ. Rev. 29, 508–516. doi:10.1016/j.rser.2013.09.006
Lo, K. (2020). Governing Energy Consumption in China: a Comprehensive Assessment of the Energy Conservation Target Responsibility System. Energy Transitions 4, 57–67. doi:10.1007/s41825-020-00023-0
Long, X., Wu, C., Zhang, J., and Zhang, J. (2018). Environmental Efficiency for 192 thermal Power Plants in the Yangtze River Delta Considering Heterogeneity: A Metafrontier Directional Slacks-Based Measure Approach. Renew. Sustain. Energ. Rev. 82, 3962–3971. doi:10.1016/j.rser.2017.10.077
Lozano, S., Hinojosa, M. A., and Mármol, A. M. (2019). Extending the Bargaining Approach to DEA Target Setting. Omega 85, 94–102. doi:10.1016/j.omega.2018.05.015
Mohsin, M., Hanif, I., Taghizadeh-Hesary, F., Abbas, Q., and Iqbal, W. (2021a). Nexus between Energy Efficiency and Electricity Reforms: A DEA-Based Way Forward for Clean Power Development. Energy Policy 149, 112052. doi:10.1016/j.enpol.2020.112052
Mohsin, M., Kamran, H. W., Atif Nawaz, M., Sajjad Hussain, M., and Dahri, A. S. (2021b). Assessing the Impact of Transition from Nonrenewable to Renewable Energy Consumption on Economic Growth-Environmental Nexus from Developing Asian Economies. J. Environ. Manage. 284, 111999. doi:10.1016/j.jenvman.2021.111999
Mohsin, M., Rasheed, A. K., Sun, H., Zhang, J., Iram, R., Iqbal, N., et al. (2019). Developing Low Carbon Economies: An Aggregated Composite index Based on Carbon Emissions. Sustainable Energ. Tech. Assessments 35, 365–374. doi:10.1016/j.seta.2019.08.003
Mohsin, M., Taghizadeh-Hesary, F., Panthamit, N., Anwar, S., Abbas, Q., and Vo, X. V. (2020). Developing Low Carbon Finance Index: Evidence from Developed and Developing Economies. Finance Res. Lett., 101520. doi:10.1016/j.frl.2020.101520
Monastyrenko, E. (2017). Eco-efficiency Outcomes of Mergers and Acquisitions in the European Electricity Industry. Energy Policy 107, 258–277. doi:10.1016/j.enpol.2017.04.030
Nakaishi, T., Kagawa, S., Takayabu, H., and Lin, C. (2021a). Determinants of Technical Inefficiency in China’s Coal-Fired Power Plants and Policy Recommendations for CO2 Mitigation. Environ. Sci. Pollut. Res. doi:10.1007/s11356-021-14394-4
Nakaishi, T., Takayabu, H., and Eguchi, S. (2021b). Environmental Efficiency Analysis of China's Coal-Fired Power Plants Considering Heterogeneity in Power Generation Company Groups. Energ. Econ., 105511. doi:10.1016/j.eneco.2021.105511
Ramón, N., Ruiz, J. L., and Sirvent, I. (2016). “On the Use of DEA Models with Weight Restrictions for Benchmarking and Target Setting,” in International Series in Operations Research and Management Science. Cham: Springer
Ruiz, J. L., and Sirvent, I. (2019). Performance Evaluation through DEA Benchmarking Adjusted to Goals. Omega 87, 150–157. doi:10.1016/j.omega.2018.08.014
Shephard, R. W., Gale, D., and Kuhn, H. W. (1970). Theory of Cost and Production Functions. Princeton: Princeton University Press.
Song, M., and Wang, J. (2018). Environmental Efficiency Evaluation of thermal Power Generation in China Based on a Slack-Based Endogenous Directional Distance Function Model. Energy 161, 325–336. doi:10.1016/j.energy.2018.07.158
Stewart, T. J. (2010). Goal Directed Benchmarking for Organizational Efficiency. Omega 38 (6), 534–539. doi:10.1016/j.omega.2010.01.004
Sun, H., Kporsu, A. K., Taghizadeh-Hesary, F., and Edziah, B. K. (2020). Estimating Environmental Efficiency and Convergence: 1980 to 2016. Energy 208, 118224. doi:10.1016/j.energy.2020.118224
Wang, H., Zhou, P., Xie, B.-C., and Zhang, N. (2019). Assessing Drivers of CO2 Emissions in China's Electricity Sector: A Metafrontier Production-Theoretical Decomposition Analysis. Eur. J. Oper. Res. 275 (3), 1096–1107. doi:10.1016/j.ejor.2018.12.008
Xia, Z., Abbas, Q., Mohsin, M., and Song, G. (2020). Trilemma Among Energy, Economic and Environmental Efficiency: Can Dilemma of EEE Address Simultaneously in Era of COP 21? J. Environ. Manage. 276, 111322. doi:10.1016/j.jenvman.2020.111322
Xian, Y., Wang, K., Wei, Y.-M., and Huang, Z. (2019). Would China's Power Industry Benefit from Nationwide Carbon Emission Permit Trading? an Optimization Model-Based Ex Post Analysis on Abatement Cost Savings. Appl. Energ. 235, 978–986. doi:10.1016/j.apenergy.2018.11.011
Xie, B.-C., Tan, X.-Y., Zhang, S., and Wang, H. (2021). Decomposing CO2 Emission Changes in thermal Power Sector: A Modified Production-Theoretical Approach. J. Environ. Manage. 281, 111887. doi:10.1016/j.jenvman.2020.111887
Zhang, X., Jiang, Q., Khattak, S. I., Ahmad, M., and Rahman, Z. U. (2021). Achieving Sustainability and Energy Efficiency Goals: Assessing the Impact of Hydroelectric and Renewable Electricity Generation on Carbon Dioxide Emission in China. Energy Policy 155, 112332.
Zhou, X., Luo, R., An, Q., Wang, S., and Lev, B. (2019). Water Resource Environmental Carrying Capacity-Based Reward and Penalty Mechanism: A DEA Benchmarking Approach. J. Clean. Prod. 229, 1294–1306. doi:10.1016/j.jclepro.2019.05.004
Keywords: gradual goals, power mix optimization, development pathway, emission reduction, power industry
Citation: Lu G, Yan X and Duan N (2021) Gradual Goals of Energy Transformation and Upgrading in China’s Power Industry Considering Production Profiles. Front. Energy Res. 9:724308. doi: 10.3389/fenrg.2021.724308
Received: 12 June 2021; Accepted: 08 September 2021;
Published: 14 October 2021.
Edited by:
Karim Anaya Stucchi, University of Cambridge, United KingdomReviewed by:
Kevin Lo, Hong Kong Baptist University, SAR ChinaCopyright © 2021 Lu, Yan and Duan. This is an open-access article distributed under the terms of the Creative Commons Attribution License (CC BY). The use, distribution or reproduction in other forums is permitted, provided the original author(s) and the copyright owner(s) are credited and that the original publication in this journal is cited, in accordance with accepted academic practice. No use, distribution or reproduction is permitted which does not comply with these terms.
*Correspondence: Na Duan, bmFkdWFuQHRqdWZlLmVkdS5jbg==
Disclaimer: All claims expressed in this article are solely those of the authors and do not necessarily represent those of their affiliated organizations, or those of the publisher, the editors and the reviewers. Any product that may be evaluated in this article or claim that may be made by its manufacturer is not guaranteed or endorsed by the publisher.
Research integrity at Frontiers
Learn more about the work of our research integrity team to safeguard the quality of each article we publish.