 Haifeng Luo
 Xun Dou1*
94% of researchers rate our articles as excellent or good
Learn more about the work of our research integrity team to safeguard the quality of each article we publish.
Find out more
METHODS article
Front. Energy Res., 14 September 2021
Sec. Smart Grids
Volume 9 - 2021 | https://doi.org/10.3389/fenrg.2021.723319
This article is part of the Research TopicApplications of Advanced Control and Artificial Intelligence in Smart GridsView all 16 articles
Wind power generation is likely to hinder the safe and stable operations of power systems for its irregularity, intermittency, and non-smoothness. Since wind power is continuously connected to power systems, the step length required for predicting wind power is increasingly extended, thereby causing an increasing cumulative error. Correcting the cumulative error to predict wind power in multi-step is an urgent problem that needs to be solved. In this study, a multi-step wind power prediction method was proposed by exploiting improved TCN to correct the cumulative error. First, multi-scale convolution (MSC) and self-attentiveness (SA) were adopted to optimize the problem that a single-scale convolution kernel of TCN is difficult to extract temporal and spatial features at different scales of the input sequence. The MSC-SA-TCN model was built to recognize and extract different features exhibited by the input sequence to improve the accuracy and stability of the single-step prediction of wind power. On that basis, the multi-channel time convolutional network with multiple input and multiple output codec technologies was adopted to build the nonlinear mapping between the output and input of the TCN multi-step prediction. The method improved the problem that a single TCN is difficult to tap the different nonlinear relationships between the multi-step prediction output and the fixed input. The MMED-TCN multi-step wind power prediction model was developed to separate linearity and nonlinearity between input and output to reduce the multi-step prediction error. An experimental comparative analysis was conducted based on the measured data from two wind farms in Shuangzitai, Liaoning, and Keqi, Inner Mongolia. As revealed from the results, the MAE and RMSE of the MMED-TCN-based multi-step prediction model achieved the cumulative mean values of 0.0737 and 0.1018. The MAE and RMSE metrics outperformed those of the VMD-AMS-TCN and MSC-SA-TCN models. It can be seen that the wind power prediction method proposed in this study could improve the feature extraction ability of TCN for input sequences and the ability of mining the mapping relationship between multiple inputs and multiple outputs. The method is superior in terms of the accuracy and stability of wind power prediction.
The increasing depletion of traditional energy sources (e.g., fossil fuels and natural gas) has greatly challenged the development of power systems (Wu et al., 2020). Wind energy will become the most promising clean energy source for its inexhaustible and renewable characteristics (Du et al., 2017). The global installed wind power capacity is expected to reach nearly 800 GW by 2021 (Global Wind Energy Council, 2021). Because wind power output is found to be intermittent and stochastic, an accurate wind power prediction method acts as a vital technical tool to ensure the safe, stable, and economic operation of the power system (Ye and Zhao, 2014). Since wind power is continuously connected to the power system, the requirements for step length of its prediction are gradually increasing and the accuracy requirements are gradually becoming higher. However, the conventional multi-step rolling prediction model should exploit the wind power predicted at the previous moment to predict the wind power at the subsequent moment and the prediction result at the subsequent moment will accumulate the prediction error of the previous moment. The cumulative error of wind power will increase as the number of prediction steps rises continuously (Chen et al., 2017). The phenomenon will increase the difficulty of the multi-step prediction of wind power. Accordingly, correcting the cumulative error to conduct the multi-step prediction of wind power should be solved urgently.
On the whole, the existing multi-step prediction of wind power has been conducted based on the single-step prediction. Relevant researchers have adopted a range of methods for the single-step and multi-step predictions of wind power. The mentioned methods can fall into three main categories, i.e., statistical methods, physical methods (Wu et al., 2017), and combined prediction methods (Han et al., 2019). The physical method refers to a wind power prediction method based solely on the historical wind power data and the Numerical Weather Prediction (NWP) data (Louka et al., 2008; De Giorgi et al., 2011; Cassola and Burlando, 2012; Liu et al., 2020a). The physical methods generally apply to the single-step prediction. The single-step wind power prediction based on the physical method exhibits the advantages as follows: the small amount of data relied on, the simplicity of the model, and the convenience and speed of prediction. However, large errors exist between the NWP data and real weather data, and spatial differences are identified between NWP data and wind farms, thereby causing the accuracy of the physical method for the single-step wind power prediction to be generally low. The statistical method refers to a wind power prediction method, updating and adjusting the model weights and parameters based on the error between the predicted and true values. It usually falls into probabilistic statistical models, machine learning models, and deep learning models. Probabilistic statistical models consist of Auto-Regressive Moving Average Model (ARMA) (Wang et al., 2015a) and Autoregressive Integrated Moving Average Model (ARIMA) (Cao et al., 2019; Liu et al., 2020b). It can more effectively follow the wind power forecast than physical methods. Physical methods can better follow the trend of wind power, whereas a large get error occurs in the multi-step prediction. Machine learning models consist of Support Vector Machine (SVM) (Zhang et al., 2016), Random Forest (RF) (Liu et al., 2015), and Hidden Markov Model (HMM) (Lahouar and Ben Hadj Slama, 2017), all of which exhibit better single-step prediction accuracy than that of conventional probabilistic models. Deep learning models comprise Neural Network Model (Zhou et al., 2018), Long Short-Term Memory (LSTM) (Li et al., 2018; Li et al., 2020; Liu and Liu, 2021), and Gated Recurrent Unit (GRU) (Hochreiter and Schmidhuber, 1997; Chung et al., 2014). They are capable of fully exploiting the temporal and spatial characteristics of the input sequence to improve further the accuracy of the single-step prediction of wind power. Statistical methods can effectively extract the linear and nonlinear relationships of historical data and promote the single-step prediction of wind power to be more accurate, whereas it is difficult to conduct an accurate and stable multi-step prediction of wind power series with strong randomness and obvious noise signals for their single structure and high data quality requirements (Tascikaraoglu and Uzunoglu, 2014; Wu et al., 2019).
The combined prediction method refers to a wind power prediction method that maintains the advantages of all single prediction models to achieve more accurate and stable predictions. It is generally used in wind power multi-step prediction. The literature (Lin and Liu, 2011; Wang et al., 2015b; Wang et al., 2020a) has combined VMD (Liu et al., 2018) and GRU to form a combined model for the multi-step prediction of wind power. Moreover, compared with a single model, the combined model single-step prediction results can better track the variation of wind power; however, it is limited by the VMD model and the cumulative error occurs in the multi-step prediction. The literature (Catalao et al., 2010) has employed a hybrid prediction model with wavelet transform, a particle swarm algorithm, and an integrated adaptive network fuzzy inference system. Such a model achieved better mean absolute percentage error (MAPE) and normalized mean absolute error (NMAE) of the single-step prediction than those of the single model; however, the identical problem of cumulative error existed. The literature (Wang et al., 2020b) has combined LSTM, RF, VMD, and wavelet transform (WT) to build a multi-timescale wind power prediction model, and the combined prediction model outperformed others in multiple timescales. The above-mentioned combined prediction method has better prediction performance compared with physical and statistical methods, while no corresponding solution has been given for the multi-step prediction cumulative error.
Combined with the above-mentioned methods, given the cumulative error of existing studies in the wind power multi-step prediction and the incomplete input sequence feature extraction of TCN application in the wind power prediction, this study proposed a wind power multi-step prediction method based on improved TCN to correct the cumulative error. The main contributions of this study are as follows:
1) The MSC-SA-TCN model was established to reduce difficulty in extracting the temporal and spatial features of different scales of the input sequence with the single-scale convolutional kernel of TCN using MSC and SA. It can recognize and extract different features of the input sequence to promote the single-step prediction of wind power to be more accurate and stable.
2) The MMED-TCN multi-step wind power prediction model was proposed to develop the mapping relationship between the output and input of TCN multi-step prediction using the codec of multi-channel time convolutional network with multiple inputs and multiple outputs. Such an effort aims to improve the problem that the different nonlinear relationships between multi-step prediction outputs and fixed inputs are difficult to mine. It can separate linearity and nonlinearity between the input and output to reduce the cumulative error of the multi-step rolling wind power prediction.
This study is organized as follows. In Design of Multi-Step Prediction Model Based on Improved TCN, the design of the improved TCN multi-step prediction model is elucidated. In Algorithm Flow, the algorithmic process of the wind power multi-step prediction based on improved TCN for correcting the cumulative error is illustrated. In Experiment and Analysis, LSTM, VMD-AMS-TCN, and other models are adopted to compare the experiments with the MSC-SA-TCN model and MMED-TCN model proposed in this study. The experimental results are analyzed specifically to verify the superiority of the model proposed in this study. In Conclusion, relevant conclusions and subsequent research directions are given.
On the whole, the TCN model consists of causal convolution, dilated convolution, and residual block. It has a more lightweight network structure than CNN, LSTM, and GRU (Drdgomiretskiy and Zosso, 2013; Bai and Koltun, 2018). The perceptual field of the network can be altered according to the filter size. It is more conducive to the prediction of time series.
Set the filter F=(f1,f2,...,fK), the number is Fn, and the output sequence information is Y=(y1,y2,...,ys), where the input is S=(s1,s2,...,sn), where si,i∈[1,n] is the column vector. The following equation gives the causal null convolution of st at moment t:
where d denotes the expansion factor, K denotes the filter size, and the formula for the perceptual field is RF=(K-1)d+1. The causal and null convolution for K = 3 in TCN are given in Figure 1.
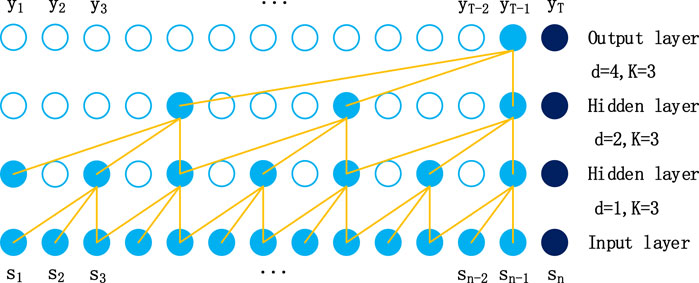
FIGURE 1. Causal convolution and null convolution in TCN.
The TCN model introduced the residual module. The problem of gradient explosion and network degradation in deep conventional neural networks was solved. The residual module of the TCN model is given in Figure 2.
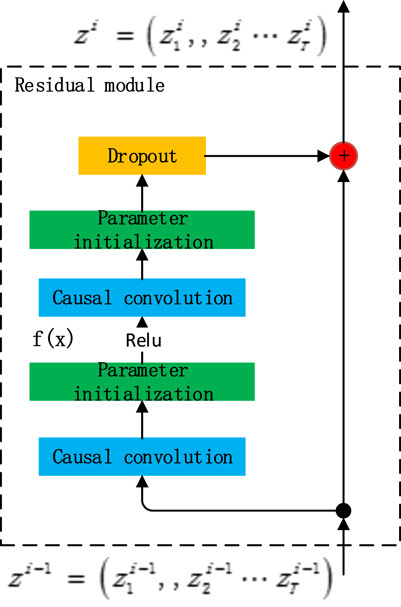
FIGURE 2. Residual module of TCN model.
In the figure, zi−1 is the input of the network at layer i-1 and z1 is the output of the network at layer i. The calculation in the figure can be expressed as follows:
where W1,W2, b1, and b2 denote the mapping parameters to be learned by the TCN; σ(·) is the Rule function.
According to the mentioned brief and literature research, the current TCN faces difficulty in extracting multi-scale temporal and spatial features of input sequences and in mining the different nonlinear mapping relationships between multi-step prediction outputs and fixed inputs.
To solve the problem that the size of the convolution kernel of the conventional TCN model is fixed, in order to reduce the difficulty in extracting the multi-scale temporal and spatial features extracted from the input sequence, this study proposed an improved TCN model based on MSC-SA. First, different scales of convolution were adopted to extract the complete time-space features of wind power sequences. Subsequently, the self-attentive mechanism was used to mine the correlation among the features and distinguish the important features from the non-important ones. Lastly, the output of MSC-SA acted as the input of TCN. The structure of the MSC-SA-TCN model is illustrated in Figure 3.
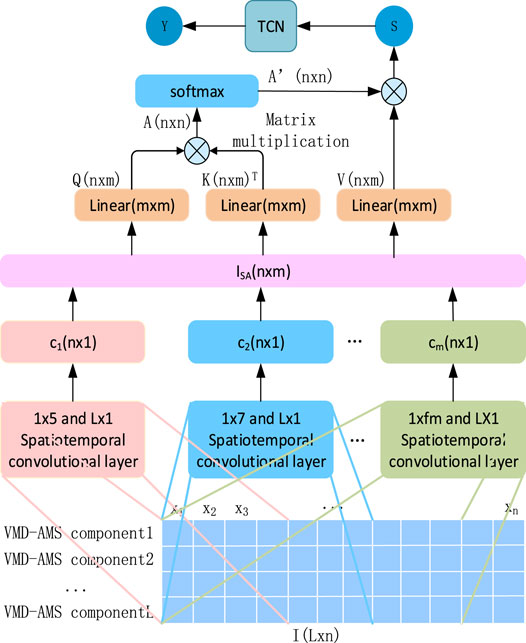
FIGURE 3. Structure of MSC-SA-TCN model.
ci is the output of MSC, expressed as follows:
where * is the convolution operation; ki is the layer i convolution kernel scale; L represents the number of input features; I1xki is the output of the VMD-AMS module;
Q,K,V of the attention mechanism part of the figure can be expressed as follows:
where W* and b* represent the weight matrix and bias matrix; then, the output of the MSC-SA module can be derived as follows:
For the cumulative error in the wind power multi-step prediction by traditional single TCN, an improved TCN model based on multiple outputs was proposed in this study. The specific structure of the model is shown in Figure 4. The model reduced the cumulative error in the wind power multi-step prediction using multi-channel TCN to extract the nonlinear mapping relationship between input and output of different prediction steps.
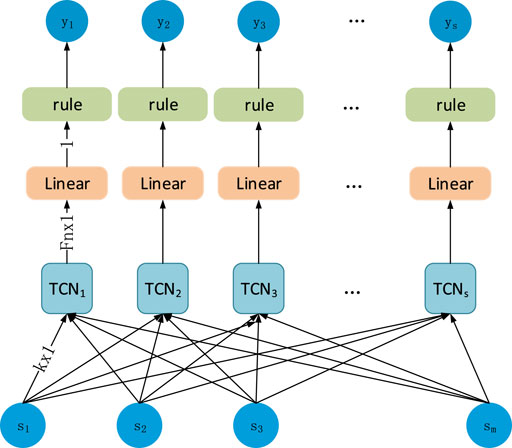
FIGURE 4. Multi-output TCN structure.
The input of the multi-output TCN model is the output S of MSC-SA with dimension kxm, and its individual output is expressed as TFnx1. Fn is the number of TCN filters, and the final output was obtained after linear transformation and Relu function, which can be expressed as follows:
where WFnx1,i, bi are the weights and biases of the predicted output at step i, respectively.
The MMED-TCN model was obtained using the multi-output TCN model as the decoding layer and using the MSC-SA model as the coding layer. The structure of the MMED-TCN model is given in Figure 5.
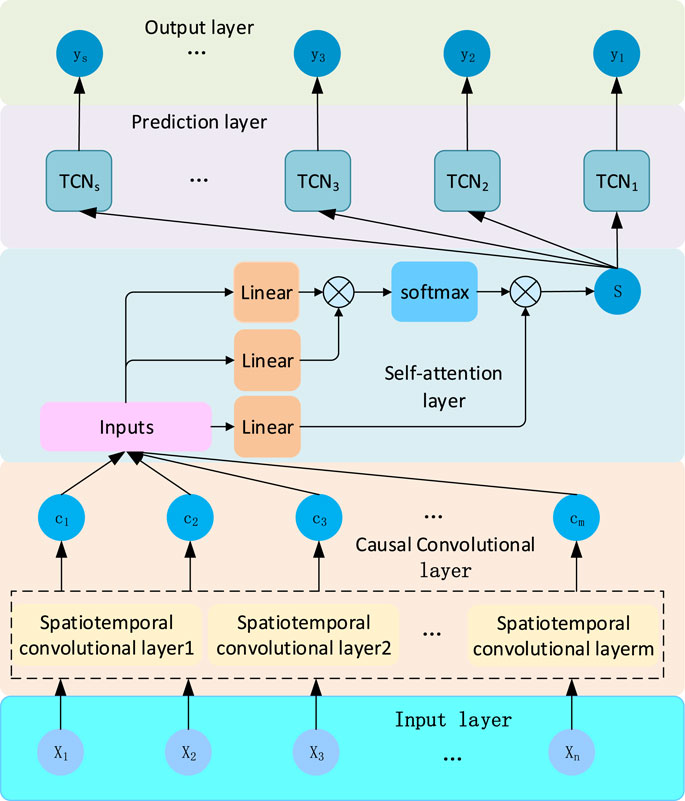
FIGURE 5. MMED-TCN model structure.
Based on the design of a multi-step prediction model with improved TCN, the algorithm flow of wind power multi-step prediction based on improved TCN to correct cumulative error proposed in this study is illustrated in Figure 6. The specific steps are elucidated as follows:
1) First, the input raw wind power sequence P was preprocessed, mainly including outlier processing (negative value, exceeding full power value and garbled code) and vacant value filling, and the wind power sequence after processing is expressed as P′.
2) Then, P′ was decomposed using VMD to obtain the principal component sequence IMFs= { IMF1, IMF2, ... ,IMFL-1} and the noise sequence E. The IMFL was obtained by smoothing E using AMS.
3) Next, the MSC-SA model was used to extract the temporal and spatial features of the IMFs series to obtain the output S.
4) Finally, the final prediction model was selected according to the number of prediction steps. The MSC-SA-TCN model was selected for the single-step prediction. The MMED-TCN model was selected for the multi-step prediction. The prediction results were evaluated.
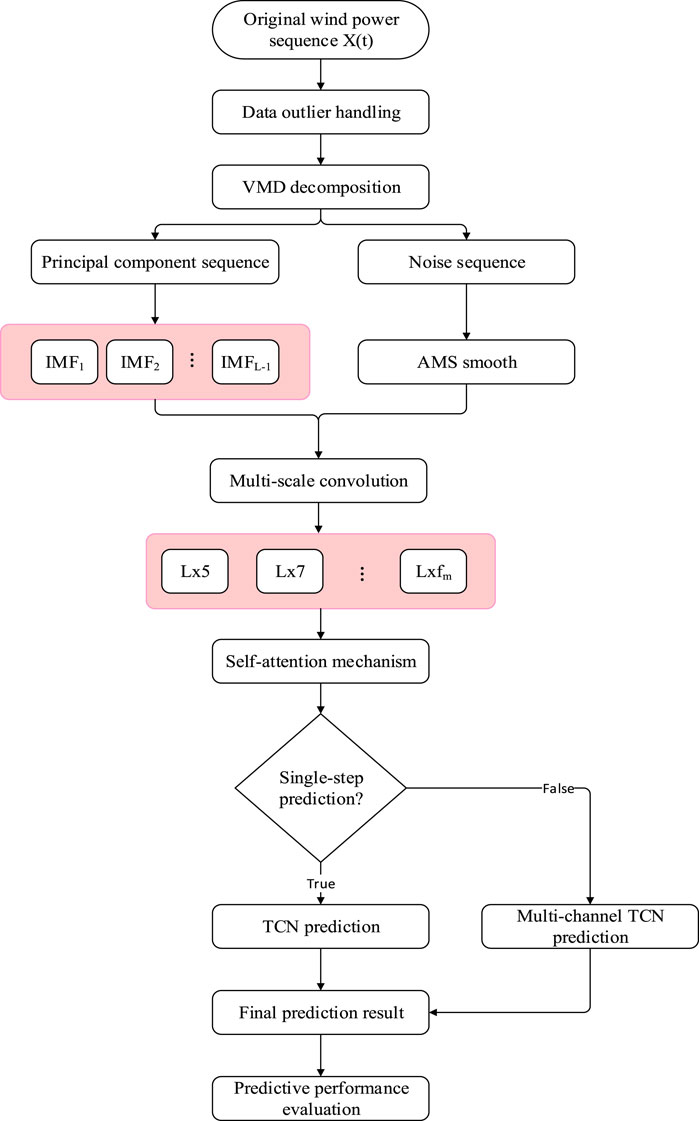
FIGURE 6. Algorithm flow.
The wind power data used in this study were obtained from the actual measurement data of the wind farms in Shuangzitai, Liaoning, and Kqi, Inner Mongolia, from December 2019 to October 2020, with a sampling interval of 15 min. Nearly 28,000 data pieces were available for each wind farm, and the first 10,000 were taken as the experimental data in this study, the first 80% of which acted as the training set and the last 20% as the test set.
The data employed in this study have negative, overfull, garbled, and vacant values. In this study, the negative values were processed by directly setting zero, and the wind power values before and after the two moments were used to correct or fill the overfull, garbled, and vacant values. Since the installed capacity of each wind power station was different, thereby causing the difference of its power generation, the experimental data were normalized to better assess the experimental results using the following:
In this study, six metrics were adopted to assess the performance of the model, i.e., Mean Absolute Error (MAE), Root Mean Squared Error (RMSE), MAE lift (PMAE), and RMSE lift (PRMSE) of the prediction results of the two models and MAE accumulation (AddeMAE,ij) and RMSE accumulation (AddeRMSE,ij) from i-step prediction to j-step prediction. The specific equations are expressed as follows:
where yi and
To verify the prediction effect of the single-step prediction model MSC-SA-TCN proposed in this study, five models in Table 1 were used for the experimental comparison in this section, and the parameter optimization of the mentioned models was not the focus of this study. For this reason, the main parameters of each model are listed directly in Table 1.
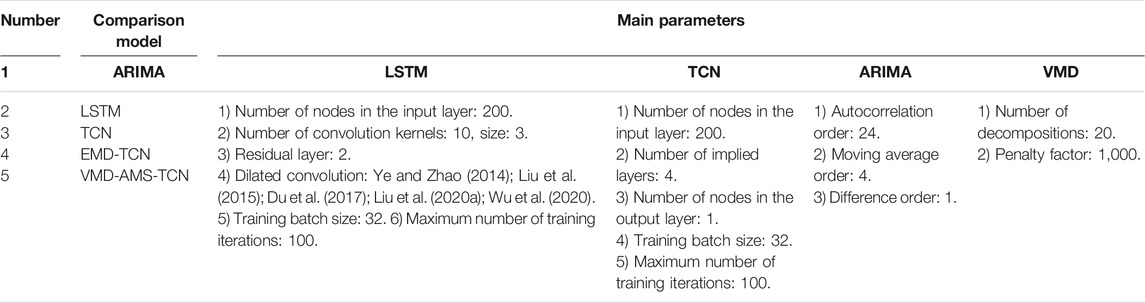
TABLE 1. Experimental comparison model and main parameters.
The VMD decomposition algorithm was adopted to decompose the processed wind power series P″ into 20 main components IMFs and 1 error component E. Subsequently, the AMS algorithm was employed to smooth the tracking of the error component E to determine the 21st IMF component. The results of the VMD decomposition and the AMS smoothing are presented in Figure 7 (the figure presents the results of 3, 6, 9, 12, 15, 18, 21, and so on for different IMFs components). As indicated from this figure, each component processed using the VMD-AMS algorithm was uniformly distributed in the frequency domain, and the reconstruction error was negligible below 0.005.
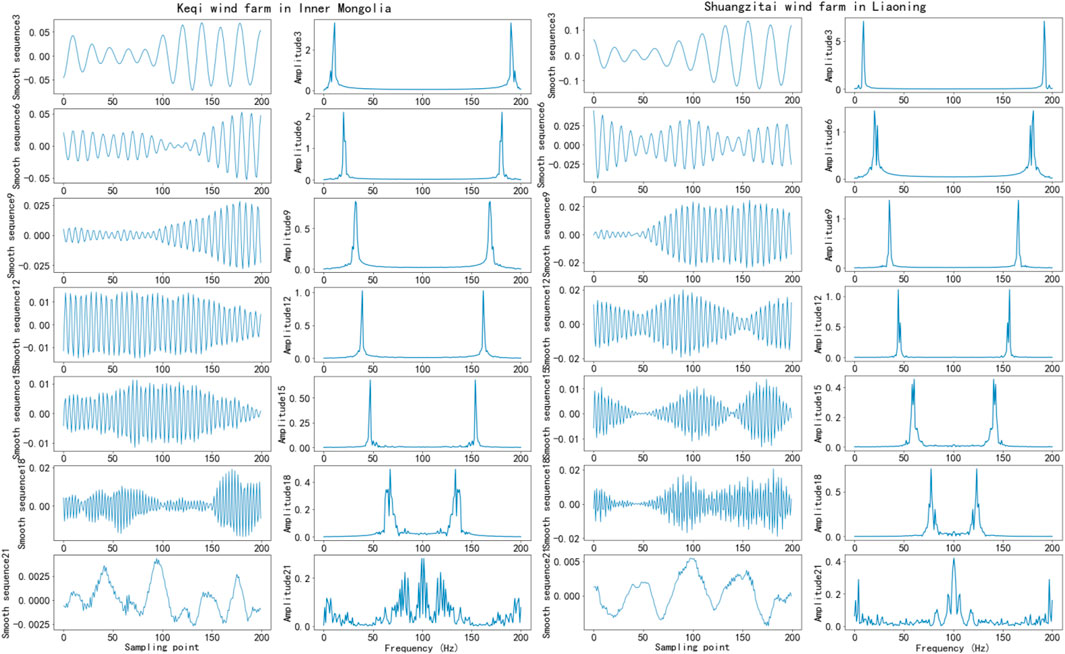
FIGURE 7. Experimental results of VMD-AMS algorithm.
In this study, three single models (i.e., ARIMA, LSTM, and TCN) were set for the comparative experimental analysis to verify the superiority of the TCN model in the wind power prediction. Next, two sets of hybrid models (i.e., EMD-TCN and VMD-AMS-TCN) were set for the comparative experimental analysis to verify the effectiveness of the VMD-AMS algorithm in improving the prediction accuracy. Experiments were performed for the proposed model MSC-SA-TCN and the other five models, respectively. The experimental results are illustrated in Figure 8, and the performance of various models under the evaluation metrics MAE and RMSE is listed in Table 2.
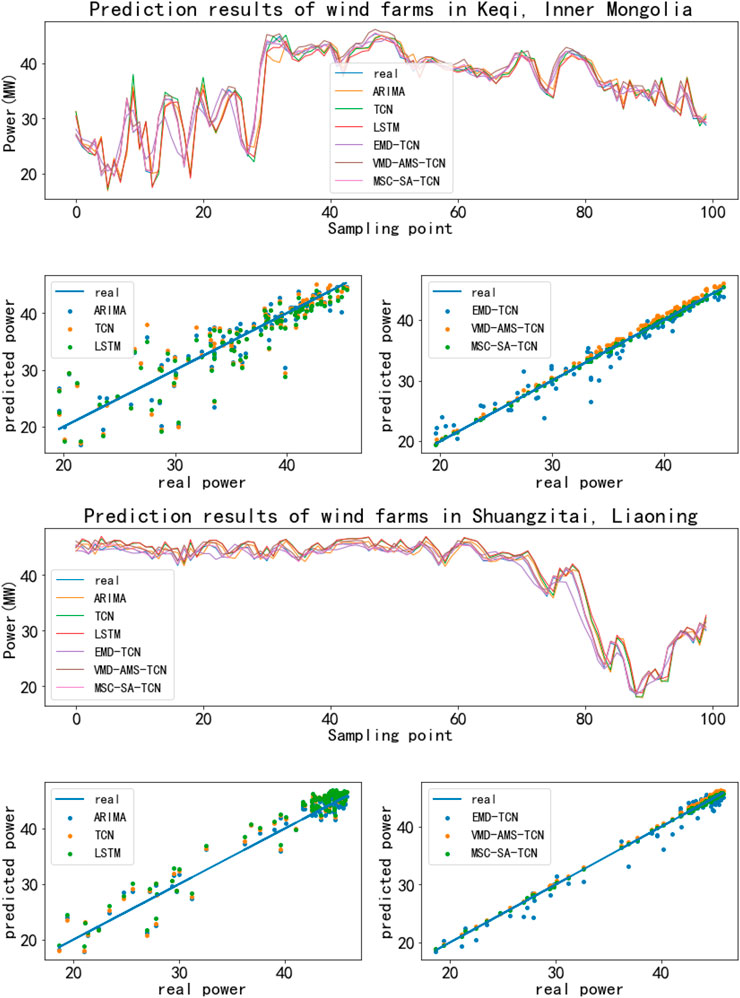
FIGURE 8. Experimental results of single-step wind power prediction.
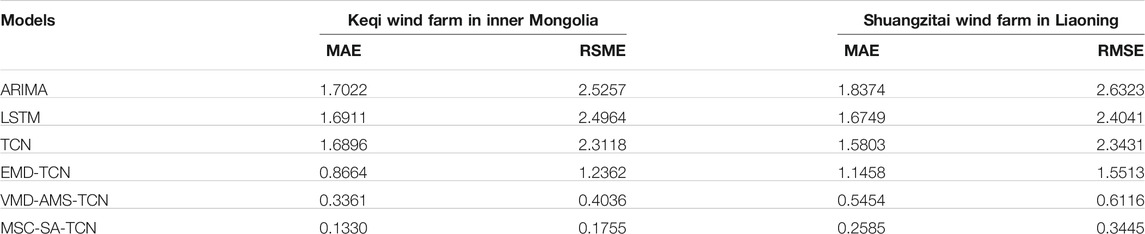
TABLE 2. Comparison of the performance of each prediction model for the two wind farm experiments.
As revealed from the comparison of the prediction experiments of the two wind farms in Table 2, the MAE of the single models (e.g., ARIMA, LSTM, and TCN) exceeded 1.5, and the RMSE reached over 2.0, aking the trend of wind power difficult to be accurately tracked. The main reason for this phenomenon was that the single prediction model exhibited relatively low sensitivity to the noise components in the wind power series. Among the single models, TCN performs slightly better than the other two single models in MAE and RMSE due to the introduction of causal null convolution. Thus, TCN was endowed with a wider field of perception compared with ARIMA and LSTM, and it was enabled to more effectively obtain the temporal characteristics of the wind power series. Compared with the single model, EMD-TCN and VMD-AMS-TCN models significantly improved their performance in MAE and RMSE. The introduction of EMD and VMD-AMS could effectively separate the noise signals, reduce the effect of noise signals on the prediction accuracy, and increase the prediction accuracy. The prediction performance of the VMD-AMS-TCN model was better than that of the EMD-TCN model. The prediction performance of the MSC-SA-TCN model proposed in this study was better than that of the other models, where the MAE was less than 0.3 and the RMSE was less than 0.4.
To further verify the prediction performance improvement of the proposed MSC-SA-TCN model compared with other models in this study, the performance improvement of the MSC-SA-TCN model is given in Table 3.
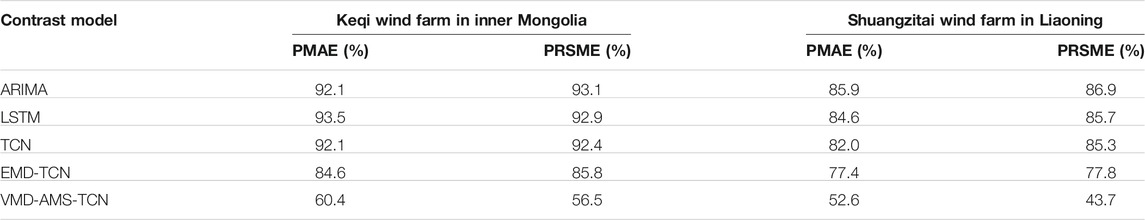
TABLE 3. Comparison of the performance improvement of the experimental MSC-SA-TCN model for two wind farms.
According to Table 3, the proposed MSC-SA-TCN model in this study improved more than 50% in MAE and more than 40% in RMSE. The average improvement in MAE compared with other models was 80.1%. The average improvement in RMSE reached 80%. The MAE and RMSE predictors of the MSC-SA-TCN model were significantly improved.
To verify the prediction stability of the MSC-SA-TCN model proposed in this study, ten comparison experiments were performed using the VMD-AMS-TCN model and the MSC-SA-TCN model for the Nemengkchi wind farm, and the experimental results are shown in Figure 9. The MAE and RMSE of the MSC-SA-TCN model fluctuated from 0.1 to 0.3, while those of the VMD-AMS-TCN model fluctuated from 0.3 to 0.7 and 0.4 to 0.8, respectively. The fluctuation ranges of the MAE and RMSE of the MSC-SA-TCN model were smaller than those of the MAE and RMSE.
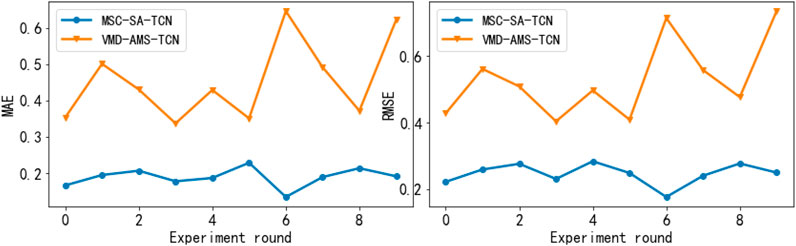
FIGURE 9. Comparison of prediction stability among models.
The MMED-TCN wind power multi-step prediction model proposed in this study reduces the cumulative error of the wind power multi-step rolling prediction using the multi-channel TCN technique. To verify the effectiveness of the MMED-TCN model in reducing the cumulative error, the VMD-AMS-TCN and MSC-SA-TCN models were employed to compare the 2-step and 5-step predictions with the MMED-TCN model under two wind farms, where the VMD-AMS-TCN and MSC-SA-TCN models were used for rolling prediction. The experimental results are presented in Figure 10, and the performance comparison of the respective model is listed in Table 4.
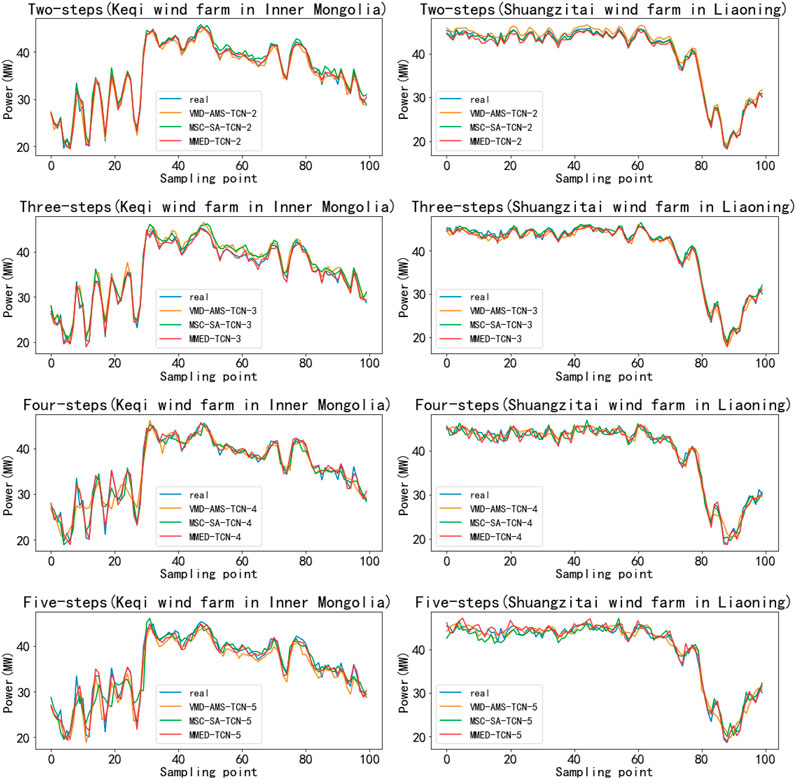
FIGURE 10. Multi-step wind power prediction experimental results.
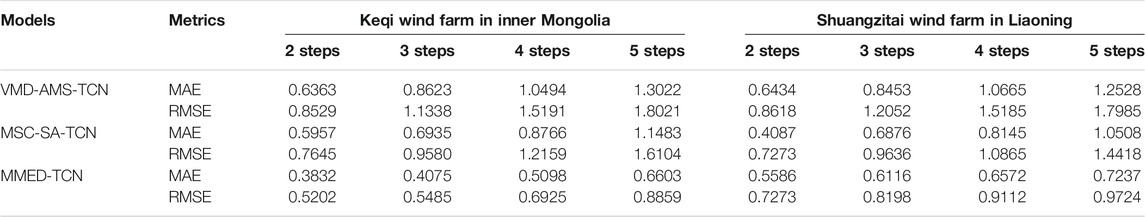
TABLE 4. Comparison of the performance of each prediction model for the two wind farm experiments.
According to Table 4, the 2-step and 5-step wind power prediction results of the MMED-TCN model proposed in this study were better than those of the VMD-AMS-TCN and MSC-SA-TCN models overall under the MAE and RMSE evaluation metrics. To verify whether the MMED-TCN model could effectively reduce the cumulative error in the multi-step prediction, the comparison of the cumulative error of each model is listed in Table 5.
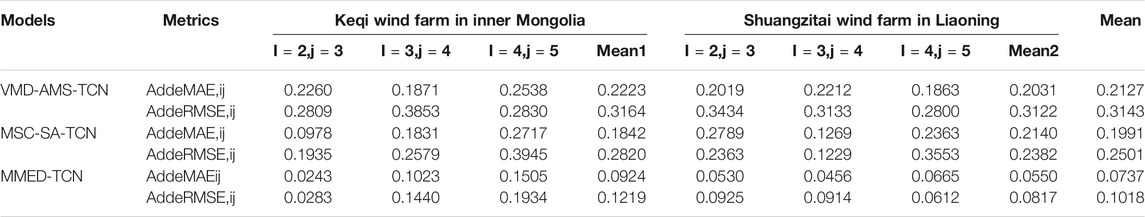
TABLE 5. Comparison of error accumulation of each prediction model for the two wind farm experiments.
As indicated from Table 5, the MMED-TCN model proposed in this study could effectively reduce the cumulative error in the multi-step prediction, from 2-step prediction to 5-step prediction. Its AddeMAE,ij was less than 0.16, and its mean value was 0.0737, which was better than 0.2127 of the VMD-AMS-TCN model and 0.1991 of the MSC-SA-TCN model. Its AddeRMSE ,ij was less than 0.2, and the mean value was 0.1018, which was better than 0.3143 of the VMD-AMS-TCN model and 0.2501 of the MSC-SA-TCN model. To elucidate the effect of the MMED-TCN model in reducing the cumulative error of the multi-step prediction, the histogram of the cumulative error index of each model is presented in Figure 11. According to Figure 11, the MMED-TCN model outperformed both the VMD-AMS-TCN model and the MSC-SA-TCN model in terms of AddeMAE,ij and AddeRMSE,ij. The effectiveness of the MMED-TCN model in reducing the multi-step prediction error was further verified.
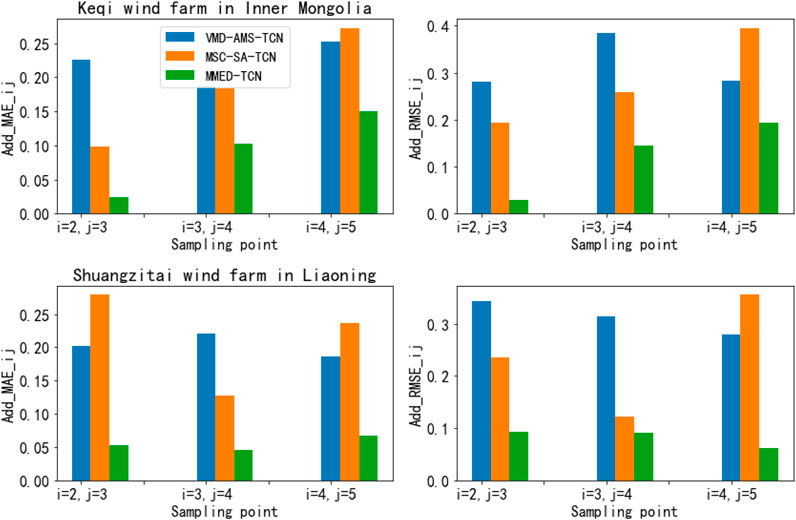
FIGURE 11. Histogram of error accumulation index of each model.
To cope with the cumulative error in the wind power multi-step prediction, a wind power multi-step prediction method based on improved TCN to correct the cumulative error was proposed in this study. The MMED-TCN multi-step wind power prediction model was built by optimizing the TCN single-scale convolution kernel and single input-output mapping relationship. Based on the model, several experiments were performed on the actual measured data of Liaoning Shuangzitai wind farm and Inner Mongolia Keqi wind farm. The following conclusions could be drawn based on the experimental results.
1) The MSC-SA-TCN model can effectively fix the ability of the TCN’s single-scale convolution kernel for input sequence feature extraction and improve the prediction accuracy and stability of the model by extracting the temporal and spatial features of the input sequence at different scales by MSC-SA. The MAE and the RMSE of the MSC-SA-TCN model decrease by 0.2450 and 0.2476 on average in the single-step prediction, respectively, compared with those of the VMD-AMS-TCN model.
2) The MMED-TCN model is capable of effectively fixing the ability of a single TCN to mine the mapping relationship between multiple inputs and multiple outputs, reducing the effect of the previous step prediction error on the prediction using the multi-channel TCN technique, and effectively reducing the cumulative error of the multi-step rolling prediction. In the multi-step wind power prediction, its MAE cumulative mean value reaches 0.0737, and the RMSE cumulative mean value is 0.1018, better than those of other models.
3) The MMED-TCN model introduced in this study can effectively reduce the cumulative error of the multi-step prediction of wind power. Since the PV power series exhibits similar characteristics with the wind power series, the MMED-TCN model can be adopted to reduce the cumulative error of the multi-part prediction of PV power in the future.
The datasets presented in this article are not readily available because the data comes from the provincial dispatch company, it was non-public data. Requests to access the datasets should be directed to corresponding author XD, ZHhuanV0QG5qdGVjaC5lZHUuY24=. Additional data from the article can be found in the Supplementary Material.
HL built the models, analyzed the experiments, and wrote the manuscript. XD provided guidance in writing and revised the manuscript. RS and SW contributed to the writing.
This work was funuded by the State Grid Jiangsu Electric Power Co., Ltd., Research Institute under the Science and Technology Project “Technology Foundation of SGCC (State Grid Jiansu Electric Power Co. Ltd. Research Institute's high-precision power prediction research service based on the spatio-temporal evolution law of new energy power.”
Authors RS and SW were employed by company State Grid Jiangsu Electric Power Co. Ltd. Research Institute.
The remaining authors declare that the research was conducted in the absence of any commercial or financial relationships that could be construed as a potential conflict of interest.
The authors declare that this study received funding from State Grid Jiangsu Electric Power Co. Ltd. Research Institute. The funder had the following involvement in the study: interpretation of data.
All claims expressed in this article are solely those of the authors and do not necessarily represent those of their affiliated organizations, or those of the publisher, the editors and the reviewers. Any product that may be evaluated in this article, or claim that may be made by its manufacturer, is not guaranteed or endorsed by the publisher.
The authors acknowledge the State Grid Jiangsu Electric Power Co., Ltd., Research Institute and Nanjing TECH University for their feasibility research support.
The Supplementary Material for this article can be found online at: https://www.frontiersin.org/articles/10.3389/fenrg.2021.723319/full#supplementary-material
Bai, S. J., and Koltun, V. (2018). An Empirical Evaluation of Generic Convolutional and Recurrent Networks for Sequence Modeling. arXiv pre-print server.
Cao, J., Zhou, R., Deng, X., Fan, W., Liu, L., and Sun, J. (2019). Wind Power Prediction Considering the Differential Times of Optimized ARIMA Model[J]. J. Power Syst. their Automation 31 (01), 105–111. doi:10.3969/j.issn.1003-8930.2019.01.017
Cassola, F., and Burlando, M. (2012). Wind Speed and Wind Energy Forecast through Kalman Filtering of Numerical Weather Prediction Model Output. Appl. Energ. 99 (6), 154–166. doi:10.1016/j.apenergy.2012.03.054
Catalao, J. P. S., Pousinho, H. M. I., and Mendes, V. M. F. (2010). Hybrid Wavelet-PSO-ANFIS Approach for Short-Term Wind Power Forecasting in Portugal. IEEE Trans. Sustain. Energ. 2 (1), 1949–3029. doi:10.1109/TSTE.2010.2076359
Chen, N., Xue, Y. S., Ding, J., Chen, Z. L., Wang, W. Z., and Wang, N. B. (2017). Ultra-short-term Wind Speed Prediction Using Spatial Correlation[J]. Power Syst. Automation 41 (12), 124–130. doi:10.7500/AEPS20160914002
Chung, J., Gülçehre, Ç., Cho, K., and Bengio, Y. (2014). Empirical Evaluation of Gated Recurrent Neural Networks on Sequence Modeling [J]. IEICE Trans. Fundamentals Electron. Commun. Comput. Sci. abs/1412.3555.
De Giorgi, M. G., Ficarella, A., and Tarantino, M. (2011). Error Analysis of Short Term Wind Power Prediction Models. Appl. Energ. 88 (4), 1298–1311. doi:10.1016/j.apenergy.2010.10.035
Drdgomiretskiy, K., and Zosso, D. (2013). Variational Mode Decomposition [J]. IEEE Transactions Signal. Processing 62 (3), 531–544. doi:10.1109/TSP.2013.2288675
Du, P., Wang, J., Guo, Z., and Yang, W. (2017). Research and Application of a Novel Hybrid Forecasting System Based on Multi-Objective Optimization for Wind Speed Forecasting. Energ. Convers. Manage. 150, 90–107. doi:10.1016/j.enconman.2017.07.065
Han, Z., Jing, Q., Zhang, Y., Bai, R., Guo, K., and Zhang, Y. (2019). A Review of Wind Power Forecasting Methods and New Trends[J]. Power Syst. Prot. Control. 47 (24), 178–187. doi:10.19783/j.cnki.pspc.190128
Hochreiter, S., and Schmidhuber, J. (1997). Long Short-Term Memory. Neural Comput. 9 (8), 1735–1780. doi:10.1162/neco.1997.9.8.1735
Lahouar, A., and Ben Hadj Slama, J. (2017). Hour-Ahead Wind Power Forecast Based on Random Forests. Renew. Energ. 109, 529–541. doi:10.1016/j.renene.2017.03.064
Li, B., Zhang, Y., and Shi, L. (2018). Research on Short-Term Wind Speed Prediction Based on LSTM[J]. Computer Simulation 35 (11), 456–461. doi:10.3969/j.issn.1006-9348.2018.11.099
Li, C., Tang, G., Xue, X., Saeed, A., and Hu, X. (2020). Short-Term Wind Speed Interval Prediction Based on Ensemble GRU Model. IEEE Trans. Sustain. Energ. 11, 1370–1380. doi:10.1109/TSTE.2019.2926147
Lin, Y., and Liu, P. (2011). Short-Term Wind Power Portfolio Prediction Model Based on Empirical Modal Decomposition and Support Vector Machine[J]. Chin. J. Electr. Eng. 31 (31), 102–108. doi:10.13334/j.0258-8013.pcsee.2011.31.014
Liu, A-G., Xue, Y-T., Hu, J-L., and Liu, L-P. (2015). Ultra-Short-Term Prediction of Wind Power Based on GA Optimized SVM[J]. Power Syst. Prot. Control. 43 (02), 90–95. doi:10.7667/j.issn.1674-3415.2015.02.014
Liu, H., Mi, X., and Li, Y. (2018). Smart Multi-Step Deep Learning Model for Wind Speed Forecasting Based on Variational Mode Decomposition, Singular Spectrum Analysis, LSTM Network and ELM. Energ. Convers. Manage. 159, 54–64. doi:10.1016/j.enconman.2018.01.010
Liu, S., Zhu, Y., Zhang, K., and Gao, J. (2020). Short-term Wind Power Forecasting Based on Error-Corrected ARMA-GARCH Model[J]. J. Solar Energ. 41 (10), 268–275. doi:10.1016/j.apenergy.2019.114137
Liu, Y., and Liu, L. (2021). Wind Power Prediction Based on LSTM-CNN Optimization [J]. Scientific J. Intell. Syst. Res. 3 (4), 277–285.
Liu, Z., Jiang, P., Zhang, L., and Niu, X. (2020). A Combined Forecasting Model for Time Series: Application to Short-Term Wind Speed Forecasting[J]. Appl. Energ. 259, 114137. doi:10.1016/j.apenergy.2019.114137
Louka, P., Galanis, G., Siebert, N., Kariniotakis, G., Katsafados, P., Pytharoulis, I., et al. (2008). Improvements in Wind Speed Forecasts for Wind Power Prediction Purposes Using Kalman Filtering. J. Wind Eng. Ind. Aerodynamics 96 (12), 2348–2362. doi:10.1016/j.jweia.2008.03.013
Tascikaraoglu, A., and Uzunoglu, M. (2014). A Review of Combined Approaches for Prediction of Short-Term Wind Speed and Power. Renew. Sustain. Energ. Rev. 34, 243–254. doi:10.1016/j.rser.2014.03.033
Wang, L., Dong, L., and Gao, D. (2015). Short-Term Prediction of Wind Power Based on Multi-Position NWP with Principal Component Analysis[J]. J. Electr. Eng. Technol. 30 (05), 79–84. doi:10.19595/j.cnki.1000-6753.tces.2015.05.010
Wang, R., Li, C., Fu, W., and Tang, G. (2020). Deep Learning Method Based on Gated Recurrent Unit and Variational Mode Decomposition for Short-Term Wind Power Interval Prediction. IEEE Trans. Neural Netw. Learn. Syst. 31 (10), 3814–3827. doi:10.1109/tnnls.2019.2946414
Wang, S., Jiang, X., Zeng, L., and Chang, Y. (2020). Ultra-Short-Term PV Power Prediction Based on VMD-DESN-MSGP Model[J]. Power Grid Technol. 44 (03), 917–926. doi:10.1109/TNNLS.2019.2946414
Wang, Y., Wang, J., and Wei, X. (2015). A Hybrid Wind Speed Forecasting Model Based on Phase Space Reconstruction Theory and Markov Model: A Case Study of Wind Farms in Northwest China. Energy 91, 556–572. doi:10.1016/j.energy.2015.08.039
Wu, Q., Lu, Y., Wang, Z., and Zhou, Q. (2017). Probabilistic Wind Power Prediction Methods and Prospects[J]. Power Syst. Automation 41 (18), 167–175. doi:10.7500/AEPS20160914002
Wu, Z., Xia, X., Xiao, L., and Liu, Y. (2020). Combined Model with Secondary Decomposition-Model Selection and Sample Selection for Multi-step Wind Power Forecasting[J]. Appl. Energ. 261 (4), 114345. doi:10.1016/j.apenergy.2019.114345
Wu, Z., Zhao, X., Ma, Y., and Zhao, X. (2019). A Hybrid Model Based on Modified Multi-Objective Cuckoo Search Algorithm for Short-Term Load Forecasting. Appl. Energ. 237, 896–909. doi:10.1016/j.apenergy.2019.01.046
Ye, L., and Zhao, Y. (2014). A Review of Research on Wind Power Prediction Based on Spatial Correlation[J]. Power Syst. Automation 38 (14), 126–135. doi:10.7500/AEPS20130911004
Keywords: improved TCN, cumulative error, multi-step wind power prediction, self-attentiveness, multi-scale convolution
Citation: Luo H, Dou X, Sun R and Wu S (2021) A Multi-Step Prediction Method for Wind Power Based on Improved TCN to Correct Cumulative Error. Front. Energy Res. 9:723319. doi: 10.3389/fenrg.2021.723319
Received: 10 June 2021; Accepted: 03 August 2021;
Published: 14 September 2021.
Edited by:
Dazhong Ma, Northeastern University, ChinaReviewed by:
Xin Fang, National Renewable Energy Laboratory (DOE), United StatesCopyright © 2021 Luo, Dou, Sun and Wu. This is an open-access article distributed under the terms of the Creative Commons Attribution License (CC BY). The use, distribution or reproduction in other forums is permitted, provided the original author(s) and the copyright owner(s) are credited and that the original publication in this journal is cited, in accordance with accepted academic practice. No use, distribution or reproduction is permitted which does not comply with these terms.
*Correspondence: Xun Dou, ZHhuanV0QG5qdGVjaC5lZHUuY24=
Disclaimer: All claims expressed in this article are solely those of the authors and do not necessarily represent those of their affiliated organizations, or those of the publisher, the editors and the reviewers. Any product that may be evaluated in this article or claim that may be made by its manufacturer is not guaranteed or endorsed by the publisher.
Research integrity at Frontiers
Learn more about the work of our research integrity team to safeguard the quality of each article we publish.