- Department of Agricultural and Biosystems Engineering, Iowa State University, Ames, IA, United States
With the rapid development of the ethanol industry over the past few decades, research on distillers dried grains with solubles (DDGS), its main coproduct, has increased in recent years. However, research about the basic properties of DDGS lacks comprehensiveness. This study examined 16 DDGS samples from 10 ethanol plants in the Midwest U.S., and used standard laboratory methods to measure a series of physical and flowability properties. Results showed an average moisture content of 8.69% (w. b.), water activity of 0.55, angle of repose of 48.04°, shear strength of 0.0324 kg/cm2, geometric mean diameter (dgw) of 0.74 mm, geometric standard deviation (Sgw) of 1.72 mm, loose bulk density of 483.9 kg/m3, packed bulk density of 568.5 kg/m3, Hunter L of 56.71, Hunter a of 13.85, and Hunter b of 46.51. This study represents a step toward a more complete understanding of DDGS, and how various properties change as production practices evolve in the ethanol industry.
Introduction
With increased demand for fossil fuels over the past several decades, bio-based ethanol has been increasing being used as a fuel additive is increasingly being used to expand existing fuel supplies (Schnepf and Yacobucci, 2013). Conversion of corn to ethanol is widespread in the U.S. Ethanol industry and has increased rapidly in recent years. In 2020 the United States was the top fuel ethanol producer in the world (RFA, 2020), with capacity to produce more than 15 billion U.S. gallons (57 billion Liters). According to Rosentrater (2006), more than 95% of U.S. fuel ethanol plants use corn as a major raw material to produce ethanol.
Corn-based fuel manufacturing has three main products: ethanol, carbon dioxide, and distillers grains (often distillers dried grains with solubles (DDGS), but also distillers wet grains and other coproducts). Of all coproducts, DDGS is arguably the most important, as its production and sale is vital to the financial viability and sustainability of dry grind plants. DDGS is sold at a varying market price (typically US$85–140 per ton) (Liu, 2008), but that price can fluctuate and achieve levels over US$300 per ton.
Physical properties of DDGS have a major influence on storage, transport, and material handling operations. Key properties include particle size, loose bulk density, packed bulk density, and angle of repose; these influence how much of the product can be stored in a given volume (Ileleji and Rosentrater, 2008). Moisture content, water activity, and shear strength affect the storability, flowability, and material milling properties of DDGS particles. Large variations in these physical properties have been reported by different research groups over the years (Rosentrater, 2006; Ileleji et al., 2007; Rosentrater, 2007; Ganesan et al., 2008b; Rosentrater, 2011).
Particle size distribution (which is often summarized by geometric mean and geometric standard deviation) is a critically important property, as it affects many of the other physical properties. For example, by using a series of six nested sieves (Nos. 8, 12, 18, 35, 60, and 100), Liu (2008) measured changes in surface color, moisture, protein, oil, ash and starch in both original samples and sieved fractions. Results showed substantial variations in composition and color among DDGS fractions from different plants. Further, it may be feasible to fractionate DDGS for compositional enrichment based on particle size, which could increase the quality and nutrient composition of DDGS fractions.
Clementson and Ileleji (2012) measured morphological and chemical characteristics of DDGS by mixing three different levels of condensed distillers solubles (CDS) with distillers wet grains and drying according to official methods (AOAC, 2002). Results showed that pore volume, particle porosity, and bulk porosity decreased when CDS level increased; furthermore, they observed that heterogeneity and particle segregation could affect nutrient and bulk density values.
Bulk density, another key property, directly impacts storability as well as shipping logistics (Ileleji et al., 2008). Clementson and Ileleji (2010) designed a simulated apparatus to investigate bulk density variability of DDGS during filling of railcar hoppers, and found significant differences between the initial and final values of bulk density and particle size as the hoppers were emptied, which was caused by particle size variations.
In addition to these above observations, drying of distillers wet grains (DWG) and CDS to produce DDGS will impact the resulting nutritive values and physical characteristics. Kingsly (2010) tested four properties to see how they were affected by the drying process: particle size, particle size distribution, particle bulk density and color. All four were found to be affected by drying conditions used at ethanol plants.
Though research has been done on the physical and flow properties of DDGS over the years (; Rosentrater, 2007; Ganesan et al., 2008b), and these have been compiled into a formal engineering standard (ASABE, 2020), production processes have been changing in recent years (for example, oil is now commonly removed at most ethanol plants). Thus, new baseline data on these properties needs to be established since they are essential for the design of material handling and processing equipment, facilities, and storage systems (Rosentrater, 2011). The objective of this study was to investigate several physical and flow properties of DDGS, including moisture content, water activity, angle of repose, shear strength, particle size, loose bulk density, packed bulk density, and color, using samples from ten dry grind corn ethanol facilities in the Midwestern U.S.
Materials and Methods
Materials
Sixteen DDGS samples were supplied by ten dry grind corn ethanol facilities located in the Midwestern U.S.; these were labeled by origin as 1, 2, 3, 4, 5, 6, 7, 8, 9, and 10, to ensure anonymity. All ethanol plants used state of the art processing equipment, technologies, and ingredients common in the fuel ethanol industry. All plants utilized U.S. No. 2 yellow corn as a fermentation substrate. All samples were collected from corn ethanol plants (three unique samples from each of two plants, two unique samples from each of two plants, and one unique sample from each of six plants); these were stored at room temperature (24 ± 1°C) in sealed plastic storage bags. All properties were subsequently measured at room temperature (except moisture content) and the study employed a completely randomized design.
Methods
Moisture content was measured following the standard Forage Analysis Procedure (NFTA, 2002) using a forced-convection laboratory oven (Thermo OGH and OMH180, Scientific Heratherm, Langenselbold, Germany) at 105°C for 3 hours. Water activity was measured using a calibrated water activity meter (AquaLab series 3 TE, Decagon Devices, Pullman, WA, United States). Angle of repose was determined by allowing DDGS to fall onto a 15.5 cm × 15.5 cm plate in a Helle-Shaw cell following the method described by Tscheuschner (1987), a photo was taken with a digital camera, and the angle was then measured using ImageJ software. Shear strength was tested using a torvane shear device (26–2,261, ELE International, Loveland, CO, United States) following the procedures described by Goossens and Zimbone (Zimbone et al., 1996; Goossens, 2004). Particle size was measured according to ANSI/ASABE S319.3 (ASABE Standards, 2004), using U.S. sieve nos. 6 (3.36 mm), 8 (2.38 mm), 10 (2.00 mm), 14 (1.680 mm), 16 (1.19 mm), 20 (0.841 mm), 30 (0.595 mm), 40 (0.420 mm), 50 (0.297 mm), 70 (0.210 mm), and pan (0.044 mm). From the weight of DDGS collected on each sieve, the geometric mean diameter (dgw) and geometric standard deviation (Sgw) were calculated. Bulk density of DDGS was measured using a filling hopper, stand, and 1 L cup (Seedburo 151, Seedburo Equipment Co, Chicago, IL, United States) following the method described by USDA (1999). Color was measured using a spectrocolorimeter (LabScan XE 16807, Hunter Associates Laboratory, Reston, VA, United States) and the L-a-b opposable color scales (Hunter Associates Laboratory, Reston, VA, United States) (HAL, 2002).
Data Treatment and Statistical Analysis
All collected data were analyzed using Microsoft Excel 2010 (Microsoft Corp, Redmond, WA, United States) and SAS Enterprise 4.3 software (SAS Institute, Cary, NC, United States). Summary statistics (means and standard deviations) and analysis of variance (ANOVA, to test for differences amongst processing plants) were performed for each property to determine whether significant differences existed, using a Type I (α) error rate of 0.05; if so, post-hoc LSD tests were then conducted using a 95% confidence level to determine where those differences occurred.
Results and Discussion
Table 1 summarizes the DDGS properties measured in this study, including minimum, maximum, mean values, and standard deviations for each property, for each individual plant, as well as overall. Statistically significant differences were often found between samples of the same plant, and amongst samples from different plants. Most properties exhibited large variations, which support findings of other prior studies (Rosentrater, 2006; Rosentrater and Muthukumarappan, 2006; Ileleji et al., 2007). These property differences are often relics of processing differences, including fermentation conditions, syrup addition rate vs. wet cake flow rate, type of dryer, drying conditions, and cooling conditions.
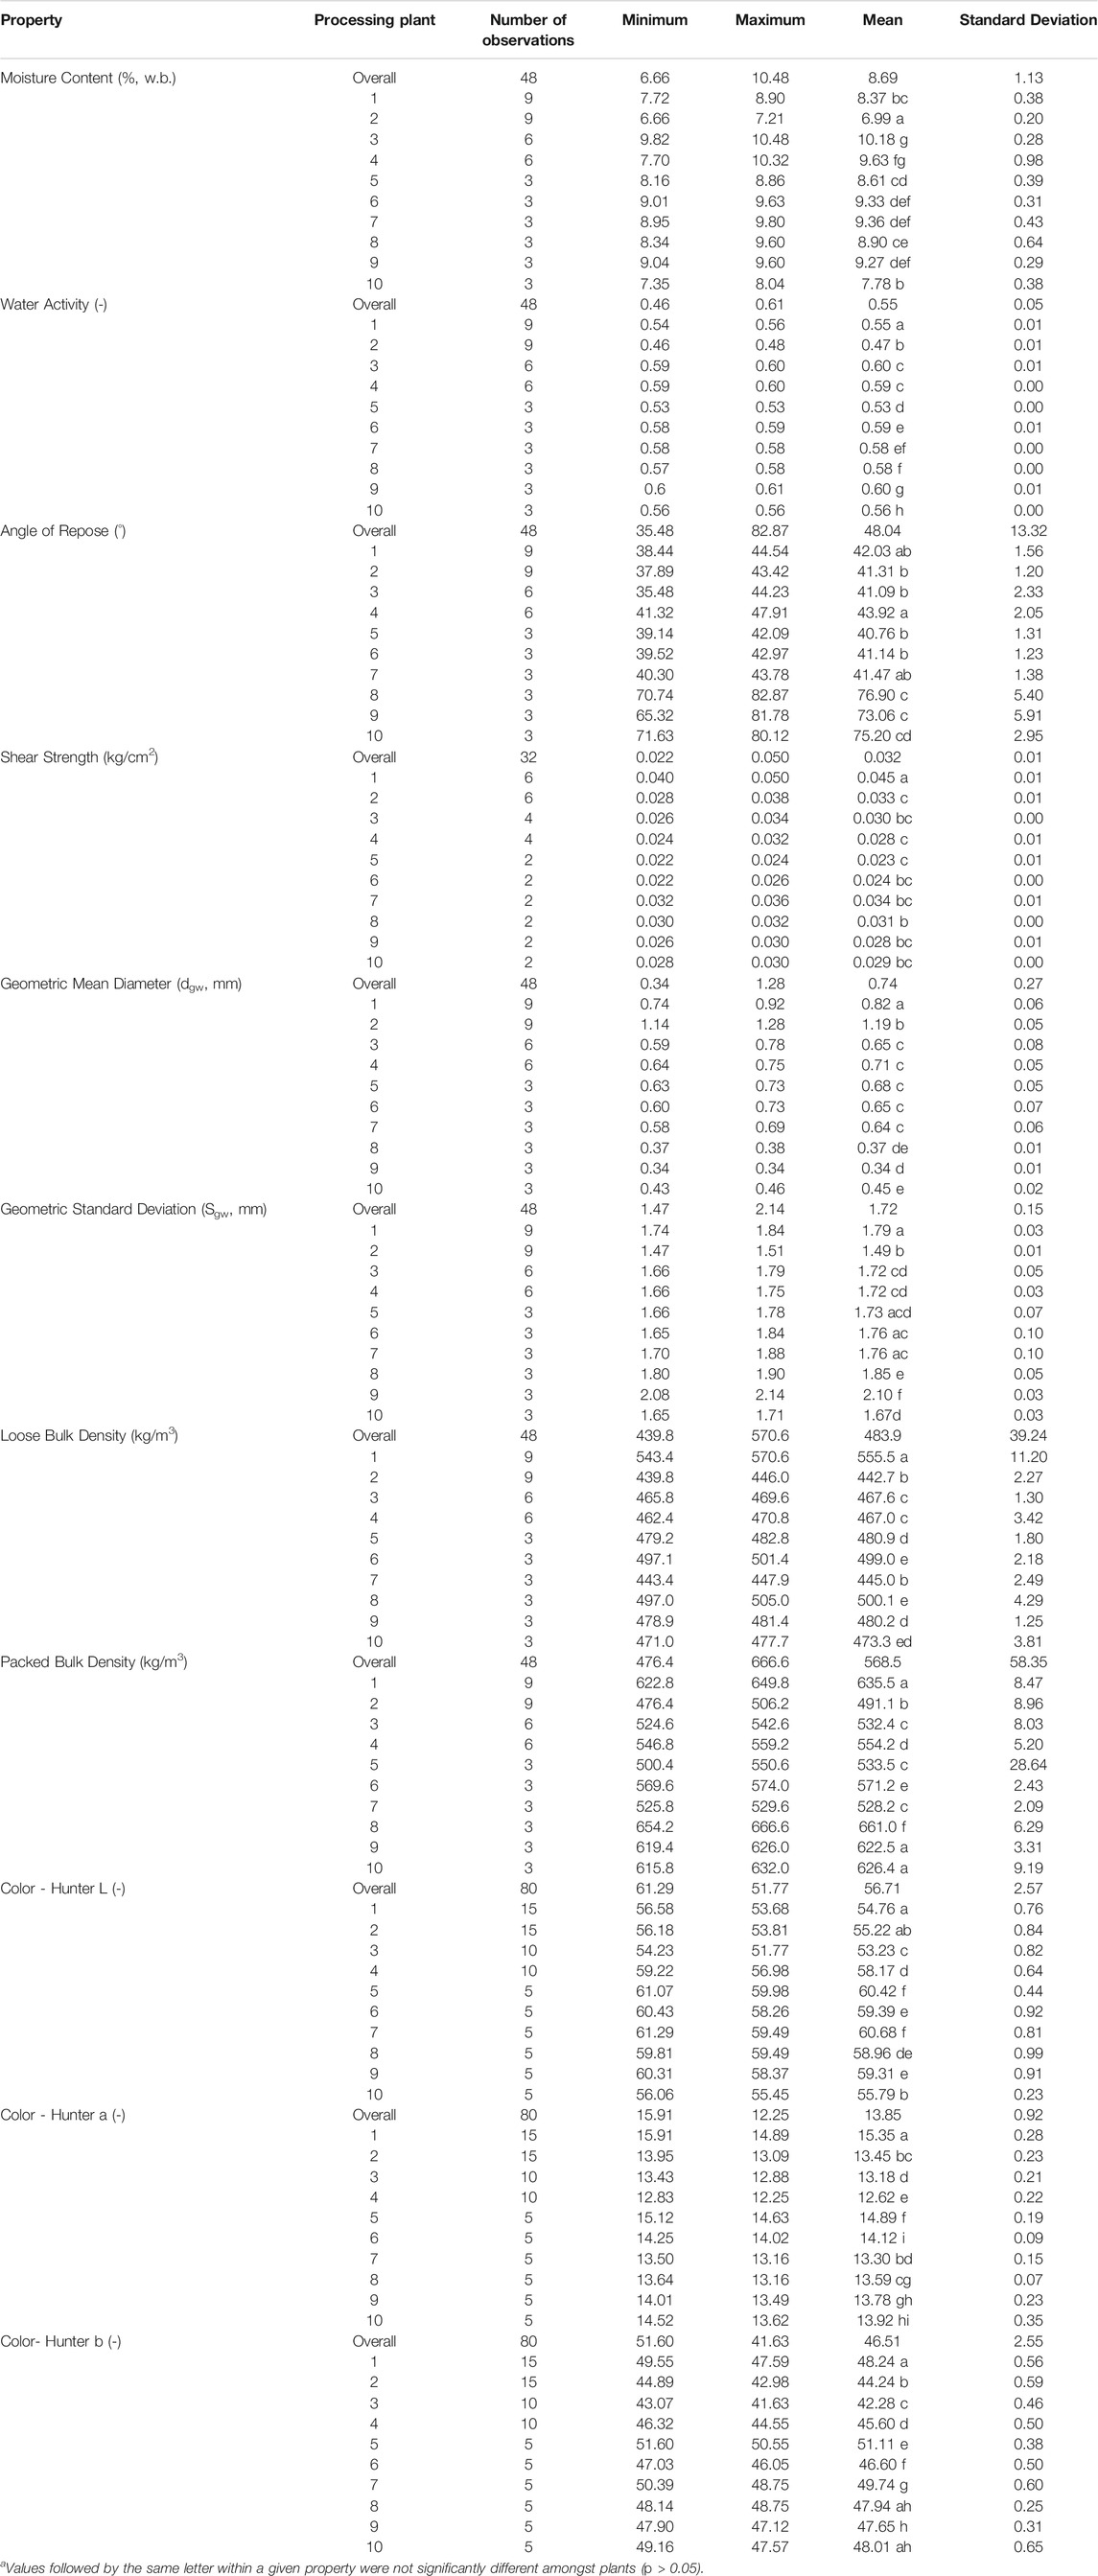
TABLE 1. Physical and flow properties of distillers dried grains with solubles (DDGS).a
Moisture and Water Activity
As shown in Table 1, the samples ranged in moisture content from 6.66 to 10.48% (w.b.–wet basis), with a mean of 8.69%. After converting to dry basis (d.b.), the results ranged from 7.13 to 11.71%, with a mean of 9.52% (not shown in table). Thus results indicate that these DDGS samples were well suited for storage because the minimum moisture content for most microbial growth in corn and related products is 13.5% (d.b.) (Beauchat, 1981). In addition, the moisture content data found in this study generally fell within the results of Rosentrater and Bhadra (Rosentrater, 2006; Bhadra et al., 2009), and were similar to results of Kingsly and Spiehs (Spiehs et al., 2002; Kingsly et al., 2010). The reasons for these differences likely are caused by the method of producing DDGS at the ethanol plants.
Overall, the DDGS samples in this study had a low water activity, ranging from 0.46 to 0.61. These results are very similar to those found in previous work (Rosentrater, 2006). Water activity is a measure of the energy status of the water in a system and it directly affects the activity of microbes. Prezant (2007) has shown that most bacteria are adapted for growing in an environment with a water activity of 0.9, mold is adapted to between 0.7 and 0.8, yeast is adapted to greater than 0.7, but very little microbial growth can occur if the water activity is below ∼0.65. Thus, water activity is related to moisture content, and can limit microbial growth. Although the samples in this study had a very low water activity, which means a low probability of spoilage, caution should be taken when storing DDGS in bulk to avoid potential moisture migration from the environment, especially during shipping.
Angle of Repose and Shear Strength
Angle of repose ranged from 35.48° to 82.87°, with a mean of 48.04° (Figure 1 and Table 1). LSD analysis demonstrated an obvious separation into two types of behaviors: a low value of about 40° (plants 1, 2, 3, 4, 5, 6, and 7); the other had a high value of about 75° (plants 8, 9, and 10). The results of the former were similar to Bhadra (Bhadra et al., 2010) and a little higher than Rosentrater (2006). The high value in the latter group appear to be due to substantially smaller particle size, but this might also be explained by compositional differences of the DDGS particles, as well as drying and cooling conditions, especially when sugar and fat molecules on the surface reach glass transition temperature–which will affect surface frictional characteristics such as stickiness and cohesion (Rosentrater, 2006).
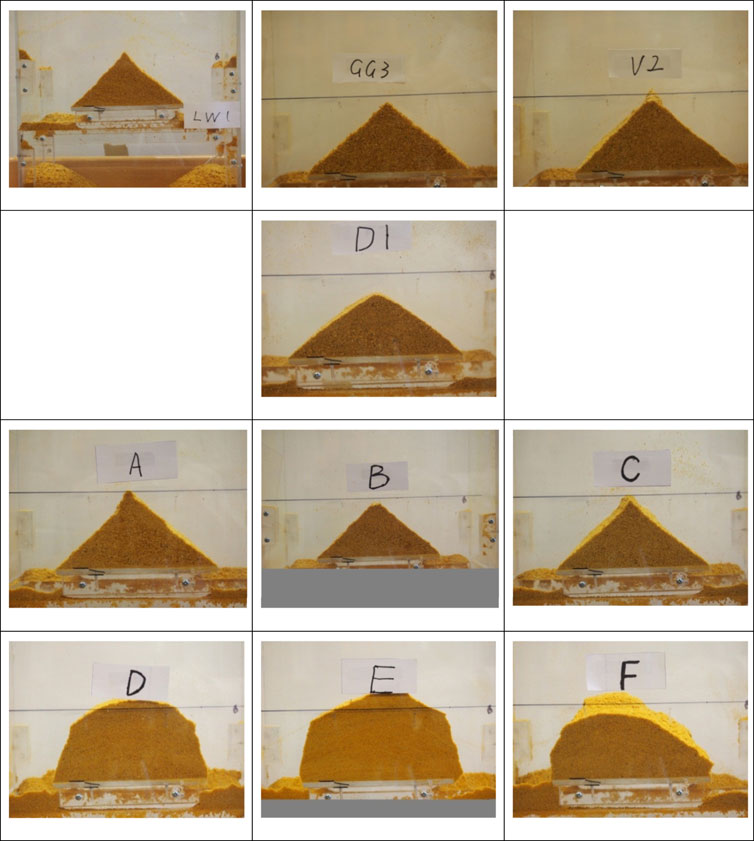
FIGURE 1. Angle of repose tests of distillers dried grains with solubles (DDGS) samples using a Helle-Shaw cell–note the drastic differences amongst the DDGS sources. All appear to have poor flow characteristics.
Shear strength, which is a measure of the ability of particles to agglomerate, and thus exhibit poor flowability, ranged from 0.022 to 0.050 kg/cm2 with a mean of 0.032 kg/cm2, similar to the findings of (Ganesan et al., 2008a; Ganesan et al., 2009). LSD tests revealed no significant differences across most samples except for those from plant 1.
Particle Size and Density
Particle size distributions for granular materials are quantified using two key parameters: geometric mean diameter (which assess the weighted average particle size) as well as geometric standard deviation (which assess the particle size dispersion). Overall, geometric mean diameter (dgw, mm) ranged from 0.34 to 1.28 mm with an overall average of 0.74 mm (Table 1). LSD analysis demonstrated an obvious separation into three types: the first group consisted of plants 1 and 2, with high values similar to the results of Clementson (Clementson et al., 2009); the second group consisted of plants 3, 4, 5, 6, and 7, with a mean value of about 0.65, similar to the results of Liu (Liu, 2008); the third group consisted of plants 8, 9 and 10, with a low value of about 0.4, similar to Bhadra (Bhadra et al., 2010). Geometric standard deviation (Sgw) ranged from 1.47 to 2.14 mm with a mean of 1.72 mm (Table 1), which were very similar to the results of U.S. Grains (2008) but higher than Bhadra (2009), Clementson (2009) and Liu (2008). All these results show large variations in particle size distribution among the various ethanol plants.
Loose bulk density ranged from 439.8 to 570.6 kg/m3 with a mean of 483.9 kg/m3 (Table 1), which were similar to the results of Bhadra (Bhadra et al., 2009) but a little lower than Clementson (2009) and Liu (2008). Packed bulk density ranged from 476.4 to 666.6 kg/m3 with a mean of 568.5 kg/m3 (Table 1). In most cases, LSD analysis showed that samples from different plants were significantly different from each other, meaning that there was a large variation across the different plants in terms of bulk densities.
Color (L, a, b)
The DDGS color values in this study are shown in Table 1 as well. The range of Hunter L (white-black axis) was from 51.77 to 61.29, with an overall mean of 56.70; the range of Hunter a (red-green axis) was from 12.25 to 15.91, with an overall mean of 13.85; the range of Hunter b (blue-yellow axis) was from 41.63 to 51.60, with an overall mean of 46.51. All these values were significantly higher than those found by Rosentrater (2006) and Bhadra et al. (2010); Hunter b was nearly 100% higher, indicating substantially more yellow hues and possibly better nutrient quality (Goihl, 1993; Ergul et al., 2003). This behavior was likely due to processing evolutions and better process management at many ethanol plants. LSD results indicated that most plants were significantly different from each other, except for plants 8, 9, and 10. Thus it is still apparent that DDGS properties vary more amongst plants than within a single plant over time (Rosentrater, 2006).
Relationships
Understanding the average values and ranges for the properties in this study is important for a variety of reasons. First, physical and flowability properties are key to the design of processing equipment, transportation equipment, and storage structures (Ganesan et al., 2008b; Rosentrater, 2007). Second, knowing how these properties have changes (or not changed) as well as how much variability to expect from DDGS will be important for engineers for design considerations. Further, Figure 2 illustrates all dependent variables versus each other for all samples, with no separation according to source. The value in examining this type of graph is to help identify trends and clusters amongst the variables. As can be seen, there was quite a bit of scatter in each of the x-y plots, and for many there were no discernable trends. But there were a few graphs which appeared to show some linear trends.
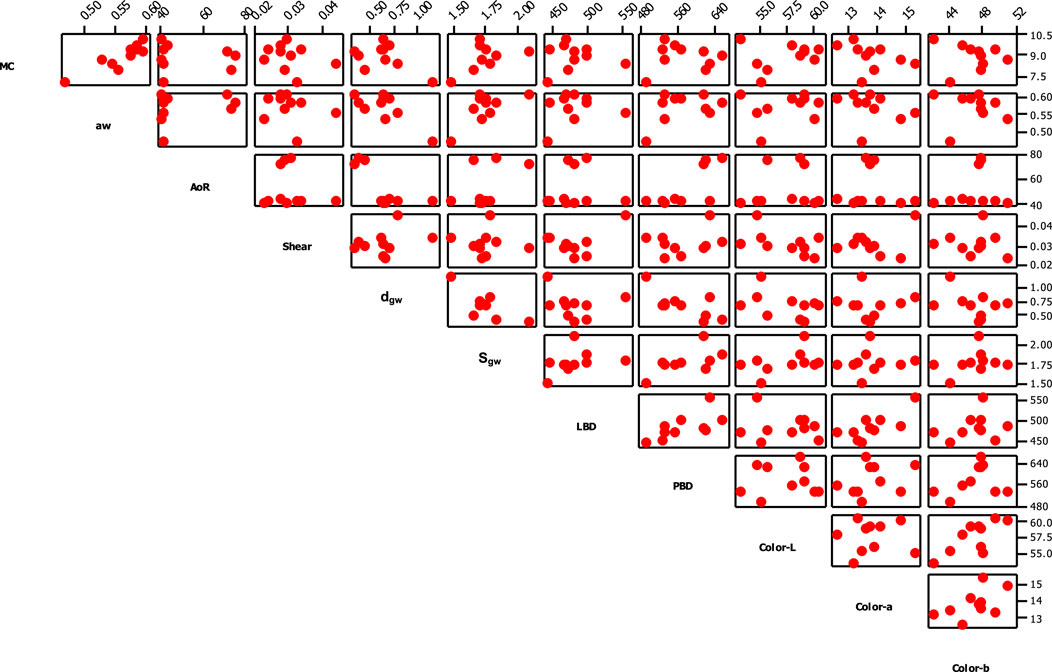
FIGURE 2. Scatterplot matrix for all dependent variables, which illustrates any potential trends and clusters in the data.
Figure 3 shows the significant linear relationships (p < 0.05) found in Figure 2. Packed bulk density had a linear relationship with loose bulk density (LBD decreased as PBD increased), geometric mean diameter, geometric standard deviation, and shear strength. It is notable that as packed bulk density increased shear strength increased–flowability has been a challenge for DDGS over the years, and trying to overcome the packing and resultant development of resistance to flow has been a topic of much research. Furthermore, as geometric mean diameter increased geometric standard deviation and angle of repose decreased (which is an indicator of better flowability). Larger particles tend to flow better than smaller DDGS particles, as they tend to resist agglomeration.
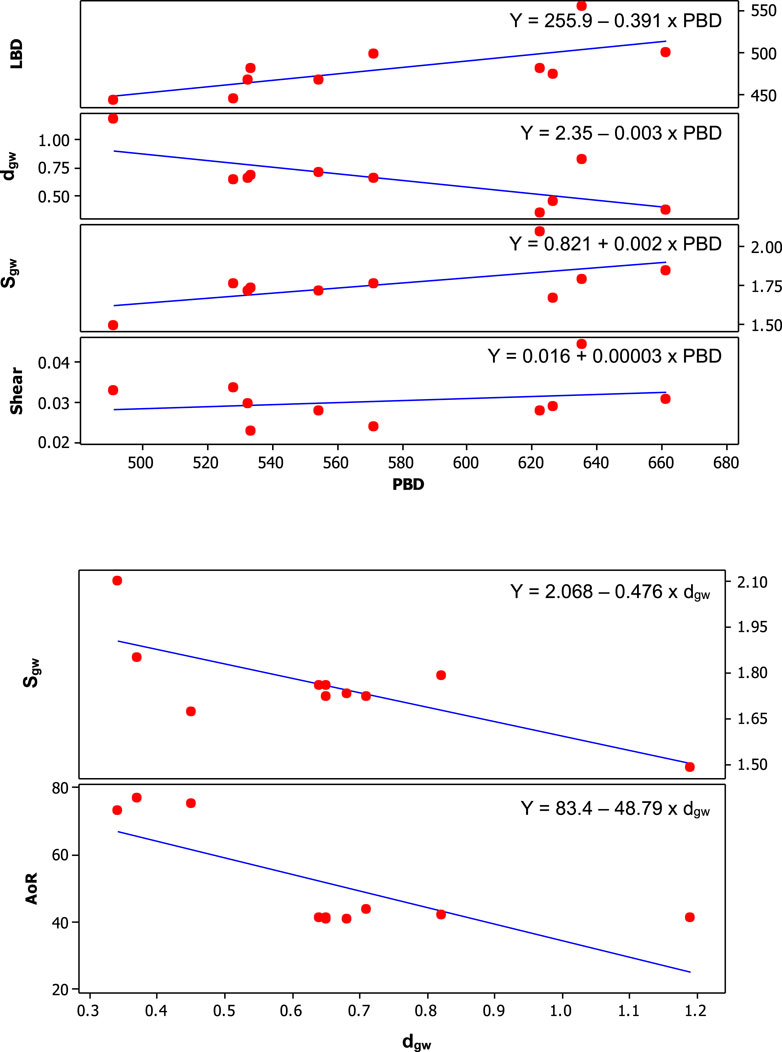
FIGURE 3. Predictions for strongest linear relationships found in Figure 2 (p < 0.05). Packed bulk density appears to be significantly related to loose bulk density, particle size (dgw and Sgw), and shear strength. dgw appears to be significantly related to Sgw and angle of repose. As average particle size (dgw) increased, particle standard deviation (Sgw) and angle of repose decreased.
As discussed by Bhadra et al. (2014) DDGS flowability behavior may be predicted by simultaneously examining the levels of moisture content, angle of repose, and Hausner Ratio (which is defined as the ratio of packed bulk density to loose bulk density). Figure 4 shows this type of analysis for the DDGS samples in this study. Examining the locations of the points in the graph, and comparing these values to those of Bhadra et al. (2014) it appears that most of the DDGS samples in this study would all be predicted to have poor flow (i.e., most have a Hausner Ratio greater than 1.2 and an angle of repose greater than 35—boundaries which were established by Bhadra et al., 2014), even though they all had low moisture levels.
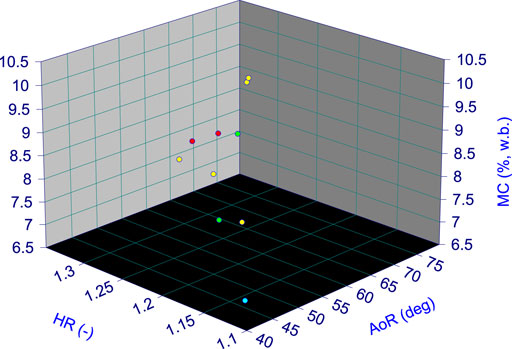
FIGURE 4. Examining DDGS moisture content, angle of repose, and Hausner Ratio (PBD/LBD) can be used to predict flowability problems, as described by Bhadra et al. (2014).
Conclusion
The goal of this research was to provide baseline data for physical and flow properties of typical DDGS produced in the American Midwest, specifically moisture content, water activity, angle of repose, geometric mean diameter, geometric standard deviation, loose bulk density, packed bulk density, color, and shear strength, and then to compare them with results of earlier studies. The purpose was to supply up-to-date engineering data which are key to properly storing and handling DDGS, designing and utilizing equipment, and ultimately using coproducts. Future work will focus on examining correlations between physical and chemical properties and determining why differences occur in different samples and amongst different ethanol plants. Prezant et al., 2008; Liu, 2009; Radhakrishnan et al., 2009.
Data Availability Statement
The raw data supporting the conclusions of this article will be made available by the authors, without undue reservation.
Author Contributions
KR conceived the research, WZ conducted the measurements and statistics and drafted the paper, KR conducted statistics and edited the paper.
Conflict of Interest
The authors declare that the research was conducted in the absence of any commercial or financial relationships that could be construed as a potential conflict of interest.
Publisher’s Note
All claims expressed in this article are solely those of the authors and do not necessarily represent those of their affiliated organizations, or those of the publisher, the editors and the reviewers. Any product that may be evaluated in this article, or claim that may be made by its manufacturer, is not guaranteed or endorsed by the publisher.
Acknowledgments
The authors express their appreciation to the ethanol plants who contributed samples for analysis and to Iowa State University for funding, facilities, equipment, and supplies. The content of this article has been presented, in part, at the ASABE Annual International Meeting, 2013. [Zhang, W., Rosentrater, K. A. 2013. Some properties of evolving distillers dried grains with solubles (DDGS) in 2013 ASABE Annual International Meeting, Kansas City, MO, July 21–24, 2013.]
References
Aoac, (2002). AOAC Official Methods of Analysis. Gaithersburg, Maryland, U.S.A.: AOAC International.
Asabe Standards, (2020). D606: Properties and Relationships for Distillers Dried Grains with Solubles (DDGS). St. Joseph, Michigan: ASABE.
ASABE Standards, (2004). S319.3: Method of Determining and Expressing Fineness of Feed Materials by Sieving. St. Joseph, Michigan: Michigan.
Beauchat, L. R. (1981). Microbial Stability as Affected by Water Activity. Cereal Foods World 26, 345–349.
Bhadra, R., Muthukumarappan, K., and Rosentrater, K. A. (2010). Physical and Chemical Characterization of Fuel Ethanol Coproducts Relevant to Value-Added Uses. Cereal Chem. J. 87 (5), 439–447. doi:10.1094/cchem-02-10-0014
Bhadra, R., Rosentrater, K. A., and Muthukumarappan, K. (2014). Modeling Distillers Dried Grains with Solubles (DDGS) Mass Flow Rate as Affeted by Drying and Storage Conditions. Cereal Chem. 94 (2), 298–309.
Bhadra, R., Rosentrater, K. A., and Muthukumarappan, K. (2009). Cross-sectional Staining and Surface Properties of DDGS Particles and Their Influence on Flowability. Cereal Chem. J. 86, 410–420. doi:10.1094/cchem-86-4-0410
Clementson, C. L., Rosentrater, K. A., and Ileleji, K. E. (2009). A Comparison of Measurement Procedures Used to Determine the Bulk Density of Distillers Dried Grains with Solubles (DDGS). Reno, NV, USA: ASABE Annual International Meeting, Paper No.095761
Clementson, C. L., and Ileleji, K. E. (2012). Particle Heterogeneity of Corn Distillers Dried Grains with Solubles (DDGS). Bioresour. Tech. 107, 213–221. doi:10.1016/j.biortech.2011.11.067
Clementson, C. L., and Ileleji, K. E. (2010). Variability of Bulk Density of Distillers Dried Grains with Solubles (DDGS) during Gravity-Driven Discharge. Bioresour. Tech. 101, 5459–5468. doi:10.1016/j.biortech.2010.02.066
Ergul, T., Amerzcua, C. M., Parsons, C. M., Walters, B., Brannon, J., and Noll, S. L. (2003). Amino Acid Digestibility in Corn Distillers Dried Grains with Solubles. Poult. Sci. 82, 70.
Fuels Association (Rfa), Renewable. (2020). Ethanol Industry Outlook. Available at: http://www.ethanolrfa.org/.Renewable Fuels Association: Washington D.C.
Ganesan, V., Muthukumarappan, K., and Rosentrater, K. A. (2008a). Flow Properties of DDGS with Varying Soluble and Moisture Contents Using Jenike Shear Testing. Powder Tech. 187, 130–137. doi:10.1016/j.powtec.2008.02.003
Ganesan, V., Rosentrater, K. A., and Muthukumarappan, K. (2008b). Flowability and Handling Characteristics of Bulk Solids and Powders - a Review with Implications for DDGS. Biosyst. Eng. 101, 425–435. doi:10.1016/j.biosystemseng.2008.09.008
Ganesan, V., Rosentrater, K. A., and Muthukumarappan, K. (2009). Physical and Flow Properties of Regular and Reduced Fat Distillers Dried Grains with Solubles (DDGS). Food Bioproc. Technol 2, 156–166. doi:10.1007/s11947-007-0026-x
Goossens, D. (2004). Effect of Soil Crusting on the Emission and Transport of Wind-Eroded Sediment: Field Measurements on Loamy sandy Soil. Geomorphology 58, 145–160. doi:10.1016/s0169-555x(03)00229-0
Grains, U. S. (2008). Physical & Chemical Characteristics of DDGS. DDGS User Handbook. Available at: www.grains.org.Accessed.February 10, 2011).
Hunter Associates Laboratory (Hal), (2002). Universal Software User’s Manual. Reston, VA, USA: Hunter Associates Laboratory
Ileleji, K. E., and Rosentrater, K. A. (2008). On the Physical Properties of Dried Distillers Grains with Solubles (DDGS). Providence, RI, USA: ASABE.ASAE Paper No. 084576
Ileleji, K., Prakash, K., Stroshine, R., and Clementson, C. (2007). An Investigation of Particle Segregation in Corn Processed Dried Distillers Grains with Solubles (DDGS) Induced by Three Handling Scenarios. Bulk Sol. Powder Sci. Technol 2, 84–94.
Kingsly, A. R. P., Ileleji, K. E., Clementson, C. L., Garcia, A., Maier, D. E., Stroshine, R. L., et al. (2010). The Effect of Process Variables during Drying on the Physical and Chemical Characteristics of Corn Dried Distillers Grains with Solubles (DDGS) - Plant Scale Experiments. Bioresour. Tech. 101, 193–199. doi:10.1016/j.biortech.2009.07.070
Liu, K. (2009). Fractionation of Distillers Dried Grains with Solubles (DDGS) by Sieving and Winnowing. Bioresour. Tech. 100, 6559–6569. doi:10.1016/j.biortech.2009.07.053
Liu, K. (2008). Particle Size Distribution of Distillers Dried Grains with Solubles (DDGS) and Relationships to Compositional and Color Properties. Bioresour. Tech. 99, 8421–8428. doi:10.1016/j.biortech.2008.02.060
Nfta, (2012). Forage Analysis Procedures. Omaha, NE.: National Forage Testing Association. Available at: http://www.foragetesting.org Accessed July, 1993).
Prezant, B., Weekes, D. M., and Millers, J. D. (2008). American Industrial Hygiene Association (AIHA): Indoor Mold. Recognition, Evaluation, and Control of Indoor Mold. Fairfax, VA, USA: AIHA.
Radhakrishnan, S., Filip, T., and Eugene, C. (2009). Pilot Scale Fiber Separation from Distillers Dried Grains with Solubles (DDGS) Using Sieving and Air Classification. Bioresour. Tech. 100 (14), 3548–3555.
Rosentrater, K. A. (2007). Corn Ethanol Coproducts - Some Current Constraints and Potential Opportunities. Int. Sugar J. 109 (1307), 1–12.
Rosentrater, K. A., and Muthukumarappan, K. (2006). Corn Ethanol Coproducts: Generation, Properties, and Future Prospects. Int. Sugar J. 108.
Rosentrater, K. A. (2011). Physical Properties of DDGS. Distillers Grains: Production, Properties and Utilization, –142. Boca Raton, FL, USA: CRC Press, 121.
Rosentrater, K. A. (2006). Some Physical Properties of Distillers Dried Grains with Solubles (DDGS). Appl. Eng. Agric. 22, 589–595.
SchnepfYacobucci, R. B. D. (2013). Renewable Fuel Standard (RFS): Overview and Issues. Available at: http://www.epa.gov/otaq/fuels/renewablefuels/index.htm Accessed March 14, 2013).
Spiehs, M. J., Whitney, M. H., and Shurson, G. C. (2002). Nutrient Database for Distiller's Dried Grains with Solubles Produced from New Ethanol Plants in Minnesota and South Dakota. J. Anim. Sci. 80, 2639–2645. doi:10.2527/2002.80102639x
Tscheuschner, H.-D. (1987). N. N. Mohsenin: Physical Properties of Plant and Animal Materials. Structure, Physical Characteristics and Mechanical Properties. 2. Aufl. 891 Seiten, zahlr. Abb. und Tab. Gordon and Breach Science Publishers, New York u. a. 1986. Preis: 140.-£. a. 1986Preis: 140.—£, Nahrung. Structure, Physical Characteristics and Mechanical Properties. 2. Aufl. 891 Seiten, zahlr. Abb. und Tab, 31. New York, NY, USA: Gordon and Breach Science Publishers, 702. doi:10.1002/food.19870310724
Usda, (1999). Practical Procedures for Grain Handlers: Inspecting Grain. Washington, D.C, USA: United States Department of Agriculture: Grain Inspection, Packers, and Stockyards Administration Accessed January 22, 2008).
Keywords: biofuels, coproducts, distillers dried grains with solubles, DDGS, flowability, physical properties
Citation: Rosentrater KA and Zhang W (2021) Selected Physical and Flowability Properties of Evolving Distillers Dried Grains With Solubles (DDGS). Front. Energy Res. 9:722899. doi: 10.3389/fenrg.2021.722899
Received: 09 June 2021; Accepted: 03 August 2021;
Published: 13 August 2021.
Edited by:
Umakanta Jena, New Mexico State University, United StatesReviewed by:
Pankaj Pandey, DuPont, United StatesKrishna Kumar Jaiswal, Durban University of Technology, South Africa
Copyright © 2021 Rosentrater and Zhang. This is an open-access article distributed under the terms of the Creative Commons Attribution License (CC BY). The use, distribution or reproduction in other forums is permitted, provided the original author(s) and the copyright owner(s) are credited and that the original publication in this journal is cited, in accordance with accepted academic practice. No use, distribution or reproduction is permitted which does not comply with these terms.
*Correspondence: Kurt A Rosentrater, S2Fyb3NlbnRAaWFzdGF0ZS5lZHU=
 Kurt A Rosentrater
 Weitao Zhang