- Clean Energy System R8D Division, Korea Institute of Industrial Technology, Cheonan, South Korea
The concentration ratio is one of the most important characteristics in designing a Cassegrain solar concentrator since it directly affects the performance of high-density solar energy applications such as concentrated photovoltaics (CPVs). In this study, solar concentrator modules that have different configurations were proposed and their performances were compared by means of a Monte Carlo ray-tracing algorithm to identify the optimal configurations. The first solar concentrator design includes a primary parabolic concentrator, a parabolic secondary reflector, and a homogenizer. The second design, on the other hand, includes a parabolic primary concentrator, a secondary hyperbolic concentrator, and a homogenizer. Two different reflectance were applied to find the ideal concentration ratio and the actual concentration ratio. In addition, uniform rays and solar rays also were compared to estimate their efficiency. Results revealed that both modules show identical concentration ratios of 610 when the tracking error is not considered. However, the concentration ratio of the first design rapidly drops when the sun tracking error overshoots even 0.1°, whereas the concentration ratio of the second design remained constant within the range of the 0.8° tracking error. It was concluded that a paraboloidal reflector is not appropriate for the second mirror in a Cassegrain concentrator due to its low acceptance angle. The maximum collection efficiency was achieved when the f-number is smaller and the rim angle is bigger and when the secondary reflector is in a hyperboloid shape. The target area has to be rather bigger with a shorter focal length for the secondary reflector to obtain a wider acceptance angle.
Introduction
The amount of solar energy intercepted by the earth every minute is greater than the amount of energy that is obtained from the fossil fuels that the world consumes each year. However, it is often constrained to use solar energy by its low energy density compared to conventional energy resources. Solar energy has an energy density of 1.5 × 10⁻⁶ J/m3, while the energy densities of oil and gasoline are 4.5 × 10¹⁰ J/m3 and 1.0 × 10¹⁰ J/m3, respectively (Layton, 2008). Furthermore, the conventional solar cells, which are based on the single junction of semiconductor materials, can harvest only a small portion of the solar spectrum to convert solar energy into useful electricity. The unused remaining spectrum of solar energy is dissipated as heat, which leads to low conversion efficiency. Hence, it is required for the solar cell to respond to the more wide range of the solar spectrum in order to produce more electricity, maximizing the conversion efficiency.
Concentrated photovoltaics (CPVs) are one of the feasible solutions to solve such problems, which employ a multijunction solar cell (MJC) and solar concentrators as the major components. The CPV requires less land compared to conventional photovoltaics as it uses a smaller photovoltaic array. Therefore, it is capable of generating higher power with the same land use. Although cumulative CPV capacity installed in 2016 was 350 MW, it is only less than 0.2% of the global PV capacity (230,000 MW) installed that year (Labouret and Villoz, 2010).
MJC is a sort of tandem solar cell, which is created by stacking more than one p-n junction cells. Each junction cell absorbs the corresponding solar spectrum according to its band-gap energy. The typical size of MJC is 50 mm × 5 mm, the open-circuit voltage is 2.6 V, the short-circuit ampere is 1.81 A. So far, the multijunction solar cell has achieved a maximum efficiency of 46% at laboratory (Honsberg and Barnett, 2005). Although the MJC has the highest conversion efficiency among other solar cells, mass production is still expensive for large-scale applications. For such a reason, the concentrated photovoltaic (CPV) has been developed by many researchers. Low-cost concentrators are employed to converge sunlight onto a small area of the multijunction cells (Mendelsohn et al., 2014).
As another important component of the CPV, the solar concentrator is a device that collects solar energy from a large aperture area and converges it onto a much smaller area. The use of the solar concentrator not only increases the efficiency of solar energy systems but also reduces the overall cost of the system. The solar concentrators are designed with refractive or reflective optics in either flat or curve shapes in order to intensify incident solar radiation from 10 to 1,000 suns (Garboushian et al., 1997; Mendelsohn et al., 2014).
The solar concentrators are categorized by a concentration method and an acceptance angle. Lenses over 50 mm in diameter are too thick to be used for the solar concentrator. Instead, Fresnel lenses are usually selected as a solar concentrator. Fresnel lenses are fabricated to have either a point focus or a linear focus based on their application. The curved reflective mirrors have a reflective surface in the shape of a parabola. They focus all the incident rays parallel to the axis onto a point located at the parabola’s focus. The reflective mirrors are able to concentrate solar energy without chromatic aberration, but they require much higher accuracy than the refractive method. Another type of the solar concentrators is the compound parabolic concentrator (CPC), which provides the maximum concentration ratio with a fixed acceptance angle. For high-concentration purpose, however, CPC is not appropriate because its dimension increases too much. Hence, CPC is restricted to low-concentration applications.
Many efforts and research studies have been conducted to develop more efficient solar concentrators (Rabl, 1976; Lorenzo and Luque, 1982; Feuermann et al., 2002; Bader et al., 2009; Whang et al., 2009; Chen et al., 2010; Zhang et al., 2014). Chen et al. (2010) designed solar concentrators that have two reflectors to achieve a high concentration ratio when a tracking error is present. They used ASAP (Advanced System Analysis Program) for ray-tracing simulation. Allen et al. (Whang et al., 2009) developed a novel solar concentrator that can reduce the UV and IR spectrum by incorporating a chromatic lens. They designed the lens with optical design software, OSLO. Their design can also be applied to photovoltaic cells to reduce the heat as it filters IR. They concluded that 94% of UV and 50% of IR were removed when the distance between the fiber and the chromatic lens was 3.1 cm, with 92% transmittance of visible light. Patel et al. (Bader et al., 2009) proposed a new two-stage optical design for solar concentrators, which combined a composite parabolic trough (CPT) as a primary concentrator and a CPC (compound parabolic concentrator) type as a secondary reflector. They concluded that their design boosts the concentration ratio by a factor of 1.52 relative to the CPT alone. Daniel et al. (Feuermann et al., 2002) conducted a field experiment on a solar fiber-optic minidish concentrator that is 200 mm in diameter with a focal length of 120 mm. They used a 1-mm diameter optical fiber to transport concentrated sunlight and measured the output flux from the optical fiber at a remote target that is 20 m away. They suggested the use of sculpted optical fiber tips that can increase the concentrated power density by a factor of 2–4, which may be used for solar surgery. Rabl (1976) conducted a comparative analysis on various solar concentrators in terms of key characteristics such as the concentration ratio, sensitivity to mirror errors, acceptance angle, and reflector size. They proposed a novel concentrator that includes a compound parabolic concentrator (CPC) as the second reflector to increase the acceptance angle. Their results showed that the concentrator with CPC at the focus region gives the highest concentration ratio. Lorenzo and Luque (1982) compared the optical performance that can be obtained with two-stage concentrators when the primary concentrator was a Fresnel lens or a parabolic reflector. It was concluded that the parabolic reflector could generate higher power density than the Fresnel lens. Zhang et al. (2014) compared diverse types of secondary mirrors using ASAP in order to analyze the effects of geometric parameters and preciseness of a concentrator on the optical performance. Their simulation results showed that when a flat mirror or hyperbolic mirror was used as the second mirror, the solar concentrator was more sensitive to the rim angle. They revealed that a convex surface is more appropriate for the second mirror, especially when the rim angle is bigger than 90°.
In this study, we propose two types of two-stage solar concentrator modules and conducted ray-tracing simulation in order to investigate the concentration ratio and the sensitivity to the tracking error. Simulation was conducted by means of TracePro, which is ray-tracing simulation software based on the Monte Carlo method.
Design of Solar Concentrator Modules
Two concentrator modules (CM-1 and CM-2) were designed and simulated to evaluate their performances in terms of concentration ratio and tolerance angle. Both concentrator modules consist of three components: a primary concentrator, a secondary reflector, and a homogenizer. For CM-2, however, a hyperbolic reflector was used as the secondary reflector, while CM-1 used a parabolic reflector as the secondary reflector.
Concentrator Module-1
In the concentrator module-1(CM-1), a parabolic reflector was employed as the primary concentrator and the secondary reflector. The parabolic reflector has a curved surface created by revolving the half of a 2-dimensional parabola about its central axis (z-axis). The 2-dimensional parabola is represented by the equation x2= 4py, with the y-axis being the axis of symmetry of the parabola. The surface of the parabolic reflector receives rays parallel to the z-axis and converges them at the focal point, as shown in Figure 1. The parabolic radius that is the distance from the focal point can be obtained in terms of the rim angle as follows:

FIGURE 1. Drawings of each component of the concentrator module-1: (A) the primary parabolic concentrator, (B) the secondary reflector, and (C) the homogenizer.
It is noteworthy that solar rays are collimated because the solar disk subtends an angle of 0.53° (2θs) at the earth, which creates a focal area with a certain diameter depending on the focal length. The incident solar rays on the surface of the primary concentrator are concentrated onto the focal point and, in turn, reflected back by the secondary reflector into the entrance of the homogenizer. The homogenizer is located at the center of the primary concentrator and makes solar rays evenly distributed onto the target area (i.e., MJC). The second reflector is located below the focal point of the primary concentrator by a distance of the focal length of the secondary reflector so that solar rays reflect back in parallel to the z-axis.
Figure 1 illustrates the drawings of each component of CM-1. The parabolic concentrator has a diameter of 300 mm and a focal length of 195 mm with a rim angle of 42°. The focal length and diameter of the secondary parabolic are 15 and 30 mm, respectively. As depicted in Figure 1B, the position of the secondary reflector is determined such that the rays concentrated by the primary concentrator are reflected in parallel with its rotation axis. The ray falling into the homogenizer reaches the end with only one reflection. A multijunction cell can be placed at the bottom of the homogenizer or a fiber optic cable can be connected to the homogenizer for another application.
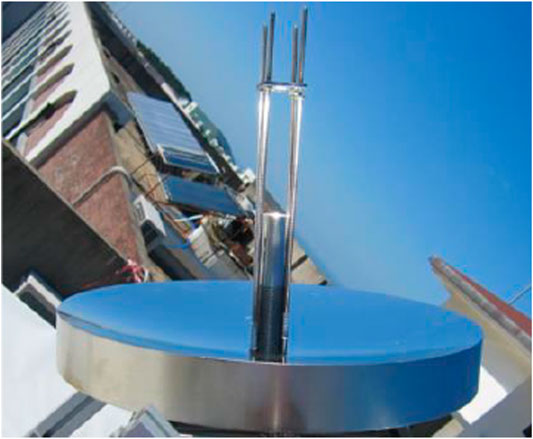
Figure 2 shows the photograph of an assembly of the solar concentrator module. The bright region is clearly seen at the secondary reflector. The primary mirror and the secondary reflector were made of a bulk of aluminum using a milling machine. Although the primary mirror weighs 5 kg, it could be considerably reduced with an extrusion molding technique.
The useful power output from the concentrator module can be obtained by the following equation:
where ηp, ηs, and ηh are the efficiencies of the primary mirror, the secondary parabolic reflector, and the homogenizer, respectively. Ac is the effective surface area of the primary mirror, and Id is the direct normal irradiance that is the beam component of solar irradiance. For this case, 1 sun of incident solar flux was assumed to estimate the concentration ratio.
The disturbance of the incident solar rays by the secondary reflector and the support struts also should be considered. For our first design, the diameter of the secondary reflector is 0.03 m, and four rods are supporting the secondary reflate at the center of the primary concentrator. The diameter of the rod is 4 mm, and the length is 200 mm. Therefore, the four struts and the secondary reflector make a shadow with an area of 1.18 × 10⁻² m2, disturbing the solar rays from striking the surface. 16.71% of the total area of the primary mirror does not receive the solar rays. The effective primary area (Ae) is then calculated to be 5.88 × 10⁻² m2.
Concentrator Module-2
The second concentrator module (CM-2) includes a parabolic mirror as a primary concentrator, a hyperbolic reflector as a secondary concentrator, and a homogenizer. The hyperbolic reflector was employed in order to again converge the light reflected from the primary mirror into the inlet of the homogenizer, while the parabolic reflector of the first design reflects back the light in parallel.
For the second design, a parabolic concentrator manufactured by Edmund Optic Inc. was employed as the primary concentrator. It is 300 mm in diameter, and its focal length is 76 mm. There is a hole with a diameter of 19 mm at the center. The surface was coated with the same aluminum material as the CM-1. The secondary hyperbolic reflector plays the role of converging the concentrated rays into the homogenizer, and hence, the acceptance angle increases. The diameter is 38 mm, and the height is 7 mm. The reflector has a front focal length of 6 mm and a back focal length of 20 mm. The surface was also coated with the same aluminum material. The homogenizer acts as a light guide to deliver the reflected concentrated ray to the target (MJC). Its length is 80 mm, and its diameter is 12 mm. Figure 3 illustrates the detailed drawing of the primary concentrator, the secondary reflector, and the homogenizer. F1 and F2 denote the focal point of the primary concentrator and secondary reflector, respectively.
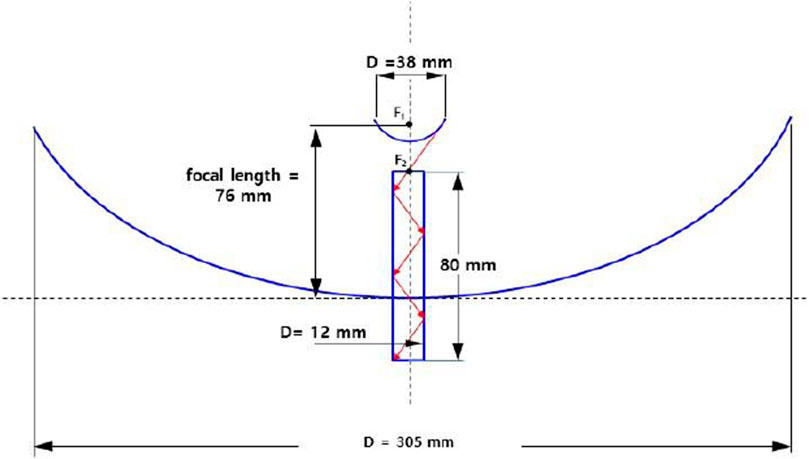
FIGURE 3. Detailed geometries of the primary parabolic concentrator, the second hyperbolic reflector, and the homogenizer.
Reflectance
The surfaces of the primary concentrators and secondary reflectors were coated with aluminum and followed by a ceramic. As the reflectance of the aluminum-coated surface drops quickly due to oxidation when it is exposed to the environment, the ceramic layer protects the aluminum layer from degradation. A mirror film was also a good candidate for the reflectance material, which is a joint invention of Reflectech Inc. and the NREL (National Renewable Energy Laboratory). However, it was very difficult to attach the mirror film to the curved surface of each component.
The reflectance of the primary concentrator and the secondary reflector was measured using a UV-Vis. spectrophotometer (model no. S-3100). As it is difficult to measure the reflectance of the surfaces of the bulky concentrator, a sample patch (30 mm × 30 mm) was prepared by coating it with the same materials, and its reflectance was measured.
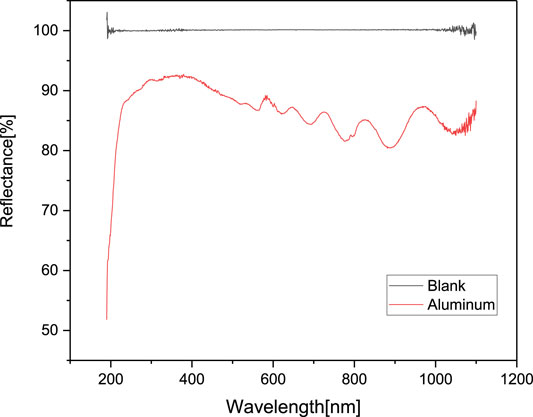
Figure 4 shows the comparative reflectance of the sample patch coated with aluminum and the blank. The blank is the reflectance of the reference material that has 100% value, which was provided by SinCo Inc. It is clearly seen that the average reflectance of the aluminum coating layer was 86.34% in the range of 190–1,100 nm.
According to this reflectance, the losses due to the reflectivity of both the primary concentrator and the secondary reflector were then computed using the aluminum coating. With this surface finish, the efficiency of the primary and secondary was considered to be 0.86. The inner surfaces of the homogenizer could not be coated with any material but be treated with polishing. The efficiency of the homogenizer was conservatively estimated to be 0.65. Based on Eq. 2, the resulting power delivered to the end area is then 24 W.
Monte-Carlo Ray-tracing
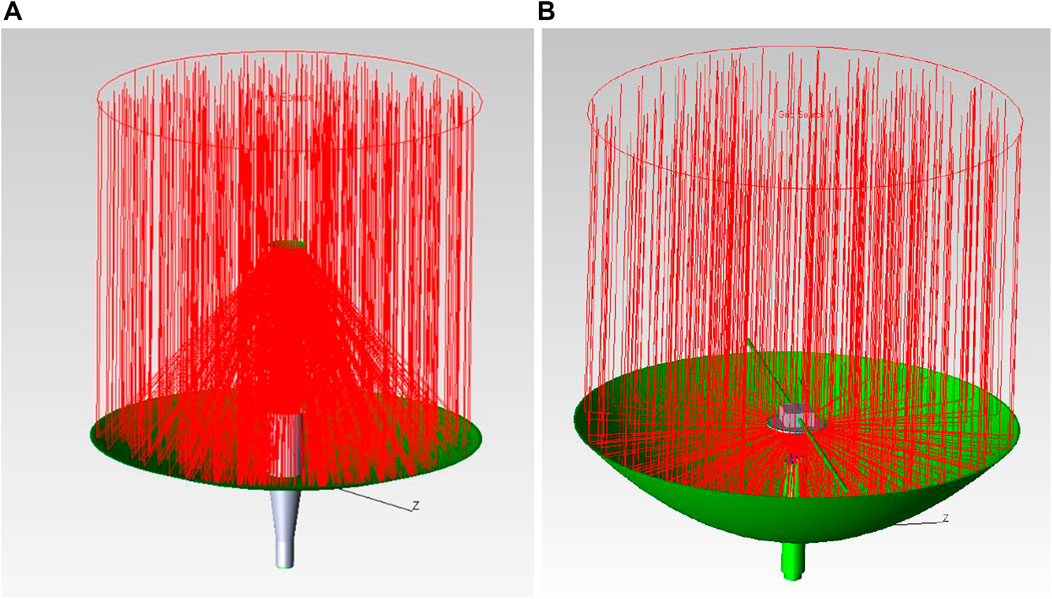
The ray-tracing simulation using TracePro was conducted to investigate the performance of two concentrator modules. TracePro is a ray-tracing program for designing and analyzing optical and illumination systems, which Lambda Research Corporation of Littleton developed under a grant from NASA. It provides GUI (graphical user interface) in which 3-dimensional modeling can be drawn by simply entering values. The modeling of each component for both concentrator module designs is illustrated in Figure 5. A perfect absorber plate is located at the bottom of the homogenizer to count the number of rays exiting from the homogenizer. The absorbed rays are then compared with the rays generated from the gird source in order to compute the collection efficiency and concentration ratio. The ray type should be defined by specifying the angular profile before running ray-tracing simulation. Two different types of rays were used in this study, namely, a uniform ray and a solar ray. In the uniform ray, each ray starts with a flux equal to the peak flux and has uniform intensity within the cone angle of the source. On the other hand, the solar ray has an angular profile equal to that measured for the sun. The grid source is modeled in a circular shape and has a diameter of 300 mm. It was set up to generate an irradiance of 1000 W/m2 (1 sun) with a total of 10,621 rays.
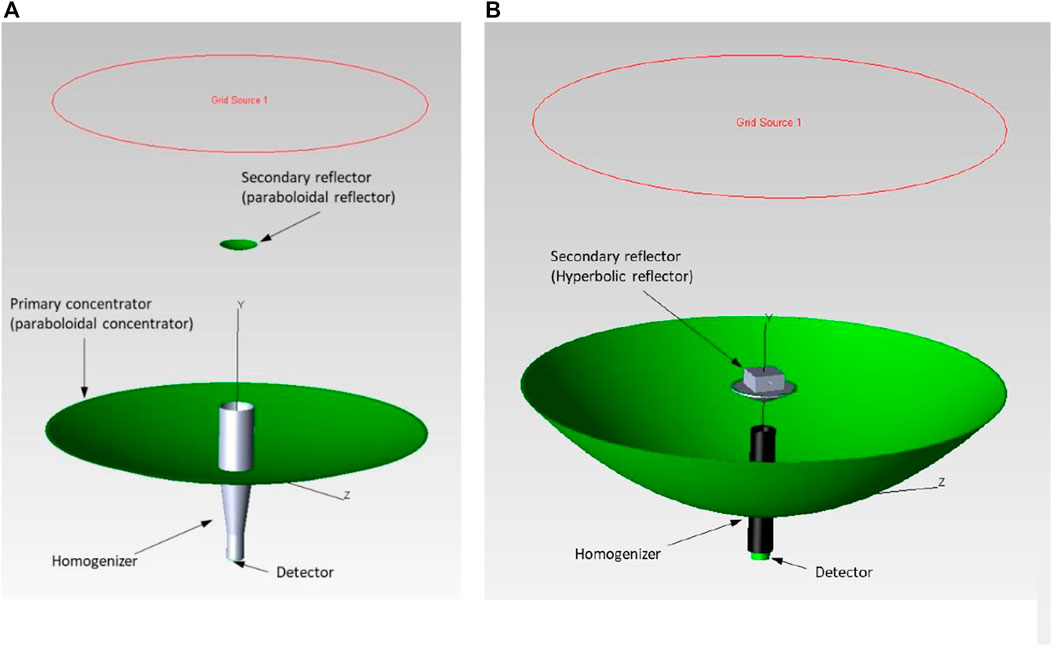
FIGURE 5. 3-dimensional modeling of each component of the solar concentrator modules: (A) CM-1 and (B) CM-2.
Solar concentrator modules are characterized by the concentration ratio (CR). By definition, the concentration ratio has two different meanings, namely, geometric concentration ratio, CRgeo, and optical concentration ratio, CRopt (Harriga, 1986; William, 2011). The geometric concentration ratio is defined by the ratio of the aperture area (the diameter of the primary concentrator) and the area of the receiver (target) as follows:
where CRgeo indicates the geometrical concentration ratio and Aa and Ar are the aperture area and the receiver area, respectively.
It should be noted that the geometrical concentration ratio is the maximum obtainable concentration ratio with the given dimensions since it does not consider light properties (spatial and angular distributions) and optical properties such as reflectance, refraction, and transmittance of the concentrators.
The optical concentration ratio is defined as the ratio of the irradiance incident on the receiver (detector) and the irradiance over the aperture area and can be calculated using the following equation:
where CRopt indicates the optical concentration ratio. Ar is the receiver area, and Ia and Ir are the insolation on the aperture area and the irradiance (radiant flux) on the receiver area, respectively.
In order to evaluate the performance of the concentrator modules, we also introduced the collection efficiency that is defined as the ratio of the flux (W) incident on the observation plane (detector) to the flux (W) emitted from the ray source (Turner, 2021).
As a form of electromagnetic wave, solar radiation reaching the surface of the earth is composed of a wide range of wavelengths spanning from 250 to 2,500 nm with a peak of 546 nm. In order to investigate the effect of the wavelength on the performance of the concentrator modules, a single wavelength of 546 nm and a wide range of wavelengths from 280 to 1,100 nm were applied to the light source, and the performances were compared using the same concentrator module. The measured reflectance data were applied to the surface properties of the concentrator, second reflector, and homogenizer (see Figure 4). As shown in Table 1, the differences in the total flux and collection efficiency were found to be negligible, and hence, a single wavelength of 546 nm was used as the wavelength of the light sources in this simulation for simplicity.
Results and Discussion
Figure 6 shows the results of the ray-tracing simulation of both concentration modules. Rays were sorted to show only the rays that have been absorbed by the surface of the detector. It is clearly seen that all the rays generated from the grid source are first concentrated by the primary concentrator and reflected by the secondary reflector, and finally, they enter into the homogenizer.
Table 2 shows the concentration ratios of two different solar concentrator modules in terms of geometrical concentration ratio (CRgeo) and optical concentration ratio (CRopt). There are four cases in the optical concentration ratio depending on ray properties and reflectance. The geometrical concentration ratios for CM-1 and CM-2 are the same as 625 since their aperture area and receiver area are identical. However, it can be found that the optical concentration ratio varies with different conditions such as ray source properties and reflectance. For case 1, where the uniform ray and the perfect reflectance are applied, the optical concentration ratio is almost the same as the geometrical concentration ratio. It can also be found that the CM-2 is not affected by the ray source type as its acceptance angle covers the solar subtended angle.

TABLE 2. Concentration ratios of solar concentrator modules. Case 1: uniform ray and perfect reflectance, case 2: solar ray and perfect reflectance, case 3: uniform ray and aluminum reflectance, and case 4: solar ray and aluminum reflectance.
Figure 7 shows the irradiance map on the detector of the CM-1 under two different ray sources, namely, the uniform ray and the solar ray. The irradiance map was created by the flux distribution that has been absorbed by the detector located at the bottom of the homogenizer. It can be seen from Figure 7A that most of the rays incident on the detector reach the center with an average value of 6.1 × 10⁵ W. On the other hand, as shown in Figure 7B, the rays are distributed more uniformly with an average value of 4.5 × 10⁵ W. The peak-to-average ratio (PAR) is defined as the ratio of the peak flux to the average of the flux across the surface. The PAR for the uniform ray of 10.3 is observed for the uniform ray, while the solar ray gives a PAR of 2.2. For the uniform ray, a total flux of 69.24 W is obtained with a collection efficiency of 0.98. Using the average flux and the total emitted flux of the grid source, the optical concentration ratio for the uniform ray reaches 614 suns. For solar rays, it is observed that the total flux is 50.92 W with a collection efficiency of 0.73. An optical concentration ratio of 450 suns was obtained for the solar ray, which decreased by 26.7% compared with that of the uniform ray. For the uniform ray, a total output flux of 69.24 W is obtained with a collection efficiency of 0.98. Using the average flux and the total emitted flux of the grid source, the optical concentration ratio for the uniform ray reaches 614 suns.
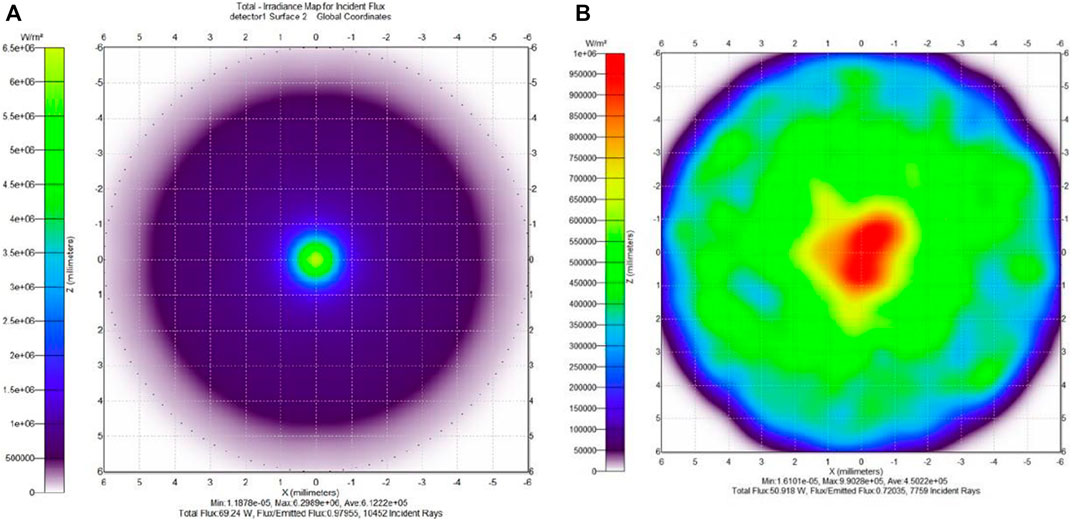
FIGURE 7. Irradiance map for flux absorbed by the CM-1 under different ray source types: (A) uniform ray and (B) solar ray.
For solar rays, it is observed that the total output flux is 50.92 W with a collection efficiency of 0.73. An optical concentration ratio of 450 suns was obtained for the solar ray, which decreased by 26.7% compared with that of the uniform ray. This is attributed to the fact that fewer rays reach the detector due to the sun’s subtended angle (0.25°), although the same number of rays is generated from the grid source. As shown, the number of incident rays on the detector for the uniform ray is 10,452, while that of solar rays is 7,759.
Figure 8 shows the variation of the collection efficiency of the concentrator modules with different reflectance and different ray sources. A uniform ray source and perfect reflectance (100%) were assumed for an ideal case. For a real condition, the solar ray is considered as a ray source, and the aluminum coating was applied to the surface of each component. As shown, CM-2 has a wider acceptance angle than CM-1 since the collection efficiency is the same regardless of the type of ray source. For the ideal case, CM-1 exhibits a collection efficiency of 0.98 with a total flux of 69.24. However, for the real condition, the collection efficiency dropped to 0.53 with a total flux of 37.44 W. The collection efficiency of CM-2 is almost the same as CM-1, but it is slightly less than CM-1.

FIGURE 8. Collection efficiency of the concentrator modules with different reflectance and different ray sources: (A) CM-1 and (B) CM-2.
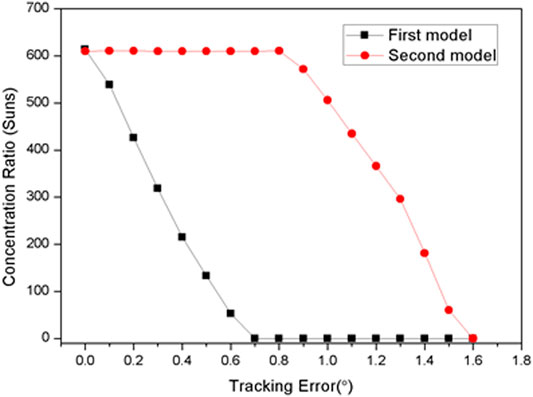
Figure 9 shows the effect of the tracking error on the concentration ratio of the solar concentrator modules. The tracking error lies in the range of 0.0–1.6°. It can be seen that the concentration ratio is largely affected by the tracking error for both concentrator modules. As shown, the concentration ratio of CM-1 drastically drops with increasing tracking error. On the other hand, the concentration ratio of CM-2 maintains at its maximum of 610 suns until the tracking error goes beyond 0.8°. After the critical angle, the concentration ratio also drops rapidly at the same rate as CM-1. Based on the theoretical upper limit of the concentration ratio, the rim angle is the key factor because it affects the concentration ratio. When a solar concentrator operates at a single stage, the maximum concentration ratio is achievable at a rim angle of 45° with a given acceptance angle. For the two-stage solar concentrator module, however, it was found that the concentration ratio can be obtained with increasing rim angle.
Conclusion
Two types of solar concentrator modules were designed, and ray-tracking simulations were conducted to investigate the concentration ratio, collection efficiency, and the effect of tracking errors. The first solar collector module (CM-1) consists of a parabolic primary collector, a parabolic secondary reflector, and a homogenizer. On the other hand, the second solar collector module (CM-2) used hyperbolic secondary reflectors with other components identical to CM-1. Perfect mirror and aluminum coating were compared to find the ideal concentration ratio and the actual concentration ratio. In addition, uniform rays and solar rays were compared to estimate the collection efficiency and the acceptance angle against the tracking error. The key findings from this study include the following:
1) For the first design of the concentrator module, the concentration ratio reached 614 suns with a collection efficiency of 0.98 under the condition of perfect reflectance and the uniform ray source. However, the concentration ratio dropped to 450 suns with a collection efficiency of 0.73 under a real solar ray condition.
2) When the aluminum coating was applied on the surface of the module’s components, the concentration ratio dropped to 145 under a real solar ray condition. The corresponding power output was 37.44 W, which is the maximum power available for the MJC cell to generate electricity.
3) When the tracking error was considered, the concentration ratio is largely affected by the accuracy of the solar tracker. Especially, the concentration ratio of the CM-1 dramatically decreases with increasing tracking error. For the CM-2, the concentration remained until a tracking error of 0.8°, with a concentration ratio of 610 suns. Above a tracking error of 0.8°, it dramatically decreases at the same rate as the CM-1.
4) The rim angle is a key factor that affects the concentration ratio. When the rim angle is 45°, the maximum concentration ratio is achievable with a given acceptance angle. However, it was found that the bigger the rim angle is, the higher the concentration ratio is obtained for the two-stage concentrator module.
Data Availability Statement
The original contributions presented in the study are included in the article/Supplementary Material, and further inquiries can be directed to the corresponding author.
Author Contributions
SO: conceptualization, methodology, modeling, writing, reviewing, and editing. HK: methodology, modeling, and writing. YH: writing, reviewing, and editing.
Conflict of Interest
The authors declare that the research was conducted in the absence of any commercial or financial relationships that could be construed as a potential conflict of interest.
The handling editor declared a past co‐authorship with one of the authors SJO.
Publisher’s Note
All claims expressed in this article are solely those of the authors and do not necessarily represent those of their affiliated organizations or those of the publisher, the editors, and the reviewers. Any product that may be evaluated in this article, or claim that may be made by its manufacturer, is not guaranteed or endorsed by the publisher.
Acknowledgments
This work was supported by the National Research Foundation of Korea (NRF) (No. 2016R1F1A1061693), and the Korea Institute of Industrial Technology as “Development of core technology for smart wellness care based on cleaner production process technology (No. EH210005)”.
References
Bader, R., Haueter, P., Pedretti, A., and Steinfeld, A. (2009). Optical Design of a Novel Two-Stage Solar Trough Concentrator Based on Pneumatic Polymeric Structures. J. Sol. Energ. Eng Trans ASME 131, 0310071–0310079. doi:10.1115/1.3142824
Chen, C.-F., Lin, C.-H., and Jan, H.-T. (2010). A Solar Concentrator with Two Reflection Mirrors Designed by Using a ray Tracing Method. Optik - International Journal for Light and Electron Optics 121, 1042–1051. doi:10.1016/j.ijleo.2008.12.010
Feuermann, D., Gordon, J. M., and Huleihil, M. (2002). Solar Fiber-Optic Mini-Dish Concentrators: First Experimental Results and Field Experience. Solar Energy 72, 459–472. doi:10.1016/S0038-092X(02)00025-7
Garboushian, V., Roubideaux, D., and Yoon, S. (1997). Integrated High-Concentration PV Near-Term Alternative for Low-Cost Large-Scale Solar Electric Power. Solar Energ. Mater. Solar Cell 47, 315–323. doi:10.1016/S0927-0248(97)00056-1
Honsberg, C. B., and Barnett, A. M. (2005). Paths to Ultra-high Efficiency (>50% Efficient) Photovoltaic Devices. 20th Eur. Photovolt Sol. Energ. Conf, 453–456.
Labouret, A., and Villoz, M. (2010). Solar Photovoltaic Energy. Sol. Photovolt Energ., 1–373. doi:10.1049/pbrn009e
Layton, B. E. (2008). A Comparison of Energy Densities of Prevalent Energy Sources in Units of Joules Per Cubic Meter. Int. J. Green Energ. 5, 438–455. doi:10.1080/15435070802498036
Lorenzo, E., and Luque, A. (1982). Comparison of Fresnel Lenses and Parabolic Mirrors as Solar Energy Concentrators. Appl. Opt. 21, 1851. doi:10.1364/ao.21.001851
Mendelsohn, M., Lowder, T., and Canavan, B. (2014). Utility-Scale Concentrating Solar Power and Photovoltaic Projects: A Technology and Market Overview. Util Sol. Install Background, Policies, Financ. Struct., 1–68. doi:10.2172/1039803
Rabl, A. (1976). Comparison of Solar Concentrators. Solar Energy 18, 93–111. doi:10.1016/0038-092X(76)90043-8
Whang, A. J.-W., Chen, Y.-Y., and Wu, B.-Y. (2009). Innovative Design of Cassegrain Solar Concentrator System for Indoor Illumination Utilizing Chromatic Aberration to Filter Out Ultraviolet and Infrared in Sunlight. Solar Energy 83, 1115–1122. doi:10.1016/j.solener.2008.12.013
William, B. (2011). Stine and Michael Geyer. Power from the Sun 2011. Available at: https://www.powerfromthesun.net/Book/chapter08/chapter08.html.
Keywords: Cassegrain solar concentrator, high concentrated photovoltaics, Monte Carlo ray-tracing, concentration ratio, focal point
Citation: Oh SJ, Kim H and Hong Y (2021) Monte Carlo Ray-Tracing Simulation of a Cassegrain Solar Concentrator Module for CPV. Front. Energy Res. 9:722842. doi: 10.3389/fenrg.2021.722842
Received: 09 June 2021; Accepted: 02 September 2021;
Published: 05 October 2021.
Edited by:
Muhammad Burhan, King Abdullah University of Science and Technology, Saudi ArabiaReviewed by:
Muhammad Wakil Shahzad, Northumbria University, United KingdomIrfan Ullah, University of Management and Technology, Pakistan
Copyright © 2021 Oh, Kim and Hong. This is an open-access article distributed under the terms of the Creative Commons Attribution License (CC BY). The use, distribution or reproduction in other forums is permitted, provided the original author(s) and the copyright owner(s) are credited and that the original publication in this journal is cited, in accordance with accepted academic practice. No use, distribution or reproduction is permitted which does not comply with these terms.
*Correspondence: Seung Jin Oh, b2hzODY4MEBraXRlY2gucmUua3I=; Hyungchan Kim, a2ltaGNAa2l0ZWNoLnJlLmty
 Seung Jin Oh
 Hyungchan Kim*