 Qing Chen
 Rui Xie1
 Shengqi Zhang
 Fei Wang
- 1Key Laboratory of Far-shore Wind Power Technology of Zhejiang Province, Hangzhou, China
- 2Department of Mechatronic Engineering and Automation, Shanghai University, Shanghai, China
With the increase of the renewable energy penetration (REP) level in the interconnected power grid, the proportion of the grid-connected conventional synchronous generators reduces continuously, resulting in the decrease of the system inertia. The insufficient system inertia brings challenges to the system frequency stability. Battery energy storage systems (BESSs), regarded as the high-quality frequency regulation resource, play an important role in maintaining the frequency stability of the system with the high REP level. To configure the proper power of BESSs in system frequency regulation, a BESS power configuration scheme (PCS) considering the REP constraint is proposed in this paper. In particular, the process to obtain the REP boundary of the interconnected grid on the premise of system frequency stability is included in the PCS, and the optimal power configuration of the BESS is further determined on the analysis of the BESS impact on the REP boundary. Furthermore, a simulation model of the Australian five-area interconnected power grid is built in MATLAB/Simulink, and the proposed REP-constrained PCS is verified and analyzed. At last, the promising results show that the PCS can take full advantages of the BESS in frequency regulation and meet the system requirement of the frequency stability at a particular REP level.
Introduction
To reduce the greenhouse gas emission, replacing fossil energy generation by renewable energy generation (REG) has become an inevitable trend in the modern power grid. At the end of 2020, the capacity of the grid-connected REG including photovoltaic and wind generation reached 1300 GW, accounting for 9.4% of the total installed power generation capacity (Khan et al., 2021) all over the world. Unlike the conventional generators, REG connected to the power grid via power electronic converters cannot provide the system inertia and the frequency regulation support when a load disturbance occurs (De Carne et al., 2020). Meanwhile, the output of REG has high fluctuation and intermittency, which requires more active power reserves to maintain the system frequency stability. Also, the frequency stability issue becomes worse (Ortiz-Villalba et al., 2020; He et al., 2020), when REG is absorbed across control areas via the transmission lines in the interconnected power grid. Therefore, with the increase of the renewable energy penetration (REP) level, the frequency instability caused by the insufficient system inertia and the active power reserve becomes a distinct threat of the interconnected power grid. In addition, the blackouts in the United Kingdom on August 9, 2019 (Li et al., 2021), and in South Australia on September 28, 2016 (Yan et al., 2018), and the DC bipolar block in the Jinsu-Jiangsu region of East China on September 19, 2015 (Rahman et al., 2017), result from the system frequency instability.
Obviously, to restrict the REP level is the most effective way to maintain the frequency stability of the low-inertia system, but a huge waste of energy is by Yan et al. (2017) and Yang et al. (2020), and the maximum power point operation is used by Ochoa and Martinez (2017), Kumar et al. (2018), and Kumar et al. (2019) to enable REG to provide frequency regulation. The photovoltaic generator and wind turbine are operated below the maximum power point with virtual inertia controllers, and the active power reserved by battery storages is applied to system frequency regulation (Kumar et al., 2018; Kumar et al., 2019). In a study by Ochoa and Martinez (2017), a neuro-fuzzy controller is utilized to adjust the output power of the photovoltaic generator for frequency regulation without energy storage. However, the regulation capacity of REG has high randomness. Recently, battery energy storage systems (BESSs) have been recognized as a high-quality frequency regulation resource by both the academics and the industrialists (Xu and Bishop, 2016; Dozein and Mancarella, 2019; Yoo et al., 2020). Therefore, to meet the frequency stability requirement of the interconnected power grid with high REP level, the research on the BESS power configuration scheme (PCS) becomes a topic of concern.
Many literature studies focus on the economy in the BESS PCS. For example, Mantar Gundogdu et al. (2018) and Zhang et al. (2019) introduced BESS profit models of the frequency regulation service in the ancillary service market of the United Kingdom and the United States. The PCS developed by Chen et al. (2018) combines the market mechanism with the probability distribution of the frequency regulation demand. BESSs are enabled to make more profit by participating in both frequency regulation and energy arbitrage (Cheng and Powell, 2018), and the corresponding PCS determines the optimal configuration by a Markov decision process according to the real-time electricity price. However, those PCSs give priority to BESS profit, and the actual demand of system frequency regulation is ignored. To sum up, the profit priority–based PCS can be hardly applied in countries without mature electricity market.
To make the best use of BESS in frequency regulation, the PCS comprehensively considers the economy and system stability as mentioned in the following references. Specifically, a configuration–operation collaborative optimization method based on the mixed integer linear programming is proposed by Quan et al. (2019), considering the overall economic optimization of equipment planning and system operation. Similarly, Pan et al. (2020) used KKT conditions to combine the economy and stability optimization problems as a single one. Also, an optimal PCS presented by He et al. (2016) considers the BESS frequency regulation performance and BESS life. An energy management and optimization method for the BESS based on the dynamic SoC limit setting is introduced by Byrne et al. (2017). Although the system frequency stability is considered a constraint in the process of those PCSs, the system frequency instability cannot be completely avoided, as the economy optimization still has high priority.
Up to now, the research on the BESS PCS from the perspective of the system frequency stability is still insufficient. Primarily, the impact of REP level on the power system frequency stability is discussed by Meegahapola and Flynn (2010), Miller et al. (2011), and Wang et al. (2019). For example, Wang et al. (2019) indicated that the wind and photovoltaic generation can reduce the power system inertia, which further affects the frequency stability. Also, Meegahapola and Flynn (2010) and Miller et al. (2011) pointed out that areas with low system inertia face the worse frequency stability issue than other areas in the interconnected power grid, which leads to the decrease of the frequency nadir and severer frequency fluctuations under the same active power disturbances. Meanwhile, the frequency deviations within a certain range are allowed, and the standards of some countries have been given by Sun et al. (2020). Therefore, it is valuable to further explore the influence factors of frequency stability and the REP boundary of the interconnected grid.
Furthermore, BESSs play a positive role in improving the frequency regulation performance of the system. For example, a control strategy is introduced by Wen et al. (2016) in that fast-response BESS devices are used to maintain the frequency dynamic safety. Also, an adaptive SoC feedback control is designed by Tan and Zhang (2017), and BESSs are able to be applied in the coordinate control of the multi-timescale frequency deviations of the wind power plant. However, BESSs have a certain power in those research studies, and the quantitative analysis of the impact of BESSs on frequency stability is not included.
Therefore, the BESS PCS considering the REP constraint for the interconnected power grid is proposed in this paper. In detail, an REP boundary calculation method is presented on the condition of the system frequency stability. Also, the influence of BESS on the system frequency stability is quantified. Finally, the optimal BESS power configuration is achieved to enable the system meeting a particular REP level. The proposed PCS for the BESS can improve the renewable energy absorbing consumption in the interconnected power grid effectively. Meanwhile, the PCS can configure BESS power according to the actual requirement of system frequency regulation, which is beneficial to improving the comprehensive utilization rate of the BESS.
The rest of this paper is organized as follows. The framework of the interconnected power grid including the BESS is introduced in Framework of the Interconnected Power Grid Considering BESS. In Operation of the Penetration Level–Constrained PCS for BESS, the details about the REP-constrained PCS for the BESS are presented, and the performance of the proposed PCS is simulated in the Australian five-area power grid in Simulation and Discussion. This paper is summarized in Conclusion.
Framework of the Interconnected Power Grid Considering BESS
The equivalent dynamic model of the control area as shown in Figure 1 consists of several generators and BESSs. The model of the BESS can be equivalent to a first-order inertia block, according to Ramalingam et al. (2018) and Calero et al. (2021), and the conventional generator is constructed referring to Liang et al. (2018). Also, the frequency deviations ∆f caused by the system load fluctuations can be stabilized dynamically by the inertial response and frequency regulation from generators and BESSs. As a part of frequency regulation, the droop coefficients of Thermal Gen, Hydro Gen, and BESSs are denoted Rtg, Rhg, and RB, respectively. Particularly, the participation of the BESS in frequency regulation is indicated by the configuration factor α, which can be deduced by the BESS PCS. In addition, PAGC denotes the automatic generation control signal, M and D are the inertial constant and damping coefficient, and
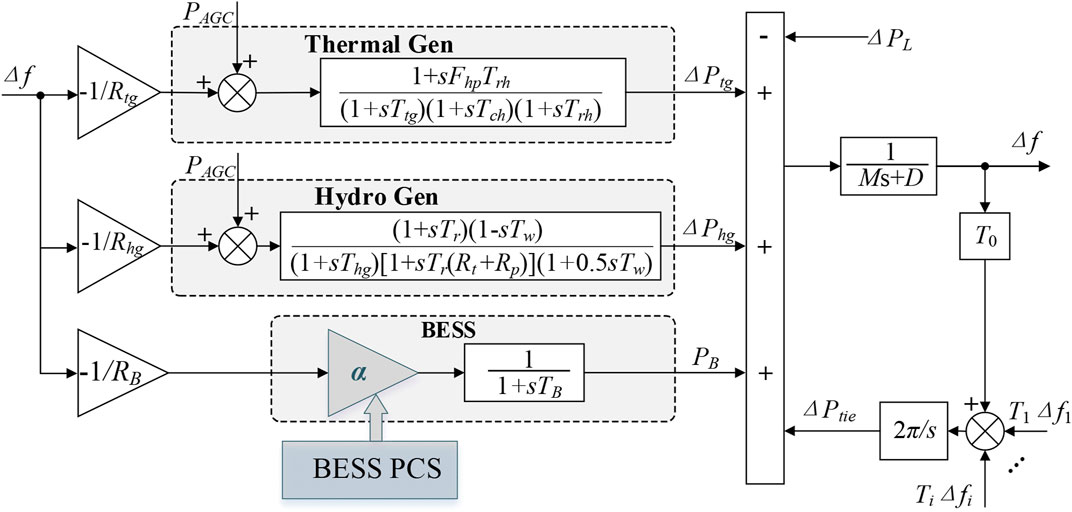
FIGURE 1. Dynamic model of a control area belonging to the interconnected power grid including the BESS PCS.
Dynamic Model of the Conventional Generators
The principles of Thermal Gen and Hydro Gen in frequency regulation are similar, but the dynamic models of those two Gens are different because of the different mechanical structures. The simplified dynamic model of Thermal Gen is shown in Figure 2A (Zhang et al., 2017), which consists of a governor and a steam turbine. In detail, the dynamic model of the governor consists of three parts: the frequency regulation dead zone, the droop coefficient, and the response delay, while the output is the opening change ΔY representing the steam valve of the steam turbine. The governor of Thermal Gen can determine whether the generator participates in frequency regulation by measuring the system frequency deviations, as long as ∆f cross the frequency dead band. Also, the governor can determine the adjustment degree of the control valve by setting the droop coefficient Rtg and the primary frequency regulation range according to the droop characteristics of the generator. The response delay of the governor is simulated as a first-order inertia model, and Ttg is the time constant of the governor. Meanwhile, in the model of the steam turbine, Tch, Trh, and Fhp are the adjustment response time, the time constant, and the gain coefficient of the reheater, respectively. Finally, the output value of the frequency regulation power ΔPtg is obtained considering the operation boundary of the generator.
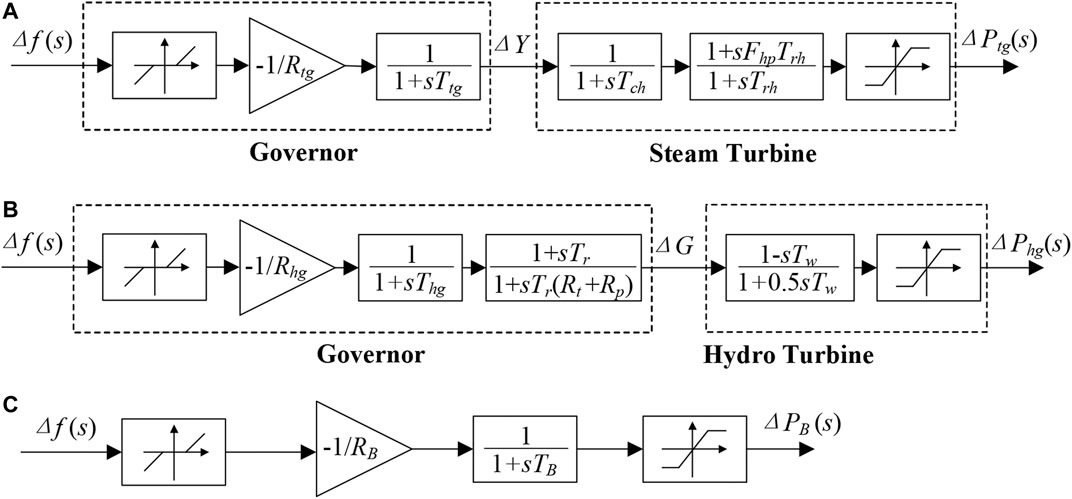
FIGURE 2. Dynamic models of frequency regulation units. (A) Dynamic model of Thermal Gen. (B) Dynamic model of Hydro Gen. (C) Dynamic model of the BESS.
Similarly, the dynamic model of Hydro Gen is composed of the governor and the hydro turbine, as shown in Figure 2B. Specifically, the governor consists of the frequency regulation dead zone, the droop coefficient, and the response delay. Referring to Alhejaj and Gonzalez-Longatt (2017), the transient parameters Tr and Rt are used to simulate the reverse variation of the mechanical power caused by the mechanical inertia of water. Also, Tw represents the required time for the water accelerating from standstill to velocity V0 in the hydro turbine model. At last, according to the above analysis, the transfer functions Gtg and Ghg of Thermal Gen and Hydro Gen can be derived as follows:
Dynamic Model of BESS
To represent the external characteristics of the BESS participating in the load frequency control, the dynamic model of the BESS can be expressed as a first-order inertial control block in Figure 2C. In the model, TB is the time constant used to describe the response time delay of the BESS (Kundur et al., 1994). Meanwhile, the droop coefficient 1/RB represents the proportional relationship between the BESS frequency regulation power and the system frequency deviations. Also, the blocks describing the BESS charging and discharging power range and BESS capacity boundaries are added. At last, the transfer function of BESS GB is shown as
Operation of the Penetration Level–Constrained PCS for BESS
The REP level–constrained PCS can dynamically determine the BESS frequency regulation power configuration coefficient α, based on the REP level the power system is required to absorb and the frequency stability requirements. And the PCS can further realize the power configuration of the BESS participating in system frequency regulation. The process of the REP level–constrained PCS is shown in Figure 3. In general, the PCS for the BESS includes the system REP level calculation (RLC) block and BESS power configuration (BPC) block. More details about the proposed PCS are introduced below.
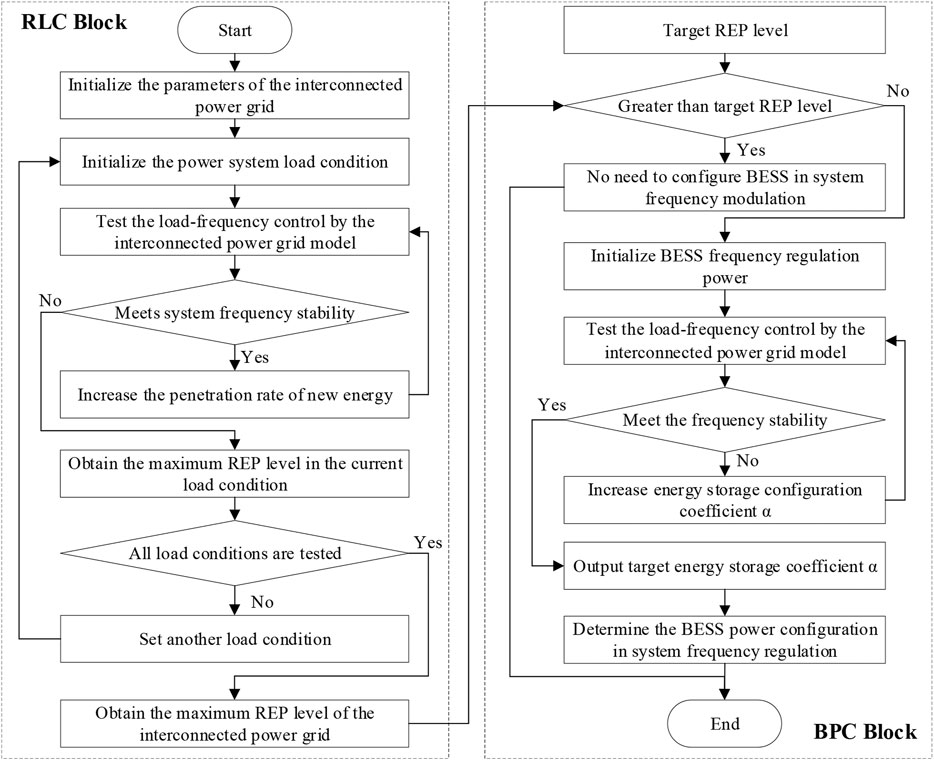
FIGURE 3. Process of the penetration level–constrained PCS for the BESS.
REP Level Calculation Block
In the interconnected power grid, the power mismatch between the generation and the load leads to the system frequency deviations, which is the key index of the system stability. The traditional generators can stop the frequency drop (Δfnadir) and stabilize the frequency around the nominal value (50 or 60 Hz) after a short while, through their own inertia control and the frequency regulation control. To meet the severe active power unbalance of the power system, the under/overload-shedding mechanisms are triggered to maintain the system frequency stability.
Primarily, the conventional generators contribute to the system inertia, as their rotational speed is synchronous to the system frequency. Also, the relationship between the mechanical power, the electrical power, and the rotation speed of the synchronous generator is shown in Eq. 4. The expression of the system inertia is shown in Eqs 5, 6, which is a function of
where ΔPG is the mechanical power change of the conventional generators and the corresponding ΔPE is the electromagnetic power;
Unlike the conventional generator, renewable energy generation is unable to participate in frequency regulation because renewable energy generation does not have the rotational inertia and usually operates on its maximum power point. Meanwhile, with the increase of the REP level, the proportion of the traditional generators decreases. In other words, a downward trend in the overall inertia level of the power system leads to the insufficient frequency regulation capabilities and the instability of the system frequency. Therefore, the interconnected power grid has a limitation of REP.
The RLC block is used to calculate the REP boundary that the interconnected grid can withstand under the premise of system frequency stability. As shown in Figure 3, the PLC block sets the load condition in advance according to the power system parameters and introduces a large load disturbance to test the frequency stability. To observe the REP boundary, a series of tests about whether the system frequency deviations exceed the limitation under the same load disturbance event are applied by increasing the REP level step by step. Thus, the maximum REP level in a certain load condition is obtained. Furthermore, several typical load conditions are introduced one by one, and the maximum REP level of each load condition is determined. At last, the minimum REP level of the interconnected power grid is obtained by comparing the maximum REP levels in different load conditions.
BESS Power Configuration
A virtual droop control strategy is usually adopted for the BESS in the primary frequency regulation. In other words, the BESS can imitate the droop characteristic of the generator in response to the system frequency deviation. The dynamic model of the BESS including the virtual droop control strategy is introduced in Figure 2C. For the same frequency deviation, the power from the BESS
Based on the above theoretical analysis, the BESS participating in the primary frequency regulation can improve the ability of the power system to cope with the load deviations effectively. In this way, the aim of the REP level of the interconnected power grid can be guaranteed, and the system frequency deviation can always meet the system stability requirement when the load disturbance occurs under a certain configuration coefficient α. Thus, the optimal power configuration of the BESS can be deduced according to the configuration coefficient α.
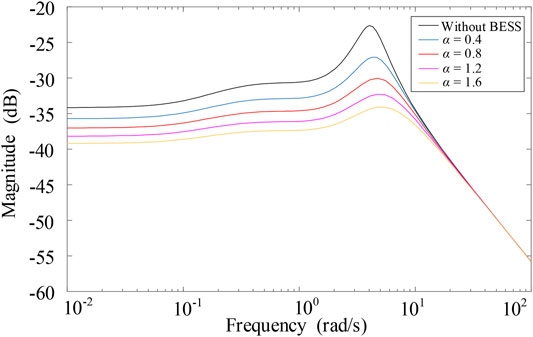
FIGURE 4. Amplitude–frequency characteristic curve.
The BPC block is used to calculate the minimum BESS charge and discharge power that can enable the control area to meet the aim of the REP level and frequency stability. As shown in Figure 3, the necessity of involving the BESS in frequency regulation is determined in the first place, by comparing whether the maximum REP levels are larger than the aim of the REP level of the control area. The BESS power configuration coefficient α is gradually increased, when the aim of the REP level cannot be met. A series of tests are applied until the system frequency stability of the control area with the target REP level is satisfied. Finally, according to the proper power configuration coefficient α, the optimal BESS power configuration that meets the frequency stability of the region is obtained.
Simulation and Discussion
The Australian power grid is regarded as one of the longest interconnected power grids, as shown in Figure 5, and can be generally simplified as a 5-area 14-bus system. The maximum power generation capacity of the system is 25,430 MW, while the maximum load demand is 24,800 MW. According to the Australian state layout, Area #2 (New South Wales) and Area #3 (Victoria) are typical load centers and Area #4 (Queensland) and Area #5 (South Australia) are rich in solar energy and wind energy resources, respectively. Thus, the feasibility of the REP level–constrained PCS for the BESS is verified based on the Australian power grid, as it is a typical interconnected power grid with high REP.
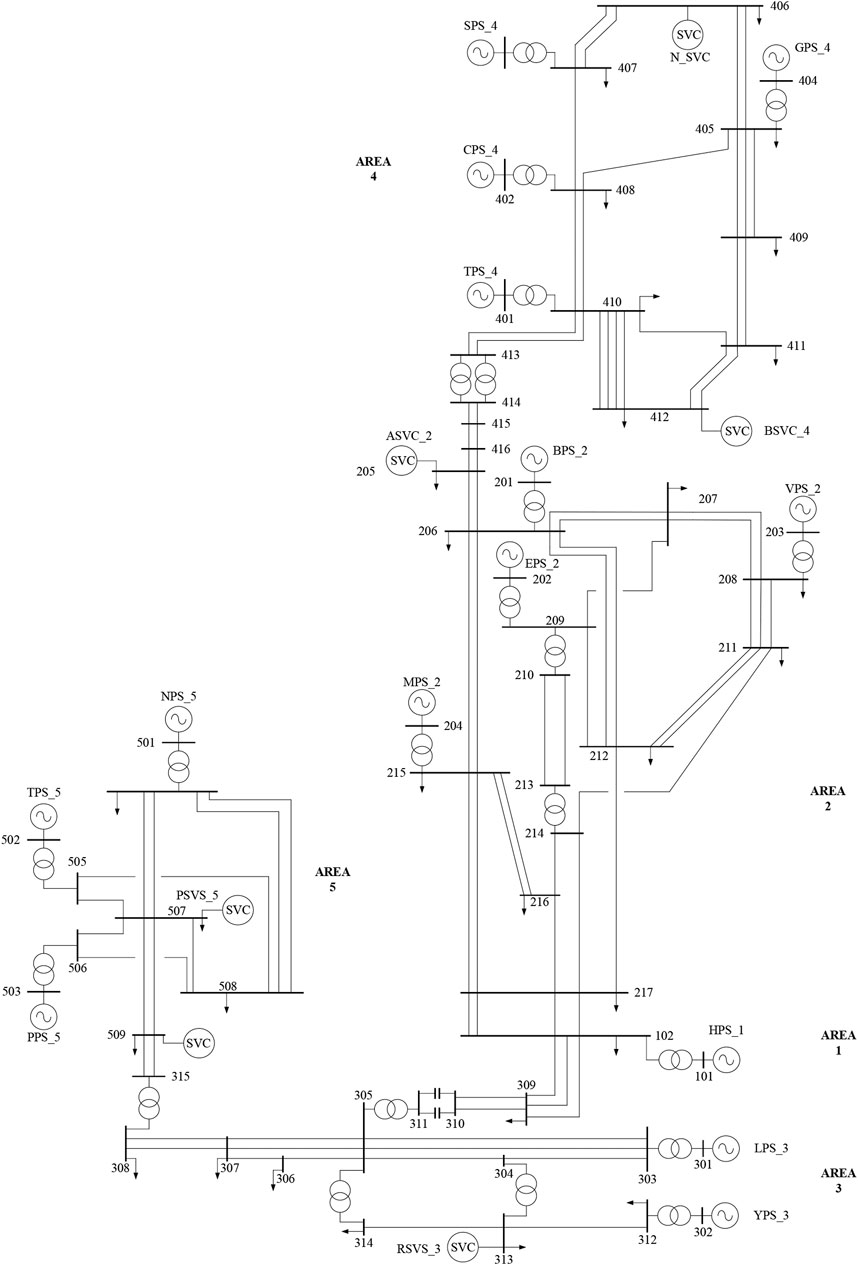
FIGURE 5. Australian 5-area 14-bus power grid.
The dynamic model of the Australian interconnected power grid in MATLAB/Simulink is shown in Figure 6 based on the system data (Gibbard and Vowles, 2010) in Table 1, including the traditional generators, renewable generators, and BESSs in each area. To consider the actual operation of the Australian power grid, five typical load scenarios (Gibbard and Vowles, 2010) are formulated in Table 2, which are the peak scenario, heavy scenario, medium heavy scenario, medium scenario, and light scenario. Furthermore, a positive P42 means the active power flows from Area #4 to Area #2, and the negative one means the opposite power flow. P21, P13, and P35 follow the same rules. In addition, Area #2 and Area #4 are chosen as examples to configure the BESS verifying the influence of BESS on system frequency control in the load center and the renewable generation center.
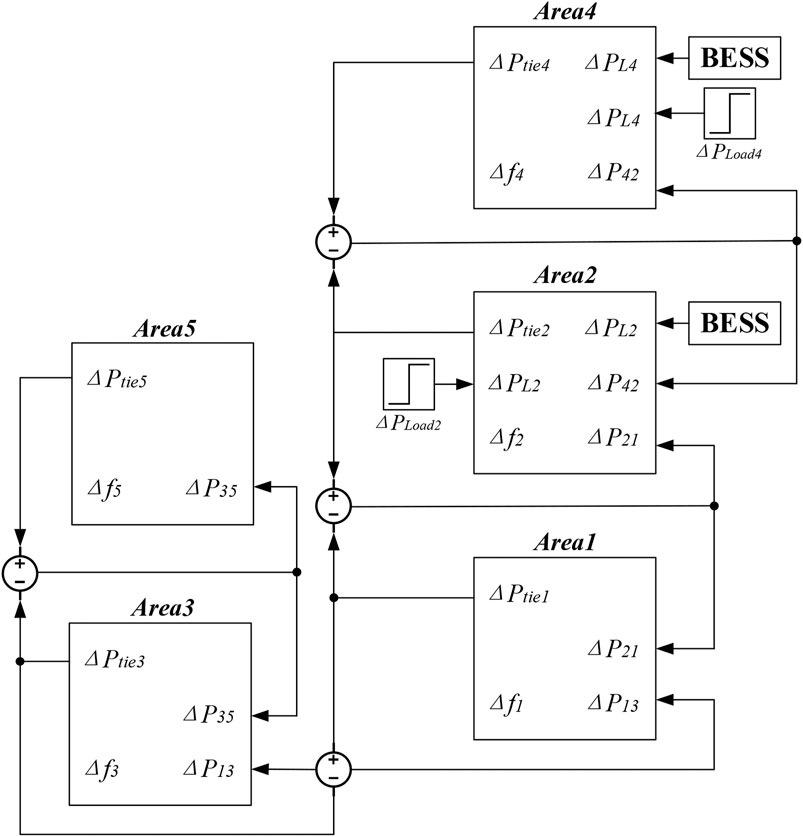
FIGURE 6. Dynamic model of the Australian five-area power grid.
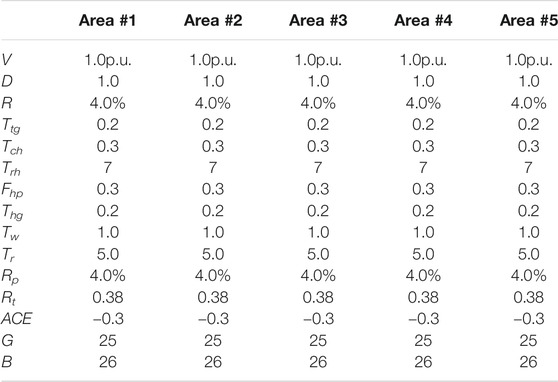
TABLE 1. Characteristic parameters of the Australian five-area power grid.
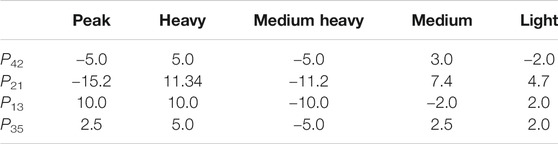
TABLE 2. Power transmission under different load scenarios (p.u.).
Feasibility of RLC Block
Based on the former theoretical analysis, the inertia of the control area decreases with the increase of the REP level, which results in the system frequency instability. In the simulation, a fixed step load disturbance of ±5% p.u. occurred in the control area, and none of frequency deviations exceeding ±0.25 Hz is defined as the system frequency stability. Also, the frequency recovery time is neglected as the indication of the system frequency stability because the response time of the BESS is faster than that of the traditional generators. The REP boundary of the control area is calculated by increasing the REP level of Area #2 and Area #4 from 0 gradually, until the constraint of frequency stability is no longer satisfied. In the heavy load scenario, the frequency deviations of the load center Area #2 and the renewable generation center Area #4 are shown in Figures 7A,B, while the performance of the frequency fluctuations is indicated in Tables 3, 4.
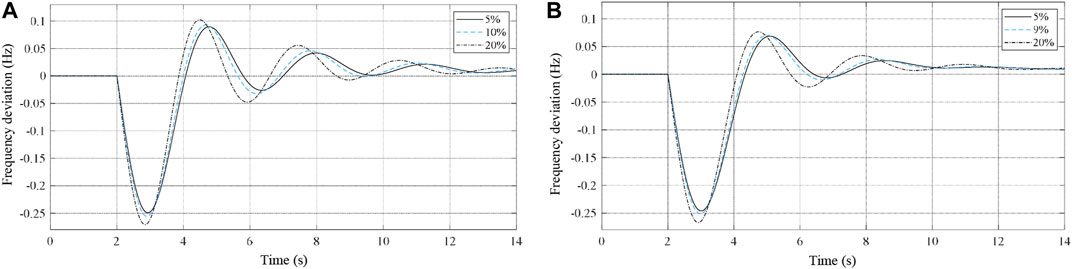
FIGURE 7. Frequency fluctuations under different REP levels. (A) Frequency fluctuations of Area #2 under different REP levels. (B) Frequency fluctuations of Area #4 under different REP levels.
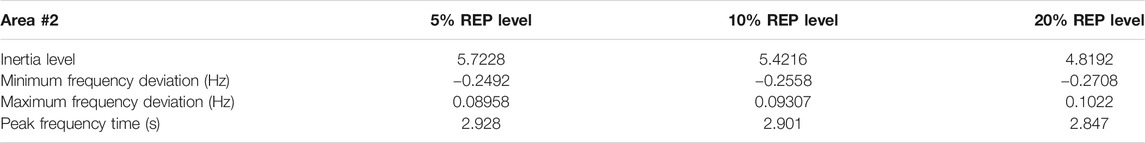
TABLE 3. Frequency response performance of Area #2 under different REP levels.
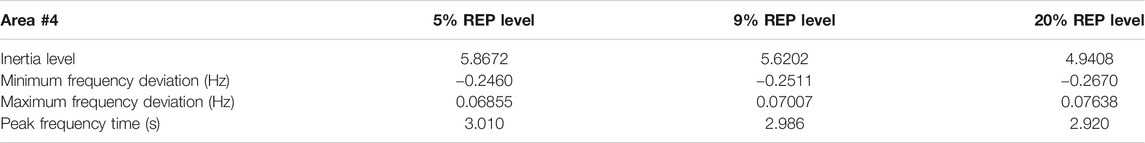
TABLE 4. Frequency response performance of Area #4 under different REP levels.
In detail, the system frequency of the load center Area #2 becomes unstable when the REP level reaches 5%, and the REP boundary of the area is 5%. Similarly, the renewable generation center Area #4 has an REP boundary of 9%. Thus, with the decrease of the system inertia, Δfnadir continues to approach the system stability limit ±0.25 Hz. Also, the rate of change of frequency and the time to achieve the frequency recovery increase.
Specifically, Area #4 and Area #2 are regarded as the renewable generation center and the load center, respectively, and the grid-connected traditional generators in the heavy load scenario provide more system inertia in the renewable generation center Area #4. Meanwhile, Area #2 transfers more power to the load center through the tie line, and part of the renewables is absorbed actually in the load center Area #2. Thus, the boundary of the REP level of the renewable generation center Area #4 is higher than that of the load center Area #2.
Furthermore, as the REP level of the load center is set to 5%, Area #2 can meet the requirements of frequency stability in the heavy load scenario. Another four load scenarios from Table 2 are tested, and the frequency fluctuations are shown in Figure 8A. The maximum Δfnadir of Area #2 does not exceed ±0.25 Hz in heavy and medium load scenarios but goes across the limitation in peak, medium heavy, and light scenarios. Similarly, considering the REP level of the renewable generation center Area #4 as 9%, the simulation results of five different load scenarios are shown in Figure 8B. Similar simulation results are obtained such that the REP boundary of a control area changes according to the load scenarios.
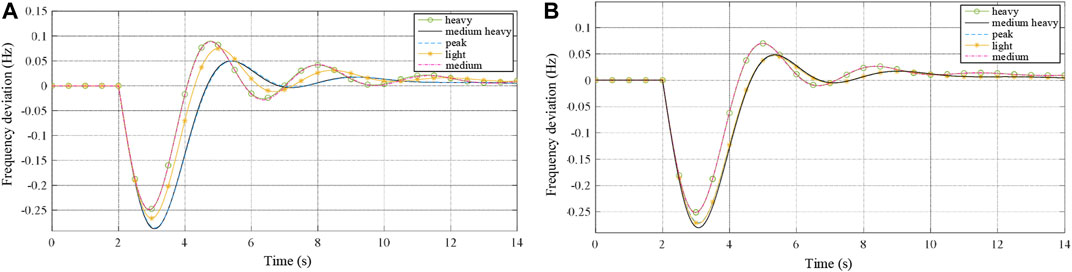
FIGURE 8. Frequency fluctuations under different load scenarios. (A) Frequency fluctuations of Area #2 under different load scenarios. (B) Frequency fluctuations of Area #4 under different load scenarios.
At last, considering the comprehensive effectiveness of the system inertia and load scenarios on the system frequency stability, the REP boundaries of five control areas are shown in Table 5, according to the calculation process of the RLC block. Obviously, the REP level cannot be satisfied in both load centers and renewable generation centers, and it is necessary to configure the BESS to improve the REP level.
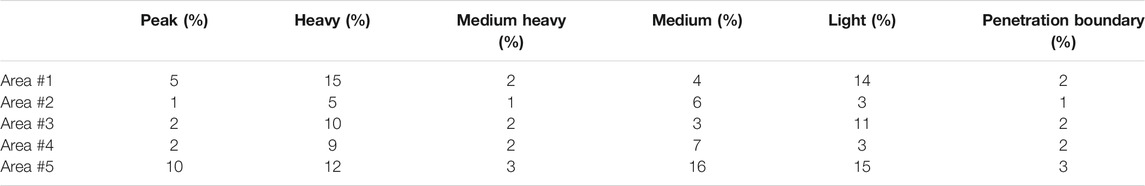
TABLE 5. REP boundary of each control area.
Performance of BPC Block
Based on the former theoretical analysis, BESSs have high control accuracy and fast response speed, which can improve the system frequency stability by mitigating the frequency deviation quickly. To verify the effectiveness of the BPC block, optimal BESS power is configured in both the load center and the renewable energy generation center.
The target of the REP levels of load centers and renewable generation centers is set to 5 and 10%, respectively. According to the results in Table 3, the smallest REP levels of Area #2 and Area #4 occur under the medium heavy load scenario. Thus, to achieve the setting REP level, BPC block calculation is applied by increasing the configuration coefficient α gradually, and the simulation results of the frequency fluctuations are shown in Figures 9A,B.
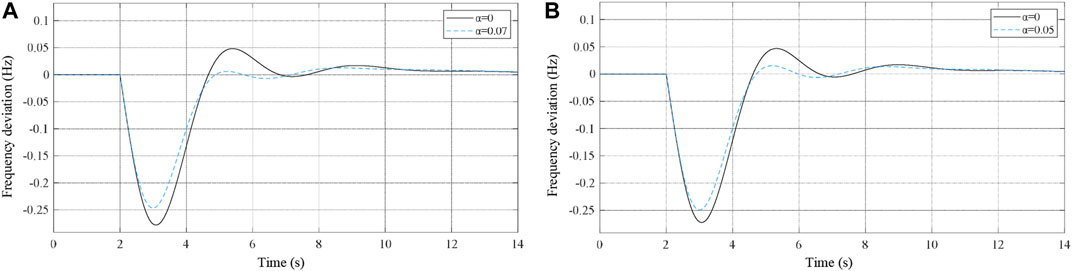
FIGURE 9. Frequency fluctuations considering different BESS configuration coefficients. (A) Frequency fluctuations of Area #2 considering different BESS configuration coefficients. (B) Frequency fluctuations of Area #4 considering different BESS configuration coefficients.
In particular, the maximum Δfnadir of Area #2 and Area #4 exceeds the frequency limitation, if BESSs are not equipped in areas. Meanwhile, the maximum Δfnadir decreases gradually and reaches within ±0.25 Hz eventually with the increase of BESS configuration coefficients. The system frequency fluctuations are mitigated in a shorter period. Thus, the performance of system frequency regulation improves significantly with BESS involvement. Finally, the configuration parameters of BESSs are obtained based on the target REP levels, and the results are shown in Table 6. To sum up, the target REP levels are achieved by the proposed PCS for the BESS.
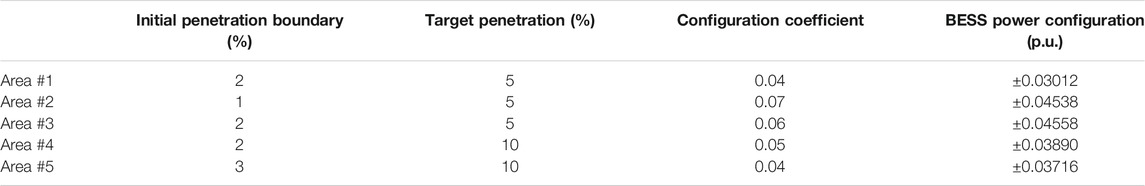
TABLE 6. Parameters of BESS power configuration for five control areas.
Conclusion
This paper proposes a BESS PCS considering the REP constraint on the premise of system frequency stability. At the beginning, the dynamic models of Thermal Gen, Hydro Gen, and BESSs are established. The REP-constrained PCS can dynamically determine the BESS power configuration by comparing the target REP levels and the REP boundaries of each control area in different load scenarios. A model of the Australian five-area interconnected power grid is established in MATLAB/Simulink to verify the effectiveness of the PCS, and the suggested BESS power for each control area is obtained. Therefore, high REP level can be achieved in the future, as the BESS mitigates the system frequency fluctuations effectively, and the proposed PCS indicates the optimal BESS power. In addition, the implementation of the BESS is not only for frequency regulation but also for the way to configure BESS power in multiple purposes, which will be discussed in further work.
Data Availability Statement
The original contributions presented in the study are included in the article/supplementary material, and further inquiries can be directed to the corresponding author.
Author Contributions
QC proposed the concept of the project, and FW acted as the project administrator. YC and HL designed the system model and established the details of the power configuration scheme. ZS and BL analyzed the data and carried out the simulation. RX and SZ contributed to funding acquisition and writing the paper. All authors approved the submitted version.
Funding
This work was supported by the Key Laboratory Open Fund of Far-shore Wind Power Technology of Zhejiang Province (ZOE2020008) and the Jiangsu Natural Science Foundation (BK20180391).
Conflict of Interest
The authors declare that the research was conducted in the absence of any commercial or financial relationships that could be construed as a potential conflict of interest.
References
Alhejaj, S. M., and Gonzalez-Longatt, F. M. (2016). “Impact of Inertia Emulation Control of Grid-Scale BESS on Power System Frequency Response,” in 2016 Int. Conf. Students Appl. Eng. ICSAE (IEEE), 254–258. doi:10.1109/ICSAE.2016.7810198
Byrne, R. H., Nguyen, T. A., Copp, D. A., Chalamala, B. R., and Gyuk, I. (2018). Energy Management and Optimization Methods for Grid Energy Storage Systems. IEEE Access 6, 13231–13260. doi:10.1109/ACCESS.2017.2741578
Calero, F., Canizares, C. A., and Bhattacharya, K. (2021). Dynamic Modeling of Battery Energy Storage and Applications in Transmission Systems. IEEE Trans. Smart Grid 12, 589–598. doi:10.1109/TSG.2020.3016298
Chen, P., Tao, S., Xiao, X., and Li, L. (2018). Uncertainty Level of Voltage in Distribution Network: An Analysis Model with Elastic Net and Application in Storage Configuration. IEEE Trans. Smart Grid 9, 2563–2573. doi:10.1109/TSG.2016.2614547
Cheng, B., and Powell, W. (20161997–2005). Co-Optimizing Battery Storage for the Frequency Regulation and Energy Arbitrage Using Multi-Scale Dynamic Programming. IEEE Trans. Smart Grid 9, 1. doi:10.1109/TSG.2016.2605141
De Carne, G., Buticchi, G., Liserre, M., and Vournas, C. (2020). “Real-Time Primary Frequency Regulation Using Load Power Control by Smart Transformers,” in 2020 IEEE Power & Energy Society General Meeting (PESGM) (IEEE), 1. doi:10.1109/PESGM41954.2020.9281635
Dozein, M. G., and Mancarella, P. (2019). “Frequency Response Capabilities of Utility-Scale Battery Energy Storage Systems, with Application to the August 2018 Separation Event in Australia,” in 2019 9th International Conference on Power and Energy Systems (ICPES) (IEEE), 1–6. doi:10.1109/ICPES47639.2019.9105646
Gibbard, M., and Vowles, D. (2010). Simplyfied 14-generator Model of the SE Australian Power System.
He, G., Chen, Q., Kang, C., Pinson, P., and Xia, Q. (2016). Optimal Bidding Strategy of Battery Storage in Power Markets Considering Performance-Based Regulation and Battery Cycle Life. IEEE Trans. Smart Grid 7, 2359–2367. doi:10.1109/TSG.2015.2424314
He, X., Chu, L., Qiu, R. C., Ai, Q., Ling, Z., and Zhang, J. (2020). Invisible Units Detection and Estimation Based on Random Matrix Theory. IEEE Trans. Power Syst. 35, 1846–1855. doi:10.1109/TPWRS.2019.2935739
Khan, F. H., Pal, T., Kundu, B., and Roy, R. (2021). “Wind Energy: A Practical Power Analysis Approach,” in 2021 Innovations in Energy Management and Renewable Resources(52042) (IEEE), 1–6. doi:10.1109/IEMRE52042.2021.9386754
Kumar, N., Hussain, I., Singh, B., and Panigrahi, B. K. (2018). Self-Adaptive Incremental Conductance Algorithm for Swift and Ripple-free Maximum Power Harvesting from PV Array. IEEE Trans. Ind. Inf. 14, 2031–2041. doi:10.1109/TII.2017.2765083
Kumar, N., Singh, B., and Panigrahi, B. K. (2019). Integration of Solar PV with Low-Voltage Weak Grid System: Using Maximize-M Kalman Filter and Self-Tuned P&O Algorithm. IEEE Trans. Ind. Electron. 66, 9013–9022. doi:10.1109/TIE.2018.2889617
Kundur, P., Balu, N. J., and Lauby, M. G. (1994). Power System Stability and Contol. New York, NY, USA: McGraw-Hill Education.
Li, T., Li, Y., Li, S., and Zhang, W. (2021). Research on Current-Limiting Control Strategy Suitable for Ground Faults in AC Microgrid. IEEE J. Emerg. Sel. Top. Power Electron. 9, 1736–1750. doi:10.1109/JESTPE.2020.2983726
Liang, C., Wang, P., Han, X., Qin, W., Jia, Y., and Yuan, T. (2018). Battery Energy Storage Selection Based on a Novel Intermittent Wind Speed Model for Improving Power System Dynamic Reliability. IEEE Trans. Smart Grid 9, 6084–6094. doi:10.1109/TSG.2017.2703578
Mantar Gundogdu, B., Nejad, S., Gladwin, D. T., Foster, M. P., and Stone, D. A. (2018). A Battery Energy Management Strategy for U.K. Enhanced Frequency Response and Triad Avoidance. IEEE Trans. Ind. Electron. 65, 9509–9517. doi:10.1109/TIE.2018.2818642
Meegahapola, L., and Flynn, D. (2010). “Impact on Transient and Frequency Stability for a Power System at Very High Wind Penetration,” in IEEE PES Gen. Meet. PES, Minneapolis, MN, USA (IEEE), 1–8. doi:10.1109/PES.2010.5589908
Miller, N. W., Clark, K., and Shao, M. (2011). “Frequency Responsive Wind Plant Controls: Impacts on Grid Performance,” in 2011 IEEE Power and Energy Society General Meeting (IEEE), 1–8. doi:10.1109/PES.2011.6039137
Ochoa, D., and Martinez, S. (2017). Fast-Frequency Response provided by DFIG-Wind Turbines and its Impact on the Grid. IEEE Trans. Power Syst. 32, 4002–4011. doi:10.1109/TPWRS.2016.2636374
Ortiz-Villalba, D., Rahmann, C., Alvarez, R., Canizares, C. A., and Strunck, C. (2020). Practical Framework for Frequency Stability Studies in Power Systems with Renewable Energy Sources. IEEE Access 8, 202286–202297. doi:10.1109/ACCESS.2020.3036162
Pan, G., Gu, W., Lu, Y., Qiu, H., Lu, S., and Yao, S. (2020). Optimal Planning for Electricity-Hydrogen Integrated Energy System Considering Power to Hydrogen and Heat and Seasonal Storage. IEEE Trans. Sustain. Energ. 11, 2662–2676. doi:10.1109/TSTE.2020.2970078
Quan, R., Li, G., Jin, G., Liu, Z., and Chen, Q. (2019). “Multi-objective Optimal Dispatch Method Based on Source-Network-Load-Storage Interaction System for DC Distribution Network,” in IET Conf. Publ, Shanghai, China (IET), 1–8. doi:10.1049/cp.2019.0363
Rahman, K. M. J., Munnee, M. M., and Khan, S. (2016). “Largest Blackouts Around the World: Trends and Data Analyses,” in WIECON-ECE 2016 - 2016 IEEE Int. WIE Conf. Electr. Comput. Eng., Pune, India (IEEE), 155–159. doi:10.1109/WIECON-ECE.2016.8009108
Ramalingam, G., Choudhary, A. K., and Mikkili, S. (2018). “Modeling and Analysis of a PV-Based Shunt Active Filter with BESS for Power Quality Enhancement under Dynamic Load Conditions,” in INDICON 2018 - 15th IEEE India Counc. Int. Conf. 0, Coimbatore, India (IEEE). doi:10.1109/INDICON45594.2018.8987181
Sun, M., Xie, G., Chen, L., Liu, Y., Li, X., and Min, Y. (2020). “Study on the Necessity and Role of Inertia in Power System Frequency Response,” in 2020 IEEE 4th Conference on Energy Internet and Energy System Integration (EI2) (IEEE)), 155–159. doi:10.1109/EI250167.2020.9347330
Tan, J., and Zhang, Y. (2017). Coordinated Control Strategy of a Battery Energy Storage System to Support a Wind Power Plant Providing Multi-Timescale Frequency Ancillary Services. IEEE Trans. Sustain. Energ. 8, 1140–1153. doi:10.1109/TSTE.2017.2663334
Wang, D., Rueda Torres, J. L., Perilla, A., Rakhshani, E., Palensky, P., and Van Der Meijden, M. A. A. M. (2019). Enhancement of Transient Stability in Power Systems with High Penetration Level of Wind Power Plants. IEEE Milan PowerTech, 2–7. doi:10.1109/PTC.2019.8810696
Wen, Y., Li, W., Huang, G., and Liu, X. (2016). Frequency Dynamics Constrained Unit Commitment with Battery Energy Storage. IEEE Trans. Power Syst. 31, 5115–5125. doi:10.1109/TPWRS.2016.2521882
Xu, X., Bishop, M., Bishop, M., Donna G, O., and Chen, H. (2016). Application and Modeling of Battery Energy Storage in Power Systems. Csee Jpes 2, 82–90. doi:10.17775/cseejpes.2016.00039
Yan, B., Luh, P. B., Warner, G., Zhang, P., and Member, S. (2017). Operation and Design Optimization of Microgrids with Renewables. IEEE Trans. Automat. Sci. Eng. 14, 573–585. doi:10.1109/TASE.2016.2645761
Yan, R., -Masood, N.-A., Kumar Saha, T., Bai, F., and Gu, H. (2018). The Anatomy of the 2016 South Australia Blackout: A Catastrophic Event in a High Renewable Network. IEEE Trans. Power Syst. 33, 5374–5388. doi:10.1109/TPWRS.2018.2820150
Yang, B., Cao, X., Cai, Z., Yang, T., Chen, D., Gao, X., et al. (2020). Unit Commitment Comprehensive Optimal Model Considering the Cost of Wind Power Curtailment and Deep Peak Regulation of Thermal Unit. IEEE Access 8, 71318–71325. doi:10.1109/ACCESS.2020.2983183
Yoo, Y., Jung, S., and Jang, G. (2020). Dynamic Inertia Response Support by Energy Storage System with Renewable Energy Integration Substation. J. Mod. Power Syst. Clean. Energ. 8, 260–266. doi:10.35833/MPCE.2018.000760
Zhang, G., Ela, E., and Wang, Q. (2019). Market Scheduling and Pricing for Primary and Secondary Frequency Reserve. IEEE Trans. Power Syst. 34, 2914–2924. doi:10.1109/TPWRS.2018.2889067
Zhang, S., Mishra, Y., and Shahidehpour, M. (2017). Utilizing Distributed Energy Resources to Support Frequency Regulation Services. Appl. Energ. 206, 1484–1494. doi:10.1016/j.apenergy.2017.09.114
Nomenclature
ACE Area control error
B Secondary frequency regulation coefficient
BESS Battery energy storage system
BPC BESS power configuration
D Load damping coefficient
Fhp Gain coefficient of the reheater
Δfnadir Frequency drop
G Governor constant
GB Transfer function of the BESS
Ghg Transfer functions of Hydro Gen
Gtg Transfer functions of Thermal Gen
H Inertia constant of the synchronous generator
HB(s) Amplitude–frequency characteristic function with the BESS
HG(s) Amplitude–frequency characteristic function without BESS
M Generator inertia constant
PAGC Automatic generation control signal
PCS Power configuration scheme
R Speed regulation constant
RB Droop coefficients of the BESS
REG Renewable energy generation
REP Renewable energy penetration
Rhg Droop coefficients of Hydro Gen
RLC REP level calculation
Rt Transient parameters used to simulate the reverse variation of the mechanical power
Rtg Droop coefficients of Thermal Gen
TB Time constant used to describe the response time delay of the BESS
Tch Adjustment response time of the reheater
Thg Time constant of the hydro governor
Ti Synchronizing torque coefficient between adjacent areas
Tr Transient parameters used to simulate the mechanical inertia of water
Trh Time constant of the reheater
Ttg Time constant of the thermal governor
Tw Required time for the water accelerating from standstill to velocity V0 in the hydro turbine model
V Voltage magnitude
α Energy storage configuration factor
Δf Frequency deviations
Δfi Frequency deviations in the ith adjacent area
PB Output value of the frequency regulation power of the BESS
ΔPE Electrical power variation of the generator set
ΔPG Mechanical power variation of the generator set
ΔPhg Output value of the frequency regulation power of Hydro Gen
ΔPL Net load power fluctuations
ΔPL(s) Frequency-sensitive load change
ΔPtg Output value of the frequency regulation power of Thermal Gen
ΔPtie Power exchanged from other areas through the tie lines
ΔY Opening variation of the steam valve of the steam turbine
Δω Generator angular frequency deviation
ωr Generator rotor speed
Keywords: renewable energy penetration, battery energy storage system, interconnected power grid, system frequency stability, system inertia
Citation: Chen Q, Xie R, Chen Y, Liu H, Zhang S, Wang F, Shi Z and Lin B (2021) Power Configuration Scheme for Battery Energy Storage Systems Considering the Renewable Energy Penetration Level. Front. Energy Res. 9:718019. doi: 10.3389/fenrg.2021.718019
Received: 31 May 2021; Accepted: 14 June 2021;
Published: 16 July 2021.
Edited by:
Xing He, Shanghai Jiao Tong University, ChinaReviewed by:
Zhendong Ji, Nanjing University of Science and Technology, ChinaWenchao Miao, The University of Hong Kong, China
Copyright © 2021 Chen, Xie, Chen, Liu, Zhang, Wang, Shi and Lin. This is an open-access article distributed under the terms of the Creative Commons Attribution License (CC BY). The use, distribution or reproduction in other forums is permitted, provided the original author(s) and the copyright owner(s) are credited and that the original publication in this journal is cited, in accordance with accepted academic practice. No use, distribution or reproduction is permitted which does not comply with these terms.
*Correspondence: Shengqi Zhang, c2hlbmdxaV96aGFuZzg4MTZAMTYzLmNvbQ==