 Jindi Hu
 Weibin Yin2
 Chengjin Ye
 Yi Ding
- 1College of Electrical Engineering, Zhejiang University, Hangzhou, China
- 2State Grid Jiaxing Power Supply Company, Jiaxing, China
- 3State Grid Yiwu Power Supply Company, Yiwu, China
Due to the high proportion of renewable energies, traditional voltage regulation methods such as on-load tap changers (OLTCs) and switching capacitors (SCs) are currently facing the challenge of providing fast, step-less, and low-cost reactive power to reduce the increasing risks of voltage violations in distribution networks (DNs). To meet such increasing demand for voltage regulation, smart inverters, including photovoltaics (PVs) and electric vehicle (EV) chargers, stand out as a feasible approach for reactive power compensation. This paper aims to assess the voltage violation risks in DNs considering the reactive power response of smart inverters. Firstly, reactive power compensation models of PVs and EV chargers are investigated and voltage deviation indexes of the regulation results are proposed. Moreover, kernel density estimation (KDE) and slice sampling are adopted to provide the PV output and EV charging demand samples. Then, the risk assessment is carried out with a voltage regulation model utilizing OLTCs, SCs, and available smart inverters. Numerical studies demonstrate that the reactive power support from smart inverters can significantly mitigate the voltage violation risks and reduce the switching and cost of OLTCs and capacitors in DNs.
1 Introduction
The development of power electronics in distribution networks (DNs) brings prosperity for distributed photovoltaics (PVs), electric vehicle (EV) chargers, and other devices with AC-DC inverters. However, DNs are more prone to voltage violation problems nowadays because of the uncertainty of PV outputs and the load impact of EV charging (Kekatos et al., 2015). Traditional reactive power compensation facilities such as on-load tap changers (OLTCs) and switching capacitors (SCs) are only able to provide step-wise and high-delay reactive power at the feeder head, which limits the regulation effect (Kekatos et al., 2015), while the high cost of Distribution Static Synchronous Compensators (D-STATCOMs) restricts its application in DNs (Chen et al., 2018). Therefore, it is of vital importance to implement step-less compensation facilities at the feeder terminal.
Meanwhile, the two-way reactive power ability of smart inverters (i.e., PVs and EV chargers in this paper) enables these terminal end power electronics in DNs to participate in voltage regulation. There have already been some investigations to achieve reactive power delivery from smart inverters. Sharma and Das (2020) and Feng et al. (2018) extend the reactive power exchange for PV inverters and help to balance the active and reactive power transmission of each phase. Buja et al. (2017) analyze and validate the reactive power compensation abilities of EV chargers theoretically and experimentally. Moreover, Varma and Siavashi (2018), Abeywardana et al. (2018), and Kesler et al. (2014) point out that the reactive power compensation process of PVs and EV chargers does not intervene in the active power delivery or cause damage to EV batteries, which expands the implementation of EV chargers to a large extent. To integrate these flexible power electronics, Varma and Siavashi (2018) present a novel smart inverter PV-STATCOM which controls PV inverters as a dynamic reactive power compensator. Furthermore, Singh et al. (2019) achieve voltage regulation through smart inverters of PVs and EV charging stations in the global as well as local domain. Smart inverters have been well investigated and developed to compensate reactive power (Ustun et al., 2020; Gush et al., 2021). Therefore, it is feasible to resort to smart inverters for accurate and fast voltage regulation in DNs.
The application of smart inverters to regulate voltage quality has been investigated. Zeraati et al. (2019) develop a distributed voltage regulation scheme to utilize the reactive power capability of PV inverters. Quirós-Tortós et al. (2016) and Singh et al. (2019) achieve reactive power control in DNs with the support of EV chargers and PVs. However, the voltage regulation techniques using smart inverters are still under research and need practical implementations. Therefore, it is essential to assess the voltage regulation effects of smart inverters to provide references for the market price of their reactive power compensation.
To assess the reliability of power systems, the Monte Carlo simulation is usually utilized to sample from the target distribution when considering the uncertainty of renewable energies or power demands (Zhou et al., 2016). It is applicable for common Monte Carlo methods, such as importance sampling (Tómasson and Sö) and acceptance-rejection sampling (Hu et al., 2017), to sample from a standard target distribution. However, the irregular PV outputs and EV loads require non-parametric estimation techniques to acquire their probability density functions (PDFs) and more universal sampling methods suitable for any non-standard PDF (Huang et al., 2020). Slice sampling is an advanced method of Markov Chain Monte Carlo (MCMC) simulation (Neal, 2003). It is feasible for PV outputs and EV loads owing to its ability to sample from irregular PDFs efficiently.
Based on the above analysis, this paper proposes a voltage violation assessment model considering the participation of smart inverters. Samples of PV outputs and EV loads are generated. The voltage violation assessment is carried out to evaluate the performance of smart inverters. The main contributions of this paper can be summarized as two-fold:
1. The quantitative compensation ability assessment of smart inverters is proposed with the available reactive power capacities under active power constraints. The optimization model for voltage regulation is established considering both traditional reactive power compensation facilities and smart inverters.
2. The voltage violation assessment under the uncertainty of PV outputs and EV behaviors is achieved based on the proposed voltage deviation indexes, non-parametric kernel density estimation (KDE), and slice sampling. The non-standard PDFs of PVs and EVs are fitted accurately by KDE. Besides, the automated step width selection for slice sampling is adopted to efficiently generate samples from the obtained PDFs. The results demonstrate that smart inverters have better voltage regulation effects and are able to reduce the operation cost of OLTCs and SCs.
The remaining of this paper is organized as follows. Section 2 describes the basic models and voltage deviation indexes for voltage regulation. KDE and slice sampling are introduced in Section 3. Section 4 illustrates the risk assessment process for voltage violations. Numerical studies are presented in Section 5. Finally, Section 6 concludes this paper.
2 Basic Models
2.1 Reactive Power Compensation Mechanism of Smart Inverters
The AC-DC inverters of EV chargers and PVs are composed of controllable power electronics with a three-phase six-pulse topology. The equivalent smart inverter models are depicted in Figure 1. This structure provides these smart inverters with the flexibility to operate their output voltages. By changing the amplitude and phase angle of the output voltage, the inverter can adjust its active and reactive power transmission. To illustrate the reactive power compensation mechanism of smart inverters, Figure 2 shows two typical operation modes, which provide pure capacitive or inductive reactive power to the grid.
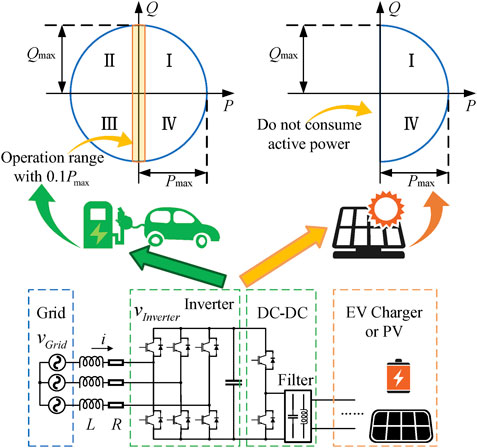
FIGURE 1. Topology and operation range of smart inverters.
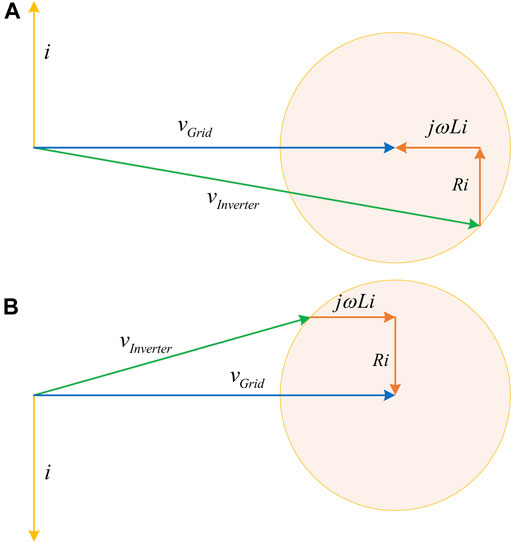
FIGURE 2. Voltage vector diagrams of two typical operation modes (A) is the capacitive mode (B) is the inductive mode.
As shown in Figure 2, the reactive power compensation modes are determined by the voltage of smart inverters. The yellow circle range in Figure 2 is drawn based on the limitation of the rated current, which protects the inverter from over-loading. As the inverter voltage varies within this yellow circle, the current changes accordingly. Then, the inverter gives out both active power P and reactive power Q according to the current and the grid voltage. The operation range of P and Q of smart inverters is thus further determined as illustrated in Figure 1 (Kisacikoglu et al., 2013; Su et al., 2014). However, EV chargers and PVs have different operation ranges. EV chargers can operate in four quadrants, which can absorb or give out both P and Q, while PVs do not consume any active power. Therefore, the operation range can be expressed as:
where
Eq. 1 indicates that when chargers and PVs are idle, these smart inverters are capable of providing considerable reactive power compensation. This advantage is illustrated by the orange rectangle in Figure 1, where the inverter has a vast operation range under low active power level.
2.2 Models of On-Load Tap Changers and Switching Capacitors
OLTCs and SCs are fundamental voltage regulation resources in DNs, which are usually equipped at the transformer substation. The reactive power compensation mechanism for OLTCs is to change the turn ratio by adjusting the tap position. The model of the OLTCs can be expressed as (Wu et al., 2017)
where
SCs provide capacitive reactive power to maintain the voltage level. According to the capacity of each SC connected to the grid, the model of SCs can be described as
where
2.3 Comparisons of Different Compensation Strategies
Since OLTCs and SCs are commonly located in the transformer substation, traditional compensation methods regulate the voltage levels by injecting reactive power at the head of the feeders, resulting in the difficulty of balancing the voltage of the whole feeder line. Figure 3 illustrates the effect of different compensation strategies. When the voltage violation occurs, the voltage profile with no compensation adopted drops seriously at the feeder terminal. Although the OLTC and SCs are able to raise the voltage profile as shown in the blue line, they cause over-voltage at the head of feeders because of too much reactive power injection.
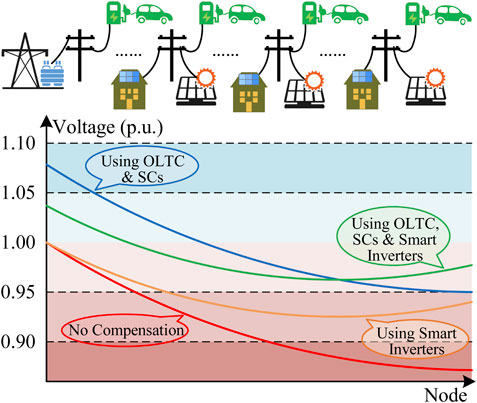
FIGURE 3. Voltage diagrams of different compensation strategies.
Smart inverters can regulate the voltages at the demand side in a local way, as they are distributed close to terminal users in DNs. Therefore, smart inverters are capable of compensating reactive power locally as the orange line in Figure 3 depicts. However, in severe voltage violations, smart inverters may not be able to raise all voltages above the safe line due to the limited capacities of demand-side power electronics.
The green line in Figure 3 illustrates that by using both traditional compensation resources and smart inverters, a satisfactory compensation effect can be achieved without causing over-compensation or being constrained by capacities, which is feasible for voltage regulation in DNs.
2.4 Voltage Deviation Indexes
To further evaluate the voltage deviation, the voltage violation probability
where
where
3 Simulation Methods for Voltage Violation Assessment
3.1 Kernel Density Estimation of Electric Vehicle Loads and Photovoltaics Outputs
The KDE method is utilized to model the PDFs of EV loads and PV outputs. Its basic idea is to treat each sample as a kernel function and sum these functions to form an overall PDF. Several load samples and the normal distribution kernel function are selected in Figure 4 to illustrate the mechanism of KDE.
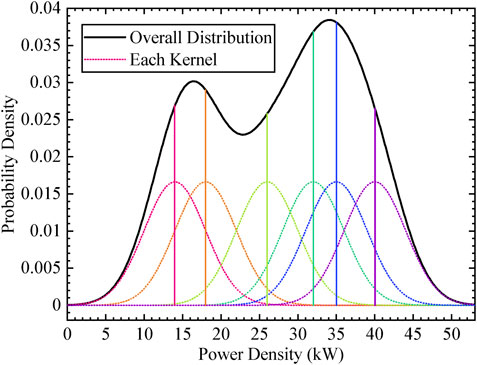
FIGURE 4. The mechanism of kernel density estimation.
Different kernel functions create different PDFs of the sample data. With the kernel function defined as
where
The standard normal distribution kernel function is adopted in this paper. Hence, Eq. 9 can be specified as
To avoid over-smooth or under-smooth in KDE, the bandwidth h is determined according to the formula provided by Silverman (2018).
where σ is the standard deviation of the sample data.
3.2 Slice Sampling for Voltage Violation Assessment
It is essential to accurately sample from the PDF obtained by KDE to generate adequate data for MCMC simulation. Slice sampling is an efficient method for handling the continuous PDF with an irregular shape and is mainly composed of two procedures as illustrated in Figure 5 (Neal, 2003).
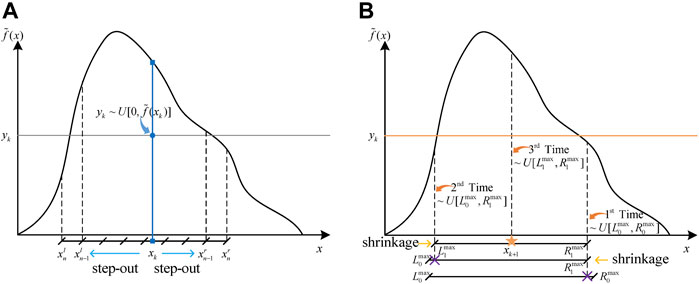
FIGURE 5. Procedures of slice sampling (A) is the step-out process (B) is the shrinkage process.
The first procedure is defined as the step-out process in Figure 5A. Assume
Then, the shrinkage process is carried out to obtain the next sample
3.3 Automated Step Width Selection for Slice Sampling
The inappropriate value of the step width ω can decrease the sampling efficiency significantly. Therefore, the automated selection mechanism is introduced in this paper to find the optimal ω (Tibbits et al., 2014).
The selection algorithm is shown in Figure 6. This algorithm helps to minimize the effort of step-out and shrinkage operations with several pre-sampling iterations. In each iteration, the numbers of step-out and shrinkage operations are recorded to optimize ω until the tuning iteration converges. After that, the optimal ω is utilized in slice sampling to accelerate the MCMC simulation.
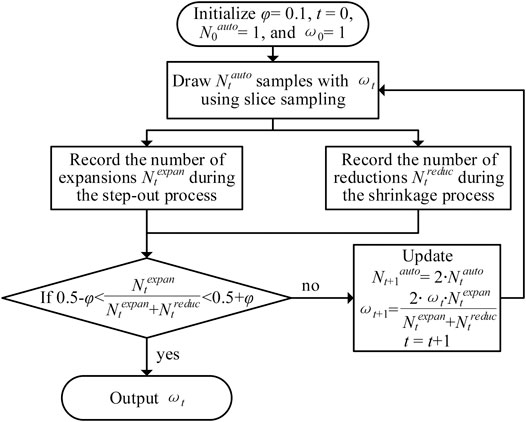
FIGURE 6. Flow chart of the step width selection.
4 Risk Assessment for Voltage Violation
In this section, the tap position of the OLTC and the reactive power from smart inverters and SCs are regarded as manipulated variables to regulate voltage violations in DNs. As different EV loads and PV outputs are sampled from the slice sampling methods, these manipulated variables are optimized to minimize the voltage deviations in each simulation.
4.1 Voltage Regulation Models
The voltage regulation models proposed in this paper only utilize the remaining reactive power capacities of smart inverters. The total reactive power compensation provided from node i is
where
Besides, the tap position and
where
4.2 Voltage Regulation Constraints
Eq. 3 and Eq. 4 show the operational constraints of the OLTC and SCs. The operation range of smart inverters is
where
Apart from constraints of reactive power compensation resources, the voltage regulation model is also limited by voltage amplitude constraints and transmission capacity constraints:
where
The voltage regulation aims to minimize the nodal voltage deviation of all nodes with reactive power resources, which can be expressed as
4.3 Risk Assessment Process
With the models and methods mentioned above, the risk assessment process is proposed and shown in Figure 7. Firstly, the KDE is carried out to derive the PDFs of EV loads and PV outputs. Then, these PDFs are utilized by the slice sampling with automated width selection to produce data samples for voltage regulation. During the voltage regulation, smart inverters are considered the first choice to reduce the operation cost of OLTCs and SCs. Moreover, voltage deviation indexes are calculated to describe the performance of regulation and estimate the convergence of MCMC simulation. If the convergence requirements are not met, the slice sampling will continue to provide samples for risk assessment.
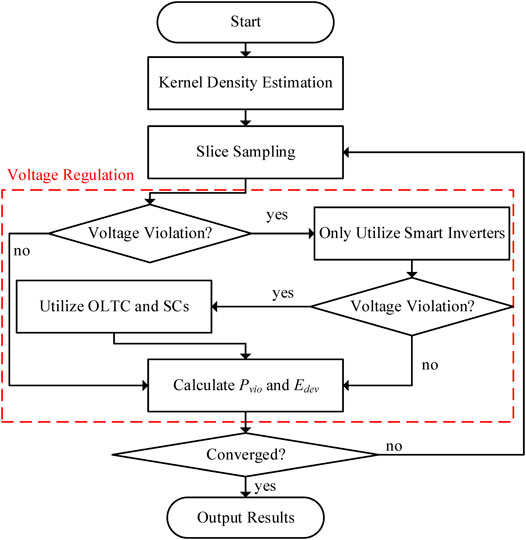
FIGURE 7. Flow chart of the risk assessment.
The convergence requirements are satisfied when the accuracy indexes
where
5 Case Studies
In this section, the proposed risk assessment is carried out in a modified IEEE 33-bus distribution system (Baran and Wu, 1989). Seven charging stations and 6 PVs are randomly installed along the feeder as Figure 8 shows. Besides, the OLTC and SCs are equipped at the head of the feeder. The capacity of each smart inverter is 550 kVA and the total capacity of SCs is 5 Mvar in this case study.

FIGURE 8. The test feeder topology.
5.1 Kernel Density Estimation Results
The EV loads and PV output measurements are derived from Huang et al. (2020) and UK Power Networks (2017) respectively. The data are normalized and estimated by KDE to obtain the PDFs of EV loads and PV outputs.
Figure 9 illustrates the estimation results of KDE. To examine the goodness-of-fit, the chi-square test is performed with the significant level set at 0.05 and the degree of freedom at 49 (Su et al., 2020). The test results of the EV and PV are 23.53 and 42.40 respectively, which are both below the critical value 66.34 and validate the accuracy of KDE.
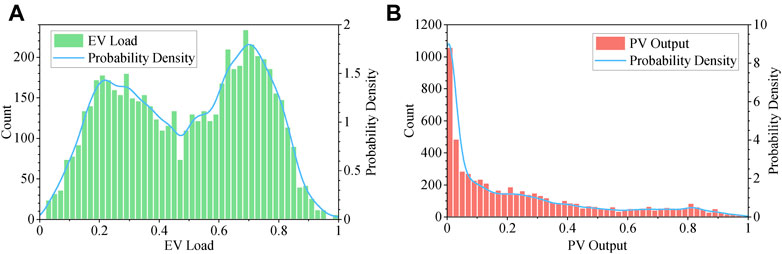
FIGURE 9. Results of KDE (A) is the KDE result of EV loads with h as 0.02485 (B) is the KDE result of PV outputs with h as 0.02486.
5.2 Performance of Slice Sampling
To compare the sampling efficiency of slice sampling and the classic Monte Carlo simulation (Zhao et al., 2009), both methods are tested on an i5-4590T 2.00 GHz CPU computer through Matlab R2020a and MATPOWER 7.1 (Zimmerman et al., 2011; Zimmerman and Murillo-Sánchez, 2020). The convergence threshold is 0.01. The optimal step widths ω of EV PDF and PV PDF for slice sampling are 0.761 and 0.343 respectively. The simulation results are listed in Table 1.
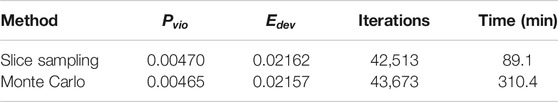
TABLE 1. Comparison of slice sampling and Monte Carlo.
The slice sampling only consumes 28.7% of the time of the Monte Carlo method to accomplish almost the same number of iterations and the same results of indexes. It takes more time for the classic Monte Carlo method to complete the iterations because this method rejects many unqualified samples during simulation. By contrast, no samples are discarded in slice sampling, which improves the sampling efficiency.
Table 2 illustrates three typical cases where only the OLTC and SCs, only smart inverters, and all these facilities are respectively utilized in voltage regulation. Compared with OLTC and SCs, and
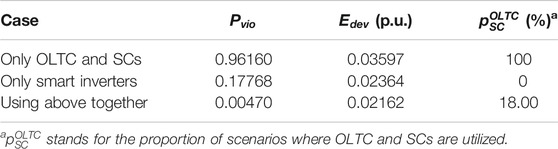
TABLE 2. Voltage regulation under different cases.
5.3 Sensitivity Analysis
In the sensitivity analysis, the capacities of smart inverters and SCs are set to increase 10% of the original value respectively. Figure 10 depicts
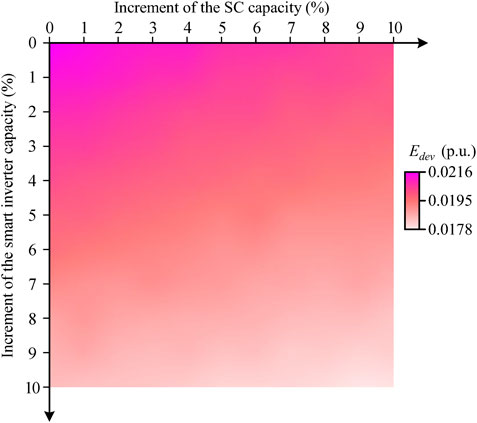
FIGURE 10. Sensitivity analysis.
6 Conclusion
This paper establishes a voltage violation assessment model considering the support provided by smart inverters. With the active power samples from KDE and slice sampling, the reactive power compensation process is modeled and implemented to minimize the voltage deviation. Based on the voltage deviation indexes proposed in this paper, the case studies demonstrate that slice sampling takes less time to converge than the Monte Carlo method. Besides, while OLTCs, SCs, and smart inverters are all essential to avoid voltage violations, smart inverters are more effective than the traditional facilities, which can save the operation cost of these facilities as well. Moreover, the sensitivity analysis shows that it is more beneficial to develop smart inverters than SCs, which validates the prospect of smart inverters for voltage regulation.
In future works, the cooperative control strategies of smart inverters for voltage regulation will be studied. The integration of both active and reactive power deliveries will be considered to further implement the four-quadrant operation characteristic of smart inverters.
Data Availability Statement
The original contributions presented in the study are included in the article/Supplementary Material, further inquiries can be directed to the corresponding author.
Author Contributions
The paper was a collaborative effort among the authors. JH designed the voltage violation assessment model. CY proposed the original idea and established the framework. WY made the case studies. WB and JW contributed to the introduction. YD contributed to the supervision and editing.
Funding
This work was supported in part by the National Natural Science Foundation of China under Grant 51807173, in part by the Fundamental Research Funds for the Central Universities under Grant 2021QNA4012, and in part by the Science and technology project of State Grid Zhejiang Electric Power Co., Ltd with No. 5211JX1900CV. The funders were not involved in the study design, collection, analysis, interpretation of data, the writing of this article, or the decision to submit it for publication. All authors declare no other competing interests.
Conflict of Interest
The author WY was employed by State Grid Jiaxing Power Supply Company and authors WB and JW were employed by State Grid Yiwu Power Supply Company.
The remaining authors declare that the research was conducted in the absence of any commercial or financial relationships that could be construed as a potential conflict of interest.
References
Abeywardana, W. D. B., Acuna, P., Hredzak, B., Aguilera, R. P., and Agelidis, V. G. (2018). Single-Phase Boost Inverter-Based Electric Vehicle Charger with Integrated Vehicle to Grid Reactive Power Compensation. IEEE Trans. Power Electron. 33, 3462–3471. doi:10.1109/TPEL.2017.2700944
Baran, M. E., and Wu, F. F. (1989). Network Reconfiguration in Distribution Systems for Loss Reduction and Load Balancing. IEEE Trans. Power Deliv. 4, 1401–1407. doi:10.1109/61.25627
Bowman, A. W., and Azzalini, A. (1997). Applied Smoothing Techniques for Data Analysis: The Kernel Approach with S-Plus Illustrations. Oxford and New York: Clarendon Press and Oxford University Press.
Buja, G., Bertoluzzo, M., and Fontana, C. (2017). Reactive Power Compensation Capabilities of V2G-Enabled Electric Vehicles. IEEE Trans. Power Electron. 32, 9447–9459. doi:10.1109/TPEL.2017.2658686
Chen, H., Prasai, A., and Divan, D. (2018). A Modular Isolated Topology for Instantaneous Reactive Power Compensation. IEEE Trans. Power Electron. 33, 975–986. doi:10.1109/TPEL.2017.2688393
Feng, J., Wang, H., Xu, J., Su, M., Gui, W., and Li, X. (2018). A Three-phase Grid-Connected Microinverter for AC Photovoltaic Module Applications. IEEE Trans. Power Electron. 33, 7721–7732. doi:10.1109/TPEL.2017.2773648
Green, R. C., Lingfeng Wang, L., and Singh, C. (2010). “State Space Pruning for Power System Reliability Evaluation Using Genetic Algorithms,” in IEEE PES General Meeting, Minneapolis, MN, July 25–29, 2010 (Minneapolis:IEEE), 1–6. doi:10.1109/PES.2010.5590205
Gush, T., Kim, C.-H., Admasie, S., Kim, J.-S., and Song, J.-S. (2021). Optimal Smart Inverter Control for PV and BESS to Improve PV Hosting Capacity of Distribution Networks Using Slime Mould Algorithm. IEEE Access 9, 52164–52176. doi:10.1109/ACCESS.2021.3070155
Hu, B., Li, Y., Yang, H., and Wang, H. (2017). Wind Speed Model Based on Kernel Density Estimation and its Application in Reliability Assessment of Generating Systems. J. Mod. Power Syst. Clean. Energ. 5, 220–227. doi:10.1007/s40565-015-0172-5
Huang, S., Ye, C., Liu, S., Zhang, W., Ding, Y., Hu, R., et al. (2020). Data-driven Reliability Assessment of an Electric Vehicle Penetrated Grid Utilizing the Diffusion Estimator and Slice Sampling. Csee Jpes, 1–9. doi:10.17775/CSEEJPES.2020.01030
Kekatos, V., Wang, G., Conejo, A. J., and Giannakis, G. B. (2015). Stochastic Reactive Power Management in Microgrids with Renewables. IEEE Trans. Power Syst. 30, 3386–3395. doi:10.1109/TPWRS.2014.2369452
Kesler, M., Kisacikoglu, M. C., and Tolbert, L. M. (2014). Vehicle-to-Grid Reactive Power Operation Using Plug-In Electric Vehicle Bidirectional Offboard Charger. IEEE Trans. Ind. Electron. 61, 6778–6784. doi:10.1109/TIE.2014.2314065
Kisacikoglu, M. C., Ozpineci, B., and Tolbert, L. M. (2013). EV/PHEV Bidirectional Charger Assessment for V2G Reactive Power Operation. IEEE Trans. Power Electron. 28, 5717–5727. doi:10.1109/TPEL.2013.2251007
Quirós-Tortós, J., Ochoa, L. F., Alnaser, S. W., and Butler, T. (2016). Control of EV Charging Points for Thermal and Voltage Management of LV Networks. IEEE Trans. Power Syst. 31, 3028–3039. doi:10.1109/TPWRS.2015.2468062
Sharma, R., and Das, A. (2020). Extended Reactive Power Exchange with Faulty Cells in Grid-Tied Cascaded H-Bridge Converter for Solar Photovoltaic Application. IEEE Trans. Power Electron. 35, 5683–5691. doi:10.1109/TPEL.2019.2950336
Silverman, B. W. (2018). Density Estimation for Statistics and Data Analysis. Boca Raton: Routledge.
Singh, S., Pamshetti, V. B., and Singh, S. P. (2019). Time Horizon-Based Model Predictive Volt/VAR Optimization for Smart Grid Enabled CVR in the Presence of Electric Vehicle Charging Loads. IEEE Trans. Ind. Applicat. 55, 5502–5513. doi:10.1109/TIA.2019.2928490
Su, N., An, X., Yan, C., and Ji, S. (2020). Incremental Attribute Reduction Method Based on Chi-Square Statistics and Information Entropy. IEEE Access 8, 98234–98243. doi:10.1109/ACCESS.2020.2997013
Su, X., Masoum, M. A. S., and Wolfs, P. J. (2014). Optimal PV Inverter Reactive Power Control and Real Power Curtailment to Improve Performance of Unbalanced Four-Wire LV Distribution Networks. IEEE Trans. Sustain. Energ. 5, 967–977. doi:10.1109/TSTE.2014.2313862
Tibbits, M. M., Groendyke, C., Haran, M., and Liechty, J. C. (2014). Automated Factor Slice Sampling. J. Comput. Graphical Stat. 23, 543–563. doi:10.1080/10618600.2013.791193
Tómasson, E., and Söder, L. (2017). Improved Importance Sampling for Reliability Evaluation of Composite Power Systems. IEEE Trans. Power Syst. 32, 2426–2434. doi:10.1109/TPWRS.2016.2614831
UK Power Networks (2017). Photovoltaic (PV) Solar Panel Energy Generation Data. London, United Kingdom: London DatastoreAvailable at: https://data.london.gov.uk/dataset/photovoltaic--pv--solar-panel-energy-generation-data.
Ustun, T. S., Aoto, Y., Hashimoto, J., and Otani, K. (2020). Optimal PV-INV Capacity Ratio for Residential Smart Inverters Operating under Different Control Modes. IEEE Access 8, 116078–116089. doi:10.1109/ACCESS.2020.3003949
Varma, R. K., and Siavashi, E. M. (2018). PV-STATCOM: A New Smart Inverter for Voltage Control in Distribution Systems. IEEE Trans. Sustain. Energ. 9, 1681–1691. doi:10.1109/TSTE.2018.2808601
Wu, W., Tian, Z., and Zhang, B. (2017). An Exact Linearization Method for OLTC of Transformer in Branch Flow Model. IEEE Trans. Power Syst. 32, 2475–2476. doi:10.1109/TPWRS.2016.2603438
Zeraati, M., Golshan, M. E. H., and Guerrero, J. M. (2019). Voltage Quality Improvement in Low Voltage Distribution Networks Using Reactive Power Capability of Single-phase PV Inverters. IEEE Trans. Smart Grid 10, 5057–5065. doi:10.1109/TSG.2018.2874381
Zhao, Y., Zhang, X.-F., and Zhou, J.-Q. (2009). Load Modeling Utilizing Nonparametric and Multivariate Kernel Density Estimation in Bulk Power System Reliability Evaluation. Proc. CSEE 29, 27–33.
Zhou, P., Jin, R. Y., and Fan, L. W. (2016). Reliability and Economic Evaluation of Power System with Renewables: A Review. Renew. Sustain. Energ. Rev. 58, 537–547. doi:10.1016/j.rser.2015.12.344
Zimmerman, R. D., and Murillo-Sánchez, C. E. (2020). MATPOWER. Genève, Switzerland: Zenodo. doi:10.5281/zenodo.4074135 Available at: https://zenodo.org/record/4074135#.YKB4HqgzaUk (Accessed October 8, 2020).
Keywords: distribution network, reactive power compensation, risk assessment, electric vehicle charger, photovoltaic
Citation: Hu J, Yin W, Ye C, Bao W, Wu J and Ding Y (2021) Assessment for Voltage Violations considering Reactive Power Compensation Provided by Smart Inverters in Distribution Network. Front. Energy Res. 9:713510. doi: 10.3389/fenrg.2021.713510
Received: 23 May 2021; Accepted: 21 June 2021;
Published: 06 July 2021.
Edited by:
Yang Li, Northeast Electric Power University, ChinaReviewed by:
Huaiyuan Wang, Fuzhou University, ChinaGengfeng Li, Xi'an Jiaotong University, China
Yunfei Mu, Tianjin University, China
Copyright © 2021 Hu, Yin, Ye, Bao, Wu and Ding. This is an open-access article distributed under the terms of the Creative Commons Attribution License (CC BY). The use, distribution or reproduction in other forums is permitted, provided the original author(s) and the copyright owner(s) are credited and that the original publication in this journal is cited, in accordance with accepted academic practice. No use, distribution or reproduction is permitted which does not comply with these terms.
*Correspondence: Chengjin Ye, eWVjaGVuamluZ0B6anUuZWR1LmNu