 Shizhi Liang1
 Tao Ding
- 1Supporter and Sponsor Technology (Shanghai) Co., Ltd, Shanghai, China
- 2School of Economics, Hefei University of Technology, Hefei, China
Water and energy are critical resources for human well-being. The quantification and explanation of the water–energy nexus is important to enrich our understanding of sustainable utilization of water and energy resources in a unified framework. Herein, from the perspective of production efficiency, this study investigates the water–energy nexus in China’s industrial sector by developing a network data envelopment analysis (DEA) approach. Under two practical principles, we evaluate the water and energy usage efficiencies as well as give projection points in terms of industrial production and wastewater treatment processes for 30 provinces or urban areas in China during 2011–2015. The results show that the overall efficiency values of most provinces in the industrial water–energy nexus system are high although the efficiency value of each province fluctuates up and down in the sample period. When comparing two subsystems, for most provinces, the sub-efficiencies of the industrial production subsystem are relatively higher than those of the wastewater treatment subsystem under the economic priority principle or environment priority principle. Considering the projection points, the potential improvement space of the environment priority strategy is higher than that of the economic priority strategy. Based on the empirical results, relevant policy suggestions are provided to improve the provincial or urban industrial water–energy nexus system in reality.
Introduction
Water and energy are two kinds of essential and irreplaceable resources for human survival and social development (Zhou et al., 2018). With the population growth, urbanization, and economic development, many countries are facing water shortage and energy depletion issues to varying degrees (Dong et al., 2018). As the State of Food and Agriculture 2020 points out, 3.2 billion people in the world are facing water shortage, and 1.2 billion people live in severely arid regions. According to the Global Sustainable Development Report in 2019, a billion people do not have access to modern electricity, and more than 3 billion people use dirty fuels to cook food, which causes about 3.8 million premature deaths each year. More importantly, water and energy resources are inseparable and interdependent (Hamiche et al., 2016; Wang et al., 2020). On the one hand, in water-related sectors, the energy resource is essential for water treatment, supply, and consumption processes. On the other hand, in energy-related sectors, the water resource is necessary for energy production, conversion, and utilization.
Due to the interactive relation between water and energy resources, the independent study on water or energy resource management is of limited value. As a result, the concept of the water–energy nexus has attracted wide concern over the years since the World Economic Forum in 2008, where one of the three global economic challenges was identified as the water–energy nexus problem (WEFWI, 2011). Since then, a flood of literature has focused on the water–energy nexus subject in terms of both scholars and policy-makers. To be specific, some studies place emphasis on the definition of the concept of the nexus (Albrecht et al., 2018; Ahmad et al., 2020). For example, the nexus can be expressed as the coordination degree between water and energy resources. Some studies focus on exploring water–energy nexus–related applications in different ranges, from the urban level, regional level, and national level to the cross-national level (Kızıltan, 2021). Some researchers devote to propose technical models to quantify the coupling relations between water and energy resources (Xu et al., 2020).
In addition, efficiency evaluation is another burgeoning issue in the field of the water–energy nexus (Deng et al., 2016; An et al., 2017). As a popular nonparametric evaluation method, data envelopment analysis (DEA) has been naturally migrated to the assessment of the water–energy nexus from the perspective of production efficiency. However, the existing literature on water–energy nexus efficiency evaluation has predominantly focused on the conventional “black box” production structure, in which the internal production relations of decision-making units (DMUs) are ignored. Moreover, current studies primarily analyze the performance of different water–energy nexus systems based on efficiency values, while the specific efficiency improvement direction of each system is not further investigated.
In China, the escalating demand for industrial water and energy consumption has caused a serious contradiction in supply and demand of water and energy resources. According to statistics, the industrial water consumption has exceeded 1,261.6 billion cubic meters, accounting for 21.0 per cent of the total water consumption in China (CWRB, 2018). And the industrial energy consumption has reached 311.2 billion tons of standard coal, accounting for more than 66 per cent of the total energy consumption in the whole country (CSY, 2020). Based on the above background, in this article, the network DEA approach is introduced to investigate the water–energy nexus efficiency of China’s industrial sector with provincial data. Specifically, by opening the “black box,” the industrial process is divided into the industrial production subsystem and the wastewater treatment subsystem. First, the overall efficiency of the whole process is defined and calculated by integrating the two subsystems. Then by introducing two principles, that is, economic priority strategy and environment priority strategy, two sets of unique subsystem efficiency are obtained. In addition, two types of efficiency improvement directions are derived in terms of the above principles, that is, economical loose-type projection and environmental loose-type projection. Finally, the proposed approach is applied to evaluate the water–energy nexus efficiency of China’s industrial sector in the period of 2011–2015, and the specific efficiency improvement directions are provided for each province by two different strategies.
The rest of this article is organized as follows. The Literature Review section reviews the literature related to our study. The Methodology and Data section describes the research problem and proposes the two-stage network DEA models. The Empirical Results section presents the empirical results and analysis of China’s industrial water–energy nexus using data from 2011 to 2015. The Conclusion and Policy Implications section summarizes the conclusion and provides related policy implications.
Literature Review
Two main streams of the literature are related to our study: 1) applications are related to water–energy nexus assessment, and 2) methods are related to water–energy nexus assessment. The Summary of the Literature section summarizes the related literature.
Applications Related to Water–Energy Nexus Assessment
From the perspective of the application scales, the existing literature can be classified into four levels: transnational level, national level, regional level, and urban level. On the transnational level, Ozturk (2017) studied the dynamic relationship between the water–energy–food linkage system and agricultural sustainability in sub-Saharan African countries from 1980 to 2013. Ibrahim et al. (2019) assessed the efficiency of Organization for Economic Co-Operation and Development (OECD) countries from the perspective of the water–energy–land–food nexus. Liu et al. (2020) explored water use for energy from the source of raw materials to the final consumption through global supply chains.
On the national level, Portney et al. (2018) explored the public perception of the water–energy–food interconnected system by utilizing the public opinion polls in the United States in 2015. The results showed that it is the premise of the relevant policy concerning water, energy, and food conservation for constructing the public’s understanding of the nexus system. Duan and Chen (2019) calculated the driving forces of the water–energy nexus in China by structural decomposition analysis during the period of 1990–2014. Lee et al. (2021) comprehensively analyzed the tourism water footprint and tourism energy footprint of the food supply sector in China’s tourism industry from 2012 to 2017.
On the regional level, Wang and Chen (2016) studied the internal connections of water use and energy consumption of the Beijing–Tianjin–Hebei region in China. According to the results, Beijing and Tianjin rely on Hebei for water and energy resources, and Hebei is relatively self-sufficient. Chen et al. (2019) calculated the total factor productivity (TFE) of water, energy, and food utilization in 12 cities of Inner Mongolia from 2007 to 2016. Based on the trends of productivity of each city, policy suggestions were provided to improve the water–energy interacted system. Feng et al. (2019) established the water–energy–food linkage system in the Detroit metropolitan area. They found a great potential for resource optimization in the intermediate process of supply chain because of the large amount of energy, water, and food consumption.
On the urban level, Wang et al. (2017) studied both water-related energy consumption and energy-related water consumption of Beijing in China by using energy metrics. The results showed that the manufacture sector has the largest outflow of energy resources, while the agriculture sector is the largest receiver of energy resources. De Stercke et al. (2020) explored the water–energy nexus of Mumbai and its long-term resource demand. They found that sustainable development goals can save future water system infrastructure investments compared to the normal operating mode. Yuan et al. (2020) analyzed heterogeneity and policy system of sustainability topics related to the water, energy, and food nexus for different cities.
Methods Related to Water–Energy Nexus Assessment
Based on the state-of-the-art modeling approaches, we summarized the main methods used in the assessment of the water–energy nexus system, that is, input–output analysis (IOA), life cycle assessment (LCA), econometric analysis (EA), multi-objective programming (MOP), and data envelopment analysis methods. Specifically, IOA is a top-down approach which quantifies the water–energy nexus by calculating the flow of currencies and objects during the process of resource consumption (Owen et al., 2018; White et al., 2018; Feng et al., 2019; Deng et al., 2020). As a bottom-up analysis approach, LCA has been widely applied to evaluate the impact of climate change and measure the water footprint as well as the energy footprint in the water–energy nexus systems (Al-Ansari et al., 2015; Salmoral and Yan, 2018; Yuan et al., 2018; Ghani et al., 2019). Econometric analysis (EA) is an effective method for providing empirical explanations of the economic phenomena by using the statistical tools and nonexperimental data analysis (Zhou et al., 2016; Ge and Lei, 2017; Zisopoulou et al., 2018; Sharifinejad et al., 2020). Multi-objective programming (MOP) is a branch of mathematical programming which has been applied widely to analyze the optimal goal of the water and energy nexus system (Hussien et al., 2018; Li et al., 2019; Yu et al., 2020).
In addition to the above method, data envelopment analysis (DEA) is a popular approach to evaluate the relative efficiency of a set of decision-making units (Units) by multiple inputs and outputs. Recently, from the perspective of production efficiency, scholars are gradually using a variety of DEA methods to assess the water–energy nexus systems. Li et al. (2016) evaluated China’s input–output efficiency of the water–energy–food nexus by using the DEA-Malmquist index. Zheng et al. (2018) applied a three-stage data envelopment analysis modeling evaluation method to explore the agricultural production efficiency (APE). Zhou et al. (2018) proposed a mixed network DEA model to evaluate the integrated water use and wastewater treatment process in the industrial sector. Hong et al. (2019) used an integrated model included the multiregional input–output (MRIO) and DEA analyses to study its water–energy nexus, especially the efficiency and flows. Han et al. (2019) measured the efficiency and the coupling interactions of the food–energy–water nexus in China by using a multiplicative environmental data envelopment analysis model (ME-DEA). Zhang and Xu, (2019) explored the coupling efficiency of the W-E-F (water–energy–food) nexus for different regions in China based on the DEA method and the Malmquist index. Ding et al. (2020) investigated the regional water–energy nexus in China’s industrial sector by proposing an interactive meta-frontier DEA approach. More recently, Sun et al. (2021) constructed a water–energy–food input–output index system by using the superefficient DEA model, which aims to measure the coupling efficiency in the water–food–energy nexus. Yang et al. (2021) developed a dynamic interactive network slack-based measure to explore the performance of the provincial industrial water system in China.
Summary of the Literature
The literature review above indicates that most studies mainly focus on single geographic-scale water–energy nexus issues, and few studies investigate more than one scale of water–energy nexus assessment. In addition, from the perspective of production efficiency, existing DEA-based water–energy nexus evaluation primarily treats the production structure as a “black box,” while the internal relations of the system are uncertain. More importantly, existing studies evaluate the performance of the water–energy nexus system, but the improvement directions of different systems are not provided. Therefore, it is necessary to assess the production efficiency as well as provide specific improvement directions of industrial water–energy nexus systems by considering the internal structure of DMUs.
Methodology and Data
Problem Statement
Let us consider there are N regions that are evaluated, which are denoted by DMUn (n = 1, …, N) as shown in Figure 1. In the industrial production (IP) subsystem, X1 [industrial capital (XC), energy consumption (XE), industrial labor force (XL), and industrial water consumption (XW)] is used to produce the gross industrial output value (Y1) and intermediate output Z [industrial wastewater (WW)]. And in the wastewater treatment (WT) subsystem, industrial wastewater (WW) and total investment in WT (X2) are consumed as inputs to generate recycled and reused wastewater (RW), and the product output value by disposing of and utilizing wastewater (YO). It should be pointed out that output RW in the WT system is a recycled resource, which is also an input in the IP subsystem (Zhou et al., 2018).
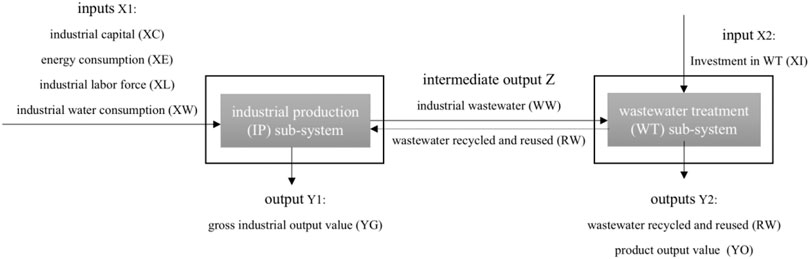
FIGURE 1. Schematic of the IP and WT system.
The main goal of this study is to develop network DEA models to assess the production efficiencies of the industrial water–energy nexus system as well as the IP and WT subsystems. The proposed models must consider the following three aspects. First, existing models treat the water–energy nexus system as a “black box,” in which the internal structure of the system is uncertain. Therefore, the calculation of overall efficiency and subsystem efficiencies should be incorporated into a unified model. Second, based on the real-world situation in China, different preferences on economic development and environment protection may affect the decomposed efficiencies in the IP and WT subsystems. Therefore, in our study, both economic priority strategy and environment priority strategy are introduced to obtain two types of subsystem efficiencies. Third, conventional models can provide efficiency evaluation results; however, an inefficient water–energy nexus system cannot get specific improving directions to increase the efficiency. Therefore, the models developed in our study should provide frontier projection for each inefficient system.
Model Development
In our study, both the IP subsystem and the WT subsystem work together to reach the optimal performance of the industrial water–energy nexus system. Under the additive efficiency aggregation approach developed by Chen et al. (2009), the overall efficiency score of the whole system for Figure 1 can be calculated by the following linear model.
where the vectors of U1, U2, V1, V2, and W are unknown nonnegative weights to be solved. And
By solving model (1), once the optimal solution (U1, U2, V1, V2, W)* is obtained, the efficiency of IP and WT systems based on (U1, U2, V1, V2, W)* can be expressed as
Based on the results of overall efficiency calculation and efficiency decomposition, we have definition 1:
Definition 1. We define DMUs with an overall efficiency equal to one to be efficient, and similarly, we define the stages where the sub-efficiency equal to one to be efficient.Then we have theorem 1:
Theorem 1. The sufficient and necessary conditions for DMU0 to be efficient are that its two stages are both efficient.
Proof of Theorem 1. We first prove the sufficiency of this condition for DMU0 to be effective. Here, two stages of DMU0 are both efficient, and that means, there is at least one solution
Theorem 2. For each DMU0
Proof of Theorem 2. To DMU0*,
By computing model (3), the maximum achievable efficiency value in the IP subsystem and the optimal solution
In summary, we can obtain two kinds of efficiency decomposition
Data Source
This study was investigated based on China’s industrial provincial data during 2011–2015. Considering the data availability, 30 provinces in Mainland China were studied, excluding Tibet, Macao, Hong Kong, and Taiwan. The data used in our study are described as follows.
The industrial labor force (XL) and industrial water consumption (XW) data were derived from the Provincial Statistical Yearbook (2012–2016). The energy consumption (XE) data were obtained from the China Energy Statistical Yearbook (2012–2016). The industrial capital (XC) of each province was calculated by the perpetual inventory method. The gross industrial output (Y1) data were collected from the China Statistical Yearbook (2012–2016) and converted into 2000 constant prices. And the data of industrial wastewater (WW), total investment in wastewater treatment (X2), wastewater recycled and reused (RW), and product output value by disposing of and utilizing waste water (YO) were obtained from the Environmental Statistical Database of China (2012–2016). The descriptive statistics of data are shown in Table 1.
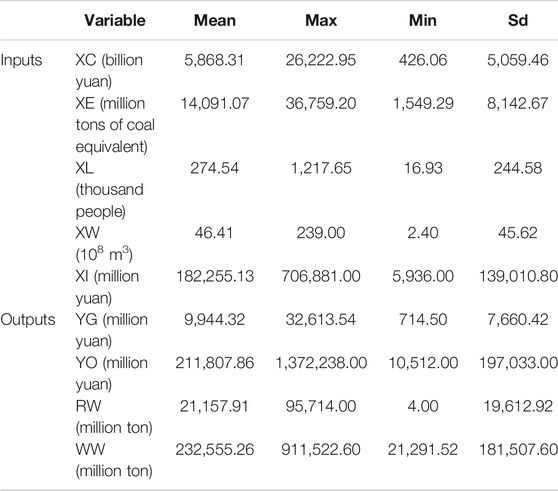
TABLE 1. Descriptive statistics.
Empirical Results
Analysis of Overall Efficiency
After solving the proposed model (1) by using the above data, the overall efficiency values of China’s 30 provinces from 2011 to 2015 and its average during the 5 years are shown in Table 2.
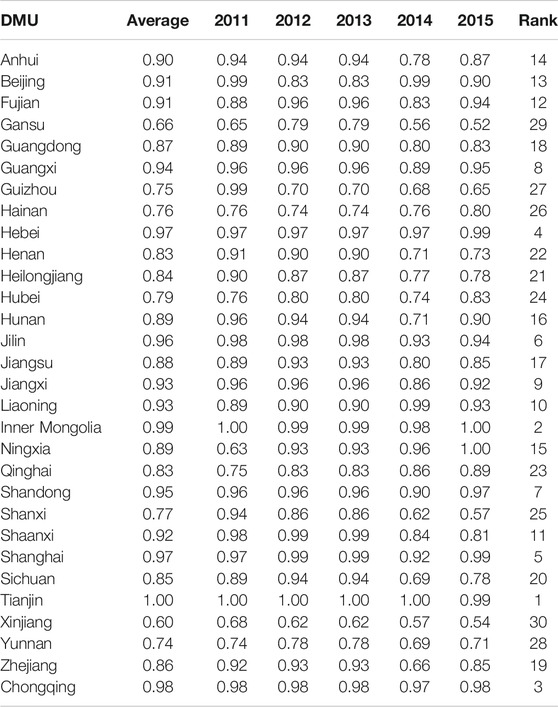
TABLE 2. Results of overall efficiency in China’s 30 provinces from 2011 to 2015.
According to the results, the overall efficiency of China in each province shows a trend of fluctuation during 2011–2015. In terms of the average overall efficiency, 30 provinces can be classified into four categories: high level (efficiency values more than 0.95), relatively high level (efficiency values between 0.90 and 0.94), medium level (efficiency values between 0.80 and 0.89), and low level (efficiency values less than 0.8).
Specifically, Tianjin, Inner Mongolia, Chongqing, Hebei, Shanghai, Jilin, and Shandong belong to the category of high level, in which the water–energy nexus performance is the most excellent among all provinces. In addition, the efficiency values of these provinces have very little variation during the sample period, which can be a worthy learning model for other provinces in China. Among them, Tianjin, Chongqing, and Shanghai, which are municipalities in China, are economically successful and technologically advanced cities. In the constant deepening of China’s industrial structure reform, these provinces have also simultaneously pushed for tougher enforcement of existing environmental regulations, so as to ensure the high efficiency in industrial water and energy usage. Although the shortage of water and energy resource and environmental pollution problems still exist in Inner Mongolia, Jilin, Shandong, and Hebei, the efficiency values of the provinces are very high. The reasons may be that these provinces implement water-saving irrigation projects and improve the water resource tax system.
In Guangxi, Jiangxi, Liaoning, Shaanxi, Beijing, Fujian, and Anhui, the overall efficiency values are between 0.90 and 0.94, in which the provinces still have some room for efficiency improvement. Taking Beijing as an example, with the rapid economic and social development, some common defects have gradually appeared, that is, serious pollution regarding to industrial water use, low efficiency in cyclic utilization of waste water, and excessive energy consumption. In the third category, the average overall efficiencies of Hunan, Ningxia, Jiangsu, Guangdong, Zhejiang, Sichuan, Heilongjiang, Henan, and Qinghai are between 0.80 and 0.89. In addition, the efficiency values show significant changes during the sample period. For example, in Sichuan Province, the overall efficiency value was 0.94 in 2013 but changed to 0.69 in 2014. Among them, Hunan, Jiangsu, Guangdong, and Zhejiang are facing the same typical problem called “the engineering shortage of water,” which means the total amount of water in the region is abundant but the water supply is insufficient because of low engineering construction.
In the last category, the average overall efficiencies of Hubei, Shanxi, Hainan, Guizhou, Yunnan, Gansu, and Xinjiang are all less than 0.80. Among them, for Guizhou, Yunnan, Gansu, and Xinjiang, the water resources are lacking because of the special topographical environment and climatic conditions. In these provinces, on the one hand, the capability of water environment management and the carrying capacity of water environment are low. On the other hand, due to the resource development and primary processing industries accounting for a large proportion in industry development, a large quantity of the industrial sewage water and more serious industrial pollution exist.
Analysis of Sub-Efficiency
By solving models (3 and 4), the results of sub-efficiency values of 30 provinces in China during 2011–2015 are shown in Tables 3, 4 in the Supplementary Appendix. Here, we also plot the average overall efficiency and sub-efficiency values of each province during the sample period. In terms of efficiency differences between the IP and WT subsystems, the 30 provinces are classified into three categories: the provinces in which efficiency in the IP subsystem is markedly higher than that in the WT subsystem, the efficiency in the IP subsystem is about the same as that in the WT subsystem, and the efficiency in the WT subsystem is higher than that in the IP subsystem. The details are depicted by Figures 2–4.
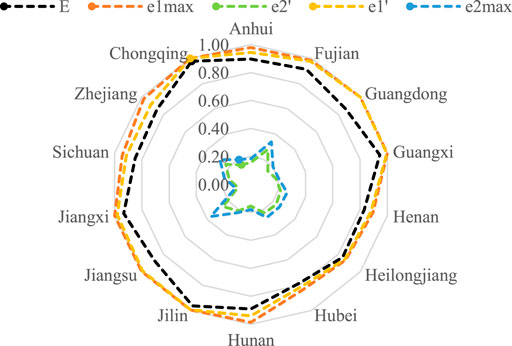
FIGURE 2. Water–energy nexus system efficiency. IP and WT sub-efficiencies in 14 provinces.
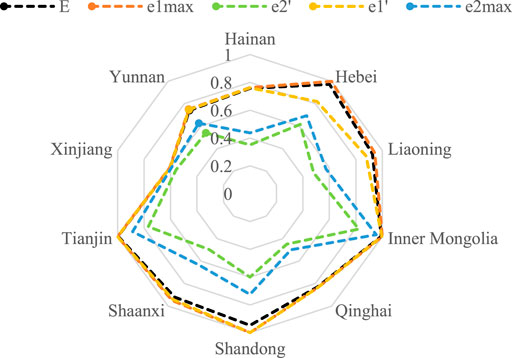
FIGURE 3. Water–energy nexus system efficiency. IP and WT sub-efficiencies in 10 provinces.
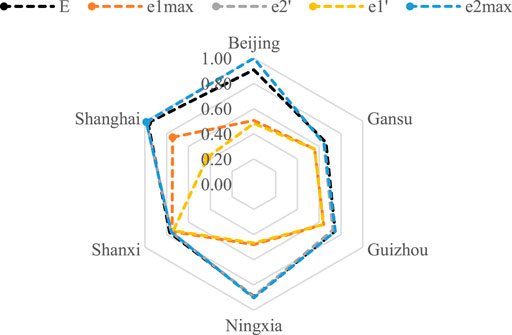
FIGURE 4. Water–energy nexus system efficiency. IP and WT sub-efficiencies in six provinces.
As shown in Figure 2, for 14 provinces, in both of the two principles (economic priority principle or environment priority principle), the efficiency of the IP subsystem is much higher than that of the WT subsystem. To be specific, for these provinces, that is, Anhui, Chongqing, Fujian, Guangdong, Guangxi, Henan, Heilongjiang, Hubei, Hunan, Jilin, Jiangsu, Jiangxi, Sichuan, and Zhejiang, the efficiency values in the IP subsystem are approximately between 0.8 and 1, while the efficiency values in the WT subsystem are less than 0.4. The results indicate that those provinces perform well in industrial production and economic development, but the effect of pollution control, especially the wastewater treatment, is poor.
From Figure 3, it is found that ten provinces have roughly similar level sub-efficiencies in the IP subsystem and WT subsystem. Specifically, Inner Mongolia, Shandong, and Tianjin are efficient in the IP subsystem under the economic priority principle or environment priority principle. In addition, the sub-efficiencies in Liaoning, Hebei, and Shaanxi provinces are very close to being efficient. However, in Hainan, Qinghai, Xinjiang, and Yunnan provinces, the sub-efficiencies in both subsystems are in a relatively low level, which means that both economic development and environment management are not going well in the industrial sector.
Figure 4 consists of six provinces (Beijing, Gansu, Guizhou, Ningxia, Shanxi, and Shanghai), in which the sub-efficiency of the WT subsystem are higher than that of the IP subsystem. For example, in Beijing and Shanghai, the WT subsystem is efficient, while the efficiencies of the IP subsystem are less than 0.6. It might be because Beijing and Shanghai are the most advanced urban areas to implement the green concept of development. Besides, in rest of the four provinces, the performance in both the IP subsystem and the WT subsystem is at a relatively low level. Therefore, it is important to attach equal importance to economic development and environmental protection in those provinces.
Analysis of the Projection
In measuring the sub-efficiencies via models (3 and 4) under two different principles, two sets of projection points can be obtained via the equation in Theorem 2. The projection points on the one hand can be viewed as the basis for evaluating performance, and on the other hand, they act as the target for inefficient provinces or urban areas to make improvements to become more efficient.
Figure 5 shows the average values of original data, economical loose type projection, and environmental loss-type projection of the gross industrial output value (YG) for 30 provinces, respectively. It is found that the projection points have small increments in both the economical loose-type and environmental loose-type projections in most provinces. It indicates that the industrial production efficiencies in most provinces are at a high level during 2011–2015. However, there are also some provinces in which the projection points have appreciable increments in terms of the YG value. It means that the improvement spaces in terms of economic development in these provinces are great due to low-level industrial production efficiencies. In addition, for most provinces, the increment space of YG values has little difference between the economical loose-type and environmental loose-type projections.
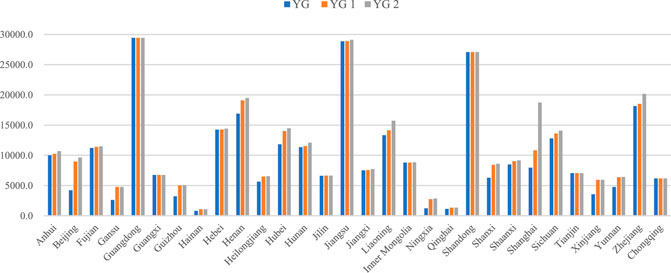
FIGURE 5. Average projection comparison for YG in 30 provinces during 2011–2015.
Because the projection points of both YO and RW are calculated based on the sub-efficiency in the WT subsystem, we just show the average projection points of YO values in Figure 6. From Figure 6, it is found that almost all provinces have significant increments for YO values in both economical loose and environmental loose types. The results reveal that most regions of China should pay more attention to environmental protection than economic growth alone due to low efficiency values in the WT subsystem. Differently, in a few provinces, such as Beijing, Ningxia, and Shanghai, the potential room for YO improvement is limited. It indicates that the green economy mode has done well for these provinces in terms of wastewater treatment. In addition, for most provinces, it can be seen that the increment space of YO values in the economical loose type projection is obviously higher than that in the environmental loose type projection.
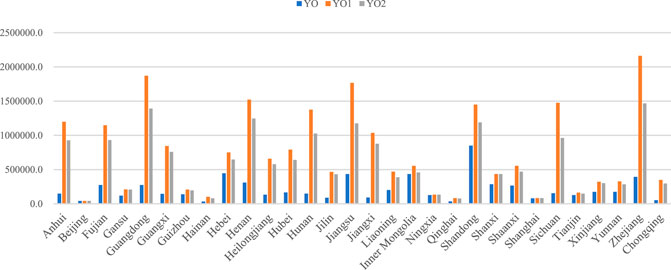
FIGURE 6. Average projection comparison for YO in 30 provinces during 2011–2015.
Conclusion and Policy Implications
Explanation and assessment of the water–energy nexus is important to the development of water–energy nexus research. This study develops a network DEA approach for assessing the efficiency of the water–energy nexus system. Specifically, the additive efficiency aggregation network DEA approach is introduced to evaluate the overall efficiency of the industrial water–energy nexus system. Then based on the economic priority principle and the environment priority principle, the decomposition of sub-efficiencies in IP and WT subsystems is obtained by introducing the “leader–follower” model. And the frontier projections of inefficient DMUs are given in terms of both the environmental loose-type and the economic loose-type projections. Finally, the proposed approach is applied to evaluate the efficiencies of the industrial water–energy nexus system and to give projection points of inefficient provinces or urban areas during 2011–2015.
The results show that the average overall efficiencies in Tianjin, Inner Mongolia, Chongqing, Hebei, Shanghai, Jilin, and Shandong provinces are relatively high, while the efficiencies in Hubei, Shanxi, Hainan, Guizhou, Yunnan, Gansu, and Xinjiang are low. In terms of sub-efficiencies, most provinces perform better in the IP subsystem than in the WT subsystem, which means that wastewater treatment is not performed well in most regions of China. Moreover, the environment priority strategy (economic loose type) is more suitable for the sustainable industrial water–energy nexus system since the potential improvement spaces are higher than the economic priority. Based on the above conclusions, we offer the following policy implications: 1) For the provinces that perform relatively poor in the industrial water–energy nexus system, the local governments should implement and optimize industrial water-saving and energy-saving as well as sewage disposal policies and regulations. Advanced industrial water-saving technologies and related latest equipment should be actively introduced and promoted in the industrial water treatment. 2) In reaction to the phenomenon that the IP subsystem performs better than the WT subsystem in most provinces, on the one hand, industrial structural adjustment and technological upgrading in wastewater treatment and recycling should be greatly strengthened. On the other hand, industrial enterprises should reduce the total amount of water consumption and actively implement cleaner production technology, accelerate the construction of wastewater treatment facilities, and promote the operation supervision of industrial production. 3) To carry out more effective environment priority strategy (economic loose type), the government and enterprises should attach great importance to the comprehensive treatment of industrial wastewater and water environmental pollution. How to transform the industrial sewage into available resources is a crucial application, such as auditing the industrial water, improving the rate of reused and recycled water, strictly managing industrial waste water discharge standards, and strengthening monitoring and evaluation systems in water quality.
Nevertheless, the complexity and uncertainty embodied in the industrial water–energy nexus evaluation convince us that no single method can be viewed as the most authoritative approach. First, our approach takes into account the internal structure of the production process, which may ignore technology heterogeneity caused by temporal and spatial factors. Second, the dynamic correlation of panel data has not been considered in the model. Third, in addition to input and output indexes, external factors may also affect the water–energy nexus efficiency. For future study, the meta-frontier approach, dynamic network DEA models, and regression models would be introduced to obtain more information with respect to water–energy nexus assessment.
Data Availability Statement
The original contributions presented in the study are included in the article/Supplementary Material; further inquiries can be directed to the corresponding author.
Author Contributions
SL contributed to the conception of the study and manuscript preparation; TD performed the analysis with constructive discussions; and YH performed the data analyses.
Funding
This research is supported by the National Natural Science Foundation of China under Grant (Nos. 71801068 and 71871081) and the Fundamental Research Funds for the Central Universities of China (No. JZ2020HGQA0178).
Conflict of Interest
SL is employed by Supporter&Sponsor technology (Shanghai) Co., Ltd.
The remaining authors declare that the research was conducted in the absence of any commercial or financial relationships that could be construed as a potential conflict of interest.
Supplementary Material
The Supplementary Material for this article can be found online at: https://www.frontiersin.org/articles/10.3389/fenrg.2021.707922/full#supplementary-material
References
Ahmad, S., Jia, H., Chen, Z., Li, Q., and Xu, C. (2020). Water-energy Nexus and Energy Efficiency: A Systematic Analysis of Urban Water Systems. Renew. Sust. Energ. Rev. 134, 110381. doi:10.1016/j.rser.2020.110381
Al-Ansari, T., Korre, A., Nie, Z., and Shah, N. (2015). Development of a Life Cycle Assessment Tool for the Assessment of Food Production Systems within the Energy, Water and Food Nexus. Sustainable Prod. Consumption 2, 52–66. doi:10.1016/j.spc.2015.07.005
Albrecht, T. R., Crootof, A., and Scott, C. A. (2018). The Water-Energy-Food Nexus: A Systematic Review of Methods for Nexus Assessment. Environ. Res. Lett. 13 (4), 043002. doi:10.1088/1748-9326/aaa9c6
An, Q., Yang, M., Chu, J., Wu, J., and Zhu, Q. (2017). Efficiency Evaluation of an Interactive System by Data Envelopment Analysis Approach. Comput. Ind. Eng. 103, 17–25. doi:10.1016/j.cie.2016.10.010
Charnes, A., and Cooper, W. W. (1984). The Non-archimedean CCR Ratio for Efficiency Analysis: A Rejoinder to Boyd and Färe. Eur. J. Oper. Res. 15, 333–334. doi:10.1016/0377-2217(84)90102-4
Chen, J., Ding, T., Wang, H., and Yu, X. (2019). Research on Total Factor Productivity and Influential Factors of the Regional Water-Energy-Food Nexus: A Case Study on Inner Mongolia, China. Ijerph 16 (17), 3051. doi:10.3390/ijerph16173051
Chen, Y., Cook, W. D., Li, N., and Zhu, J. (2009). Additive Efficiency Decomposition in Two-Stage DEA. Eur. J. Oper. Res. 196, 1170–1176. doi:10.1016/j.ejor.2008.05.011
CWRB (2018). China Water Resources Bulletin 2018Ministry of Water Resources of the People's Republic of China. China: Bejing.
De Stercke, S., Chaturvedi, V., Buytaert, W., and Mijic, A. (2020). Water-energy Nexus-Based Scenario Analysis for Sustainable Development of Mumbai. Environ. Model. Softw. 134, 104854. doi:10.1016/j.envsoft.2020.104854
Deng, G., Li, L., and Song, Y. (2016). Provincial Water Use Efficiency Measurement and Factor Analysis in China: Based on SBM-DEA Model. Ecol. Indicators 69, 12–18. doi:10.1016/j.ecolind.2016.03.052
Deng, H.-M., Wang, C., Cai, W.-J., Liu, Y., and Zhang, L.-X. (2020). Managing the Water-Energy-Food Nexus in china by Adjusting Critical Final Demands and Supply Chains: an Input-Output Analysis. Sci. Total Environ. 720, 137635. doi:10.1016/j.scitotenv.2020.137635
Ding, T., Wu, H., Jia, J., Wei, Y., and Liang, L. (2020). Regional Assessment of Water-Energy Nexus in China's Industrial Sector: An Interactive Meta-Frontier DEA Approach. J. Clean. Prod. 244, 118797. doi:10.1016/j.jclepro.2019.118797
Dong, K., Hochman, G., Zhang, Y., Sun, R., Li, H., and Liao, H. (2018). CO2 Emissions, Economic and Population Growth, and Renewable Energy: Empirical Evidence across Regions. Energ. Econ. 75, 180–192. doi:10.1016/j.eneco.2018.08.017
Duan, C., and Chen, B. (2020). Driving Factors of Water-Energy Nexus in China. Appl. Energ. 257, 113984. doi:10.1016/j.apenergy.2019.113984
Feng, C., Qu, S., Jin, Y., Tang, X., Liang, S., Chiu, A. S. F., et al. (2019). Uncovering Urban Food-Energy-Water Nexus Based on Physical Input-Output Analysis: The Case of the Detroit Metropolitan Area. Appl. Energ. 252, 113422. doi:10.1016/j.apenergy.2019.113422
Ge, J., and Lei, Y. (2017). Policy Options for Non-grain Bioethanol in China: Insights from an Economy-Energy-Environment CGE Model. Energy Policy 105, 502–511. doi:10.1016/j.enpol.2017.03.012
Ghani, H. U., Silalertruksa, T., and Gheewala, S. H. (2019). Water-energy-food Nexus of Bioethanol in pakistan: a Life Cycle Approach Evaluating Footprint Indicators and Energy Performance. Sci. Total Environ. 687, 867–876. doi:10.1016/j.scitotenv.2019.05.465
Hamiche, A. M., Stambouli, A. B., and Flazi, S. (2016). A Review of the Water-Energy Nexus. Renew. Sust. Energ. Rev. 65, 319–331. doi:10.1016/j.rser.2016.07.020
Han, D., Yu, D., and Cao, Q. (2020). Assessment on the Features of Coupling Interaction of the Food-Energy-Water Nexus in China. J. Clean. Prod. 249, 119379. doi:10.1016/j.jclepro.2019.119379
Hong, J., Zhong, X., Guo, S., Liu, G., Shen, G. Q., and Yu, T. (2019). Water-energy Nexus and its Efficiency in China's Construction Industry: Evidence from Province-Level Data. Sust. Cities Soc. 48, 101557. doi:10.1016/j.scs.2019.101557
Hussien, W. e. A., Memon, F. A., and Savic, D. A. (2018). A Risk-Based Assessment of the Household Water-Energy-Food Nexus under the Impact of Seasonal Variability. J. Clean. Prod. 171, 1275–1289. doi:10.1016/j.jclepro.2017.10.094
Ibrahim, M. D., Ferreira, D. C., Daneshvar, S., and Marques, R. C. (2019). Transnational Resource Generativity: Efficiency Analysis and Target Setting of Water, Energy, Land, and Food Nexus for OECD Countries. Sci. Total Environ. 697, 134017. doi:10.1016/j.scitotenv.2019.134017
Kiziltan, M. (2021). Water-energy Nexus of Turkey's Municipalities: Evidence from Spatial Panel Data Analysis. Energy 226, 120347. doi:10.1016/j.energy.2021.120347
Lee, L.-C., Wang, Y., and Zuo, J. (2021). The Nexus of Water-Energy-Food in China's Tourism Industry. Resour. Conservation Recycling 164, 105157. doi:10.1016/j.resconrec.2020.105157
Li, G., Huang, D., and Li, Y. (2016). China's Input-Output Efficiency of Water-Energy-Food Nexus Based on the Data Envelopment Analysis (DEA) Model. Sustainability 8 (9), 927. doi:10.3390/su8090927
Li, M., Fu, Q., Singh, V. P., Ji, Y., Liu, D., Zhang, C., et al. (2019). An Optimal Modelling Approach for Managing Agricultural Water-Energy-Food Nexus under Uncertainty. Sci. Total Environ. 651, 1416–1434. doi:10.1016/j.scitotenv.2018.09.291
Liang, L., Cook, W. D., and Zhu, J. (2008). DEA Models for Two-Stage Processes: Game Approach and Efficiency Decomposition. Naval Res. Logistics 55 (7), 643–653. doi:10.1002/nav.20308
Liu, Y., Chen, B., Chen, G., Li, Z., Meng, J., and Tasawar, H. (2020). Globalized Energy-Water Nexus through International Trade: The Dominant Role of Non-energy Commodities for Worldwide Energy-Related Water Use. Sci. Total Environ. 736, 139582. doi:10.1016/j.scitotenv.2020.139582
Owen, A., Scott, K., and Barrett, J. (2018). Identifying Critical Supply Chains and Final Products: an Input-Output Approach to Exploring the Energy-Water-Food Nexus. Appl. Energ. 210, 632–642. doi:10.1016/j.apenergy.2017.09.069
Ozturk, I. (2017). The Dynamic Relationship between Agricultural Sustainability and Food-Energy-Water Poverty in a Panel of Selected Sub-saharan African Countries. Energy Policy 107, 289–299. doi:10.1016/j.enpol.2017.04.048
Portney, K. E., Hannibal, B., Goldsmith, C., McGee, P., Liu, X., and Vedlitz, A. (2018). Awareness of the Food-Energy-Water Nexus and Public Policy Support in the United States: Public Attitudes Among the American People. Environ. Behav. 50 (4), 375–400. doi:10.1177/0013916517706531
Salmoral, G., and Yan, X. (2018). Food-energy-water Nexus: a Life Cycle Analysis on Virtual Water and Embodied Energy in Food Consumption in the Tamar Catchment, UK. Resour. Conservation Recycling 133, 320–330. doi:10.1016/j.resconrec.2018.01.018
Sharifinejad, A., Zahraie, B., Majed, V., Ravar, Z., and Hassani, Y. (2020). Economic Analysis of Water-Food-Energy Nexus in Gavkhuni basin in Iran. J. Hydro-environment Res. 31, 14–25. doi:10.1016/j.jher.2020.03.001
Sun, C., Yan, X., and Zhao, L. (2021). Coupling Efficiency Measurement and Spatial Correlation Characteristic of Water-Energy-Food Nexus in China. Resour. Conservation Recycling 164, 105151. doi:10.1016/j.resconrec.2020.105151
Wang, S., Cao, T., and Chen, B. (2017). Urban Energy-Water Nexus Based on Modified Input-Output Analysis. Appl. Energ. 196, 208–217. doi:10.1016/j.apenergy.2017.02.011
Wang, S., and Chen, B. (2016). Energy-water Nexus of Urban Agglomeration Based on Multiregional Input-Output Tables and Ecological Network Analysis: A Case Study of the Beijing-Tianjin-Hebei Region. Appl. Energ. 178, 773–783. doi:10.1016/j.apenergy.2016.06.112
Wang, X.-C., Klemeš, J. J., Long, X., Zhang, P., Varbanov, P. S., Fan, W., et al. (2020). Measuring the Environmental Performance of the EU27 from the Water-Energy-Carbon Nexus Perspective. J. Clean. Prod. 265, 121832. doi:10.1016/j.jclepro.2020.121832
WEFWI (2011). Water Security: The Water-Food-Energy-Climate Nexus (World Economic Forum Water Initiative). Washington DC, US: Island Press.
White, D. J., Hubacek, K., Feng, K., Sun, L., and Meng, B. (2018). The Water-Energy-Food Nexus in East Asia: a Tele-Connected Value Chain Analysis Using Inter-regional Input-Output Analysis. Appl. Energ. 210, 550–567. doi:10.1016/j.apenergy.2017.05.159
Xu, Z., Chen, X., Liu, J., Zhang, Y., Chau, S., Bhattarai, N., et al. (2020). Impacts of Irrigated Agriculture on food-energy-water-CO2 Nexus across Metacoupled Systems. Nat. Commun. 11 (1), 5837. doi:10.1038/s41467-020-19520-3
Yang, F., Wang, D., Zhao, L., and Wei, F. (2021). Efficiency Evaluation for Regional Industrial Water Use and Wastewater Treatment Systems in China: A Dynamic Interactive Network Slacks-Based Measure Mode. J. Environ. Manage. 279, 111721. doi:10.1016/j.jenvman.2020.111721
Yu, L., Xiao, Y., Zeng, X., Li, Y., and Fan, Y. (2020). Planning Water-Energy-Food Nexus System Management under Multi-Level and Uncertainty. J. Clean. Prod. 251, 119658. doi:10.1016/j.jclepro.2019.119658
Yuan, K., Lin, Y., Chiueh, P. T., and Lo, S. (2018). Spatial Optimization of the Food, Energy, and Water Nexus: a Life Cycle Assessment-Based Approach. Energy Policy 119, 502–514. doi:10.1016/j.enpol.2018.05.009
Yuan, M., Chiueh, P. T., and Lo, S. L. (2020). Measuring Urban Food-Energy-Water Nexus Sustainability: Finding Solutions for Cities. Sci. Total Environ. 752, 141954. doi:10.1016/j.scitotenv.2020.141954
Zhang, T., and Xu, Y. (2019). Evaluation on the Efficiency of Water-Energy-Food Nexus Based on Data Envelopment Analysis (DEA) and Malmquist in Different Regions of China. Int. J. Comput. Intelligence Syst. 12 (2), 1649–1659. doi:10.2991/ijcis.d.191209.002
Zheng, J., Wang, W., Chen, D., Cao, X., Xing, W., Ding, Y., et al. (2018). Exploring the Water–Energy–Food Nexus from a Perspective of Agricultural Production Efficiency Using a Three-Stage Data Envelopment Analysis Modelling Evaluation Method: a Case Study of the Middle and Lower Reaches of the Yangtze River, China. Water Policy 21 (1), 49–72. doi:10.2166/wp.2018.184
Zhou, X., Lou, R., Yao, L., Cao, S., and Wang, S. (2018). Assessing Integrated Water Use and Wastewater Treatment Systems in China: A Mixed Network Structure Two-Stage SBM DEA Model. J. Clean. Prod. 185, 533–546. doi:10.1016/j.jclepro.2018.02.278
Zhou, Y., Li, H., Wang, K., and Bi, J. (2016). Chinas Energy-Water Nexus: Spillover Effects of Energy and Water Policy. Glob. Environ. Change 40, 92–100. doi:10.1016/j.gloenvcha.2016.07.003
Keywords: water–energy nexus, network DEA, economic priority strategy, environment priority strategy, frontier projection
Citation: Liang S, Huang Y and Ding T (2021) Efficiency Evaluation and Projection Improvement of the Industrial Water–Energy Nexus in China Based on Network Data Envelopment Analysis. Front. Energy Res. 9:707922. doi: 10.3389/fenrg.2021.707922
Received: 11 May 2021; Accepted: 14 June 2021;
Published: 12 July 2021.
Edited by:
Kangyin Dong, University of International Business and Economics, ChinaReviewed by:
Feng Li, Southwestern University of Finance and Economics, ChinaYuqi Wei, Nanjing Audit University, China
Sheng Ang, University of Science and Technology of China, China
Copyright © 2021 Liang, Huang and Ding. This is an open-access article distributed under the terms of the Creative Commons Attribution License (CC BY). The use, distribution or reproduction in other forums is permitted, provided the original author(s) and the copyright owner(s) are credited and that the original publication in this journal is cited, in accordance with accepted academic practice. No use, distribution or reproduction is permitted which does not comply with these terms.
*Correspondence: Tao Ding, ZGluZ3Rhb0BoZnV0LmVkdS5jbg==