 Mathias Odje
 Roland Uhunmwangho
 Kenneth E. Okedu
- 1Department of Electrical and Electronic Engineering, University of Port Harcourt, Port Harcourt, Nigeria
- 2Department of Electrical and Communication Engineering, National University of Science and Technology, Muscat, Oman
- 3Department of Electrical and Electronic Engineering, Nisantasi University, Istanbul, Turkey
The privatization exercise that led to the creation of 11 distribution companies (Discos) is yet to yield the result of meeting the electricity supply needs of Nigeria. It is in realization of this fact that the Federal Government of Nigeria recently made different proposals and regulations to increase efficiency, availability, and competitiveness within the power industry. This article establishes a technical gain ratio to measure the impact of scaling up smart metering on the aggregated technical commercial and collection (ATC&C) losses. The ATC&C loss is the difference between the amount of electricity received by a distribution company from the transmission company and the amount of electricity for which it invoices its customers plus the adjusted collections loss. To achieve this objective, reviews of historical data of the Discos ATC&C losses and customers’ metering records as published by the Nigerian Electricity Regulatory Commission (NERC) for 2015, 2016, 2017, 2018, and 2020 were carried out. In addition, efforts were made to mathematically model the relationship between % metering and % ATC&C losses as this was the framework to help carry out effective forecasts and analyses of the study in order to show the impact level of the strategy employed. One of the salient technical contributions of this article was that it established that for every 1% increase in metering installation, there is a proportionate 0.8% decrease in ATC&C losses, provided all other factors responsible for technical and commercial losses remain constant. Consequently, improved ATC&C loss reduction would be achieved if Discos adopt a combination of other strategies that would ensure reduction in technical and commercial losses in addition to aggressive deployment of meter assets. However, in practice, factors causing technical and commercial losses are never constant as system components depreciate/burn out with time, energy theft, and pilferage, and meter tamper/bypass is on the increase daily; meter deployment is not aggressive enough to match utility customers’ growth. Hence, the adoption of combined modern strategies in addition to aggressive metering in tandem with customers’ growth has to be employed by Discos in a deliberate attempt to reduce ATC&C losses.
Introduction
The privatization of the power industry by the Federal Government of Nigeria was a thoughtful attempt to improve electricity supply, quality, and reliability across the country (Odje et al., 2018). This exercise resulted in the creation of 6 privately owned generation companies (Gencos), 11 privately owned distribution companies (Discos), and 1 government-owned transmission company (TCN). The government and its citizens were optimistic that the privatization exercise would help solve the erratic electricity supply (Adebayo, 2017). Unfortunately, the unbundling exercise undoubtedly had some gains but also came with its own huge challenges as it exposed the weakened power infrastructure, generation limitations, transmission, and distribution constraints that have deprived the power sector from tangible progress, in spite of the huge government appropriation over the years. More so, the failure of some Discos to attract the needed capital investment required for the dramatic turnaround of their licensed network coverage area leaves citizens wondering if reverting to the preprivatization structure would better serve the energy needs of consumers (Nigerian Senate Report (2, 2020).
In a bid to fast track the closure of the metering gap and encourage the development of independent and competitive meter services in the Nigerian electricity industry, the Nigerian Electricity Regulatory Commission (NERC) issued regulations called Meter Assets Provider (MAP), a scheme which allows to separate entities other than Discos to undertake the provision of metering services in order to meet the metering demand across the country (Nigerian Electricity Regu, 2020a). Furthermore, to break the monopoly of Discos and improve the efficiency of supply, the commission has begun a process of approving regulations that would allow for the subfranchising of Discos original licensed coverage areas to eligible independent investors for effective operation and management. This is a deliberate effort to increase the investors’ participation in providing financial liquidity that is required to aggressively build the power infrastructure (Nigerian Electricity Regu, 2019a). In line with this, the Nigerian Federal Government Electricity Roadmap proposal lamented on the underperforming state of the distribution systems, quoting the country’s per capita consumption of electricity as of 2015 as 0.15 MWh/capita as against those of other African countries like South Africa and neighboring Ghana, which are 4 MWh/capita and 0.3 MWh/capita, respectively, with the formal being the highest within the African continent. These constraints have undermined the integrity of existing capacities, resulting in the underutilization of the overall power supply system value chain [Siemens (2019). Electrici, 2019].
The distribution system, which is visibly the last mile in the electricity supply chain that is close to the load centers, is a critical infrastructure in the delivery of electricity to connected customers of the national power grid. Highlighting the distribution company challenges in the delivery of quality and reliable supply, the electricity roadmap techno-commercial proposal identified ATC&C losses, distribution network optimization, system expansion, reinforcement, and adequate capital investments as the underlying root causes of the seeming underperformances of Discos. This article therefore seeks to horizontally review the impact of aggressive deployment of smart meters on ATC&C losses as a strategy to drive Discos performances, bearing in mind how central this factor was in the selection of preferred bidders during the privatization exercise.
Electric energy meters which provide the interface for direct billing of consumers by the utility companies have undergone several advancements over the years as conventional electromechanical meters are being replaced with smarter electronic meters to improve accuracy in metering and provide key customer information for database creation, outage management, fault management, load management, network planning, etc. (Jeremy, 2016). Discos still face lean revenue realization owing to network losses, energy theft, meter tamper and/or bypass, and failure of the billing system to capture all billable customers and failure of billing officers to realize all billed energy. Use of analog postpaid meters has further compounded the Disco loss profile owing to error in reading energy consumption, delay in generating bills, distributing bills, shortfall in bill payment, energy consumption calculation disputes, etc. On the other hand, a smart meter is an electronic device with two-way communications that can automatically transmit customers’ energy consumption data as well as system operation information to the distribution operating center. Smart meters are prepaid meters and a newer kind of meters that can digitally send meter readings/data to the energy provider for more accurate energy bills. The prepayment mechanism is one of the best features of smart meters that allow for prepayment or pay as we go tariff. We pay for the energy before using it. The meter operates based on the amount/energy unit available at meters. The utility supply is fed to the smart energy meter which has a prepaid card embedded. The prepaid card feeds a low/high signal, i.e., open/close signal to the local contactor depending on the balance left in it. The contactor thus controls the supply to the consumer load, disconnecting it when the prepaid card runs out of balance. When the prepaid card is short of sufficient balance, the consumer makes a recharge request to the utility by prepayment. The utility having received the recharge amount recharges the prepaid card. The utility also receives information about the balance details from the card for the record purposes. Once the unit is exhausted, the meter interrupts/disconnects energy supply automatically. Supply is restored after successful recharging. Smart meters are equipped with antitamper features to detect tampering like missing potential, current transformer (CT), polarity reversal, and phase sequence reversal. Smart meter features include real time-and-date recording, load survey data, import/export data, and tele-metering-remote capacity, among others (Jain and Bagree, 2011; Jiang et al., 2016).
Literature Review
Distribution systems in Nigeria are faced with unique challenges in postprivatization due to the possible maximum thermal loading and wide-area power trading, with rapid varying load patterns, resulting in increasing congestion and energy losses. Losses represent a considerable amount of operating costs. Accurate estimation of electrical losses is imperative to determine with greater accuracy the operating cost for maintaining supply to consumers and accurate estimation of the system lifetime costs over the expected lifetime of the installation. Losses which occur during the process of supplying electricity to consumers from generation stations are classified into technical and nontechnical (commercial and collection) losses. Technical losses are due to energy dissipated in the conductors and equipment used for transmission, transformation, subtransmission, and distribution of power (Siddharth and Dhananjay, 2014; Nigerian Electricity Regu, 2019b).
Also, technical losses are due the system’s inherent material property and resistance it offers to the flow of current. Commercial losses occur when the billing process fails to include all billable energies, while collection losses are due to failure of the utility operator to realize revenue in consonance with the billed energy. Thus, ATC&C loss is the sum total of technical losses, commercial losses, and collection losses (shortage due to inability to collect the total billed amount). ATC&C loss is a key gauge to evaluate the financial healthiness of a power utility (Uhunmwangho and Okedu, 2014). The concept of ATC&C losses was adopted in the Multi-Year Tariff Order (MYTO-2.1) by the NERC during the period leading to the privatization of the power industry in 2013. It was a pivotal criterion for deciding preferred bidders. Distribution loss is the difference between energy injected into the system and the energy for which payment was made. It is the cumulative of the transmission and distribution (T&D) losses and loss due to nonrealization of payable demand (Nwohu et al., 2017).
Ideally, losses in an electric system should be about 3–6%. In developed nations, losses are about 10% and about 20% for developing nations. Research shows that ATC&C losses in Nigeria range between 29.4 and 59.1% (Africa-Middle-EastL, 2019). The French Development Agency (FDA) study of the Nigerian power sector performance revealed that the 11 Discos can reduce their ATC&C losses if they invest about N 216.144 billion ($ 600million) within the next 5 years from 2019 (Power Holding Company of, 2018). Hence, utility operators (Discos) in the country are interested in reducing their system’s losses so that they can be more competitive since price valuation in the deregulated market is a function of the system’s losses (Manju, 2014).
The reasons why technical losses occur in distribution systems span from inadequate investment for infrastructural improvement and over-lengthiness of distribution lines (HT/LT); the lack of adequate maintenance of equipment, substations, and lines; aging equipment; overloading of existing systems,; insufficient reactive power compensation and allocations; the lack of proper network reconfiguration and reconductoring to optimize the length of feeder lines; load balancing,; automatic network response capacities; and elimination of undersized conductors and cables (Mohsin, 2014). The reasons for commercial and collection losses include energy theft and pilferage, a poor metering efficiency, nonreading and erroneous reading of meters, inefficient billing, underbilling, faulty bill distribution, software errors, prolonged disputes, inadequate revenue collection caused by the nonchalant attitude of billing personnel, insufficient collection avenues, and consumer inability to pay for consumed energy (Nigerian Electricity Regu, 2020b). Thus, the three components that make up ATC&C losses are the technical, commercial, and collection losses. Technical losses vary with the transformation capacity of transformers, the conductor type used, and reactive loads among other factors. The total distribution feeder power loss is modeled as the variance between energy injected into a network and the energy consumed as shown in Eqs 1–3 (Mahmood, 2014)
where PT is the total distribution feeder loss, β is the high tension feeder loss, τ is the low tension feeder loss, λ is the input energy to the high tension feeder, ε is the export energy from the low tension feeder, ρ is the consumer’s billed energy, σ is the energy input to the low tension feeder, and γ is the billed energy of low tension consumers, respectively.
Commercial losses refer to the illegal consumption of energy. Meter tampering and bypassing in various forms, use of magnets to slow down electromagnetic meter types, damaging or altering of current and/or potential transformer circuits or ratios, and unauthorized resetting of meters are basically related to commercial losses through metering. The most common and visible form of commercial losses is the theft of energy by direct connection to the low tension lines. Distribution companies carry out billing against consumed energy by customers. Often, the utility company is not able to realize the full amount of revenue billed by it. The ratio of the total amount of revenue collected to the total amount billed is termed as collection efficiency. On the other hand, the ratio of total energy billed to the total energy inputted into the network is referred to as the billing efficiency. Therefore, ATC&C losses can be determined using the following relation (R-APDRP, 2009; Shahi, 2011; Gosh, 2012; Dodo, 2020):
where α represents the ATC&C losses, Γ is the billing efficiency, η is the collection efficiency, ϕ is the net energy billed, ω is the net input energy into the network, θ is the net amount of revenue realized from the customers, and π is the net amount of revenue billed by the utility company.
The functional process, measurement, and topology of loss measurements of ATC&C losses are displayed in Figure 1 using a block diagram (Kirankumar, 2013).
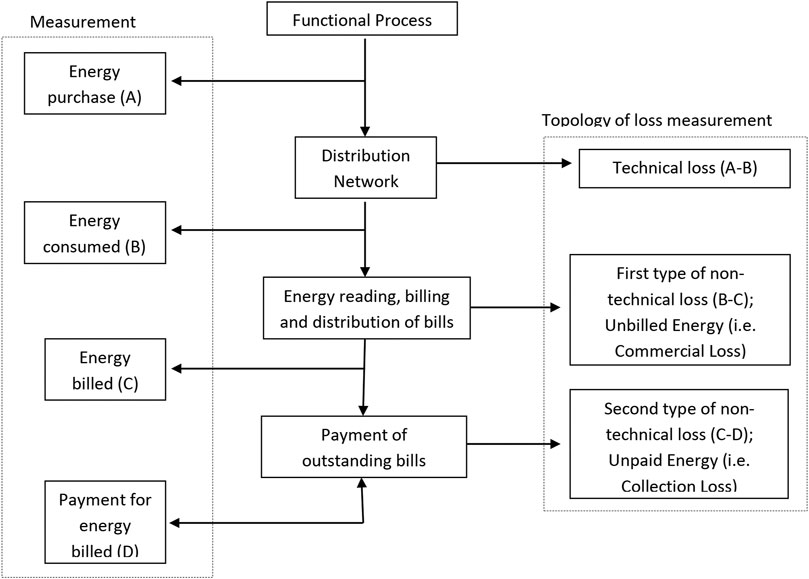
FIGURE 1. Functional process, measurements, and topology of loss measurements of ATC&C losses (Kirankumar, 2013).
Technical, commercial, and collection loss reduction measures are listed as follows (Ramesh, 2009; Ziari et al., 2010; Ramadoni, 2015; Ines, 2016; Amit and Jitender, 2017; Goran, 2018; Kapoor, 2019):
Technical loss reduction measures are as follows:
• Network reconfiguration and reconductoring.
• Adoption of aerial bunched cables for low voltage distribution lines to replace the all-aluminum conductor (AAC) being currently used.
• Adopt aggressive use of high voltage distribution systems (HVDSs)
• Adoption of widely spread distributed (embedded) power generation within the distribution networks.
• Installation of capacitor banks (shunt or series) for reactive power compensation.
• Install automatic voltage boosters
• Load balancing and load management
• Improve management of distribution transformers
• Regular network maintenance culture
• Increase HT:LT ratio
• Prevent insulator leakages, improve joints and connections, etc.
• Proper geographical information system (GIS), mapping of the network, data collection of the existing infrastructure status, and connected customer enumeration to provide decision making tools for investors to identify asset recapitalization needs
• Integration of modernized solutions
Commercial and collection loss reduction measures are as follows:
• Aggressive deployment and installation of smart prepaid energy meters with tamper and load survey logging features for all categories of consumers
• Sealing of meters with seals and having proper seal management systems
• Installation of CTs/PTs (current transformers/power transformers) in sealed meter boxes so that the terminals are not exposed for tampering and/or bypassing
• Ensure preinstallation testing of meters to confirm the accuracy
• Ensure accuracy in meter reading and billing activities
• Carry out regular energy audit covering the feeders and all end consumers to ensure that there is no revenue leakage beyond the permissible limit
• Strategically choose positions for energy meter installation to expose any illegal activities
• Provide adequate counters and customer collection centers
• Adopt e-bill payment platforms and online services
• Commission adequate collection agents
• Install electronic cash register and drop box facility
• User’s association, panchayats, and franchisees in billing and collection.
Ideally, optimizing the distribution networks to adopt high voltage distribution systems (HVDSs), aerial bunched conductor distribution lines, and smart prepaid energy meters’ installations would drastically reduce ATC&C losses to more than half the conventional low tension system with bare aluminum conductors.
Data Collection and Presentation
This article considered a secondary source of historic data published on the NERC website for 5 years (2015–2018, and 2020). This is with regard to the 11 distribution companies’ performances based on recorded percentage of aggregated technical, commercial, and collection losses and percentage of metered consumers for 2015 to 2018 and then 2020 (Nigerian Electricity Regu, 2019b; Nigerian Electricity Regu, 2020b). Note that historic data for 2019 were not published on the website by NERC; thus, the obvious omission and year 2020 historic data for % metered customers are zero owing to the impact of corona virus (COVID-19) pandemic lockdown measures. The published data from NERC do not provide numerical values of the numbers of smart meters installed over the period within the catchment areas of each Discos.
In order to demonstrate the impact smart metering scale-up has on ATC&C, we shall perform quantitative analysis of historical data to enable us make futuristic projections. The following are assumptions made:
• All the factors responsible for technical losses remain constant year over year. Hence, the change in technical losses from a year to the next becomes zero.
• All the factors responsible for commercial losses remain constant year over year. Hence, the change in commercial losses from a year to the next becomes zero.
• Discos adopt aggressive smart metering each year, and meters are equipped such that no tampering and meter bypass can occur; also, all billable customers have prepaid smart meters; thereby, 100% billed energy is realized yearly.
Applying these assumptions to account for losses year over year, it implies that the only factors accounting for changes on losses shall be only the level of penetration of smart metering. Therefore, Eq. 4 literally becomes
where Δ is the change on an year over year basis for the entity.
Thus, from Eq. 8, it can be deduced that the change in ATC&C losses year over year varies directly with change in collection losses and inversely with the change in smart metering year over year.
Based on the above, we can simplify Eq. 8 as follows:
Table 1 displays the 5 year historic records of ATC&C losses across the 11 Discos, while Table 2 provides information of percentage of installed prepaid meters in each of the Disco’s franchised network within the same period.
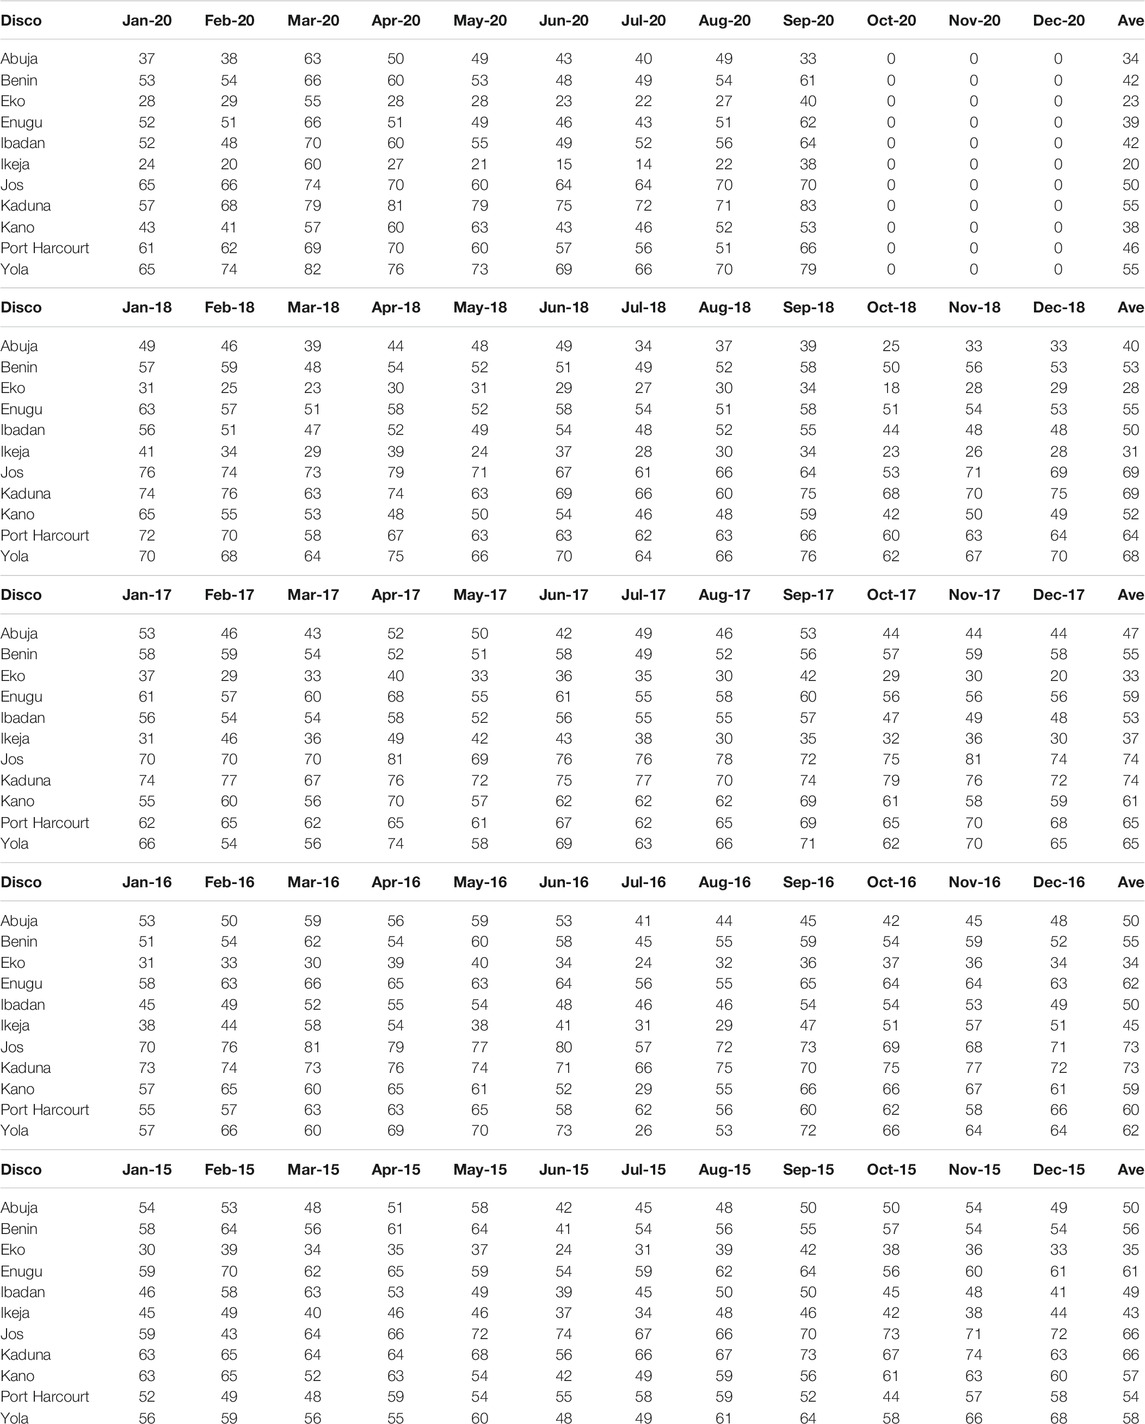
TABLE 1. Five year (2015–2018 and 2020) distribution company historic data for % of ATC&C losses (GWh).
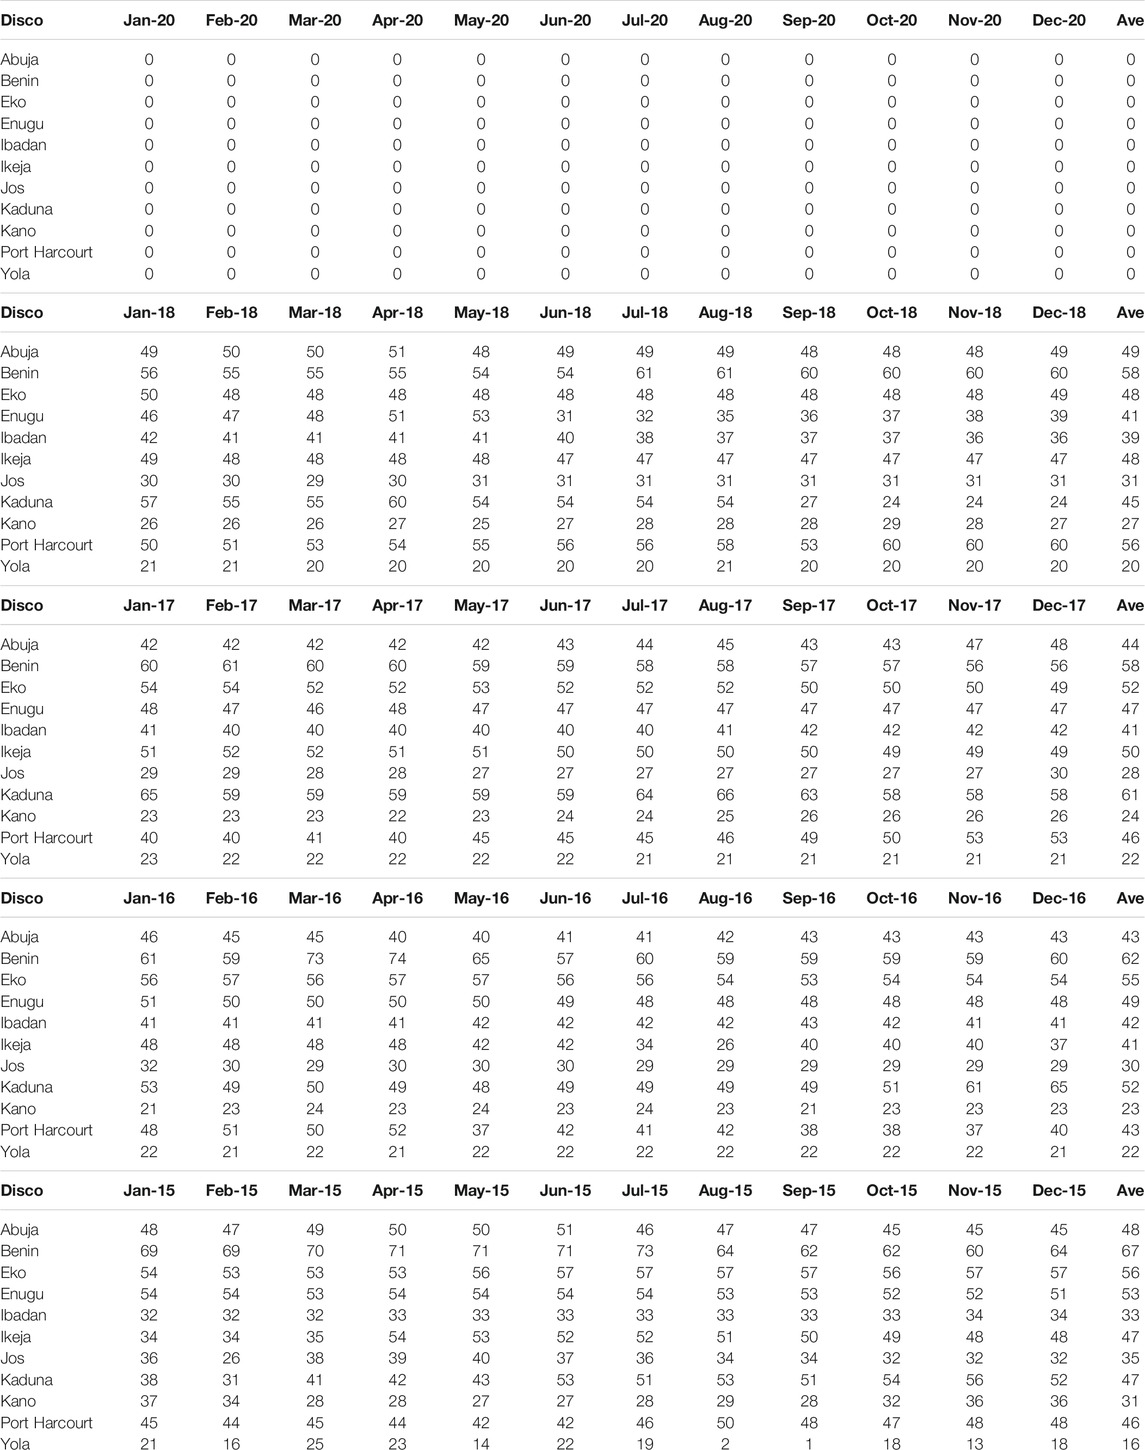
TABLE 2. Five year (2015–2018 and 2020) distribution company historic data for percentage of metered customers.
The historic data presented in Tables 1, 2 revealed the high level of ATC&C losses by the 11 Discos as summarized in Figure 2 and Table 3. Kaduna, Jos, and Yola recorded the highest 5 year cumulative average of ATC&C losses of 68% GWh, 66% GWh, and 61% GWh, respectively, while Eko has the lowest 5 year cumulative average of ATC&C losses of 31% GWh, then Ikeja with 35% GWh, and Abuja with 44% GWh. The data show clearly that only Ikeja Disco in 2020 was able to attain the internationally accepted 20% threshold value for ATC&C losses for developing countries. However, within the 5 year period, none of the Discos were able to achieve the 20% ATC&C loss threshold.
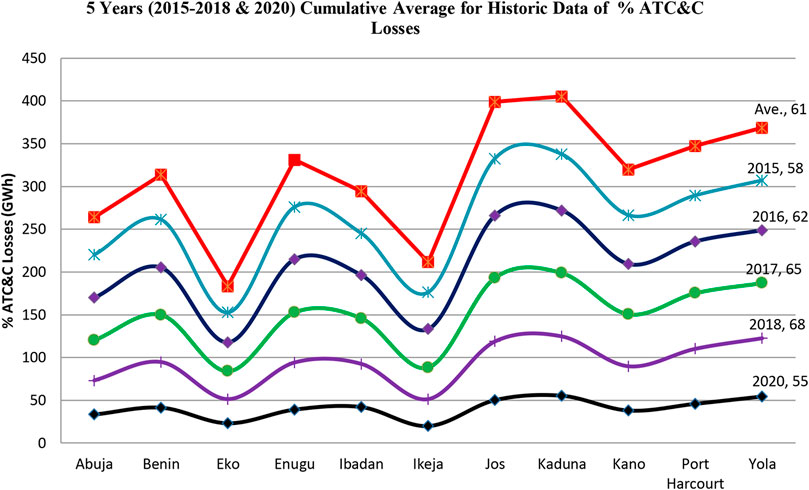
FIGURE 2. Five year (2015–2018 and 2020) cumulative average for historic data of % ATC&C losses (GWh).
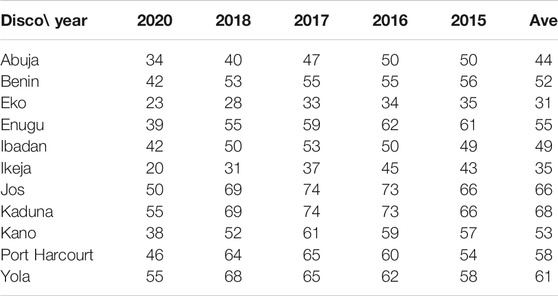
TABLE 3. Five year (2015–2018 and 2020) cumulative average for historic data of % ATC&C losses (GWh).
Presentation of Results and Analysis
In order to quantitatively analyze the effect of scaling up smart metering on ATC&C losses, we assumed that all the Discos in 2019 and 2020 implemented the strategy that would strengthen their systems to address all factors responsible for collection losses only (other factors remaining constant as per assumption) and ensure the scaling-up of smart energy meters deployment by MAPs that would result in a 25% increase in the number of customers being metered on a year over year basis. The probable effect of Discos adopting this strategy of a 25% increase in the number of metered customers’ strategy on ATC&C losses is shown in Tables 4, 5 for the years of 2019 and 2020, respectively.
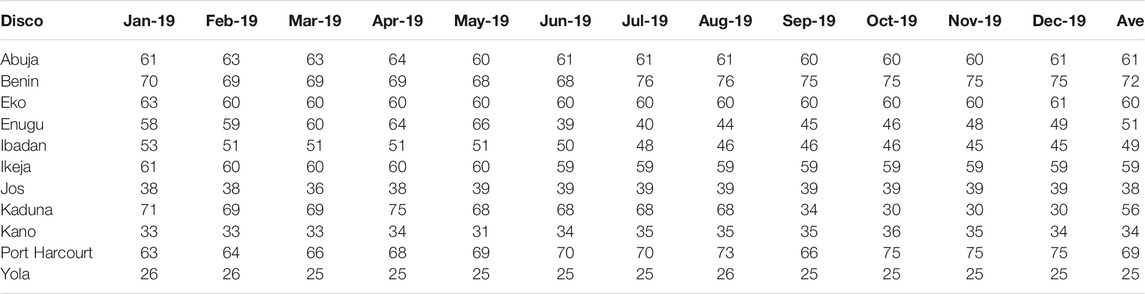
TABLE 4. Projection of Discos scaling-up customer metering by 25% in 2019 over 2018 historic data.
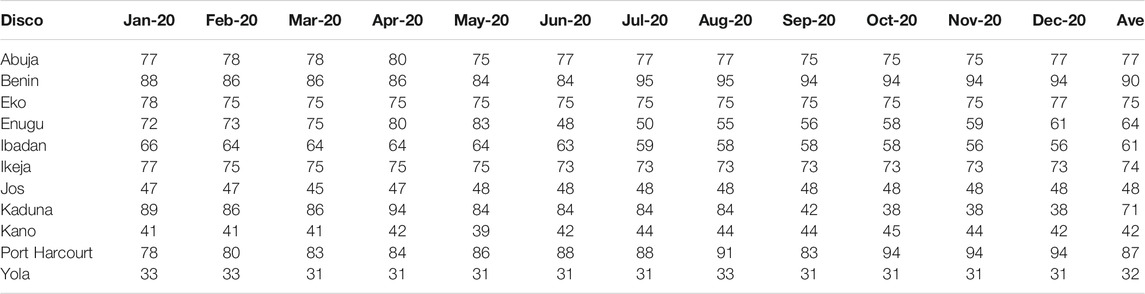
TABLE 5. Projection of Discos scaling-up customer metering by 25% in 2020 over 2019 historic data.
Consequently, the projection for the percentage of ATC&C losses for 2019 and 2020 as a result of a 25% increase in the percentage metered customers is generated by the application of Eq. 9 on historic data of Tables 1, 2 as presented in Tables 6–8, respectively.
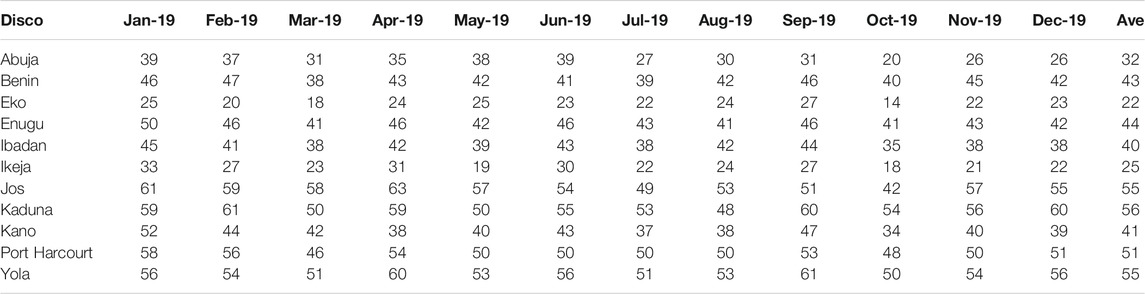
TABLE 6. 2019 projection of Discos % ATC&C owing to 25% metering scale-up (GWh).
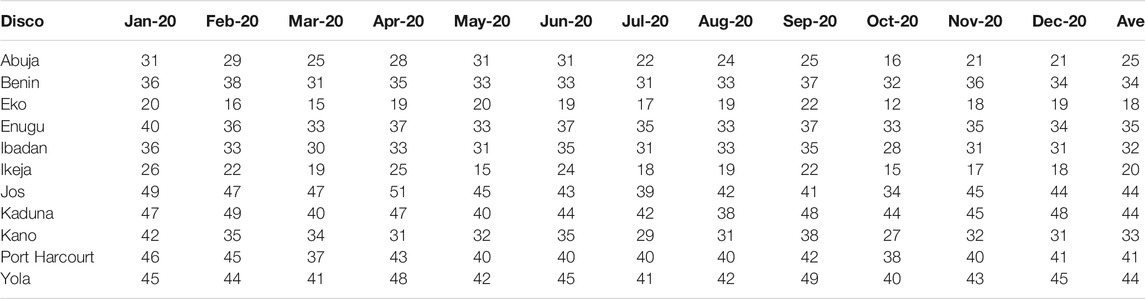
TABLE 7. 2020 projection of Discos % ATC&C owing to 25% metering scale-up (GWh).
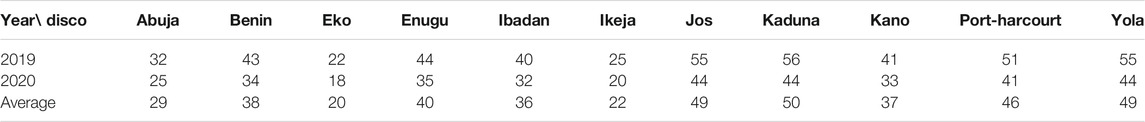
TABLE 8. Summary of 2019–2020 projection of % ATC&C losses due to 25% metering scale-up (GWh).
Performing apple-to-apple analysis, we will realize that the 25% metering scale-up resulted in a 20% reduction of ATC&C losses. Note that the Eko Disco 2019–2020 average % ATC&C value fell to 20% internationally acceptable threshold, whereas Ikeja and Abuja are some few values from attaining the threshold value. Also, it is remarkable to highlight the drop in average annual percentage of ATC&C losses consequently to 25% scale-up of customer metering. This implies that every 1% scale-up of metered customers yielded 0.8% ATC&C loss reduction. Figure 3 gives the graphical variance for 2020 between actual recorded values and projected values of % ATC&C losses, while Figure 4 shows the comparison between the actual recorded historic data for % ATC&C losses and the projected value for % ATC&C losses due to 25% metering scale-up from 2015 to 2020, assuming 2015 historic data as reference points.
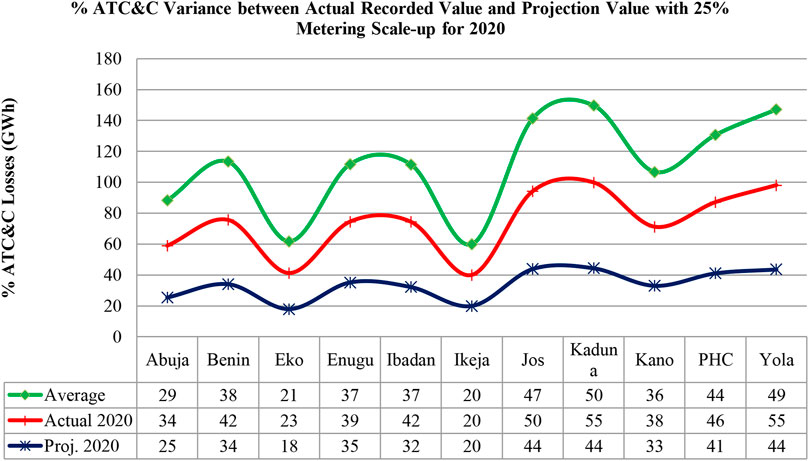
FIGURE 3. % ATC&C variance between the actual recorded value and projected value with 25% metering scale-up for 2020.
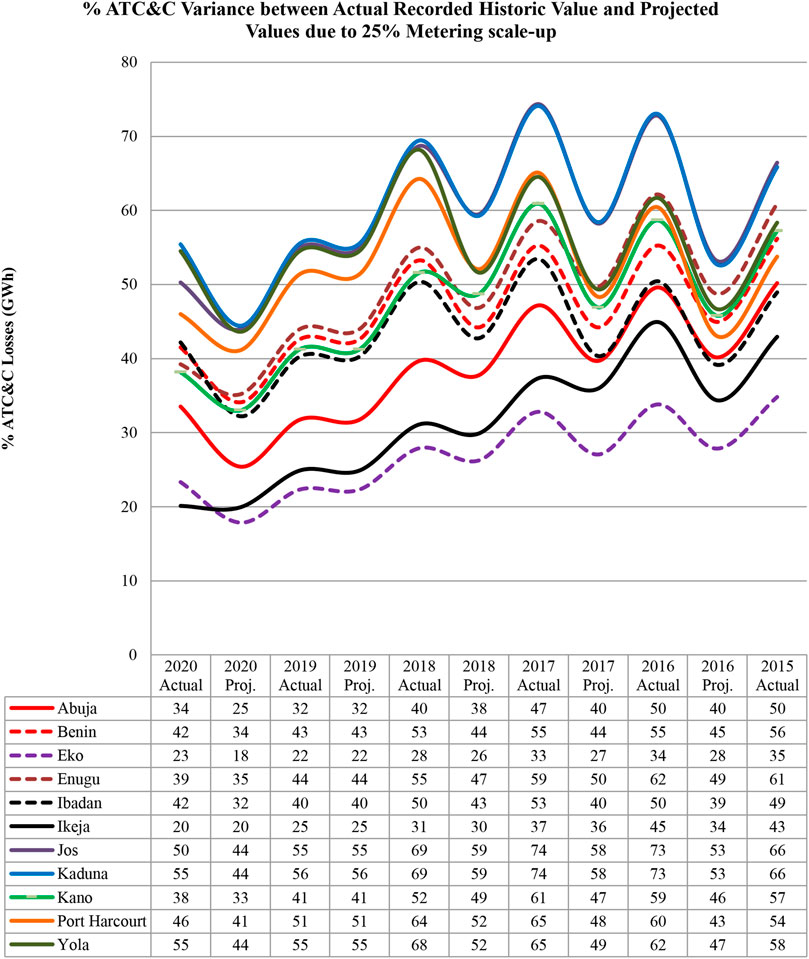
FIGURE 4. % ATC&C variance between the actual recorded historic value and projected values due to 25% metering scale-up.
Conclusion and Recommendations
This article was able to establish a direct gain ratio of smart metering scale-up of ATC&C losses as the presented results show that for every 1% increase of metered customers, there will be a 0.8% corresponding reduction in ATC&C losses. This unique finding will provide a direct gauge and guide for distribution companies’ (Discos’) planning, budgeting, and strategic policy framing for loss reduction as the gain ratio will further encourage meter asset deployment in the country aimed at improving Discos’ viability. Ultimately, implementing this strategy will translate to a better operation efficiency and cost savings for Discos operators and lower tariff for customers. Much more reduction in % ATC&C losses can be achieved if Discos would implement measures that compensate for network inadequacies that are responsible for technical losses and other factors causing commercial losses in addition to aggressive smart metering deployment and installation. These are demonstrated by the convergence in the year 2020 between historic data and projection due to 25% metering scale-up for Ikeja Disco. Although the historic data for 2020 metering were zero owing to the global impact of the COVID-19 pandemic for Ikeja Disco, the convergence of recorded 20% ATC&C losses implies that Disco might have implemented other measures of ATC&C loss reduction that compensated for network inadequacies, which are responsible for technical losses and other factors causing commercial losses.
In order to perform quantitative analysis of the historic data, we assumed that all the factors responsible for technical losses remain constant year over year. Hence, the change in technical losses from a year to the next year becomes zero. All the factors responsible for commercial losses remain constant year over year. Hence, the change in commercial losses from a year to the next year becomes zero. Discos adopt aggressive smart metering each year, and meters are equipped such that no tampering and meter bypass can occur; also, all billable customers have prepaid smart meters; thereby, 100% billed energy is realized yearly. However, in practice, factors causing technical and commercial losses are never constant as system components depreciate/burn out with time, energy theft, and pilferage, and meter tamper/bypass is on the increase daily; meter deployment is not aggressive enough to match utility customers’ growth. Hence, adopting a synergy of modern strategies in addition to aggressive metering with customers’ growth has to be employed by Discos with drastic intentions to reduce ATC&C losses.
Data Availability Statement
The original contributions presented in the study are included in the article/Supplementary Material, and further inquiries can be directed to the corresponding author.
Author Contributions
MO did the conceptualization, collection, and data analysis of the paper; RU did the literature review and data analysis of the paper; and KO did the data analysis and writing of the paper.
Conflict of Interest
The authors declare that the research was conducted in the absence of any commercial or financial relationships that could be construed as a potential conflict of interest.
Publisher’s Note
All claims expressed in this article are solely those of the authors and do not necessarily represent those of their affiliated organizations or those of the publisher, the editors, and the reviewers. Any product that may be evaluated in this article or claim that may be made by its manufacturer is not guaranteed or endorsed by the publisher.
References
Adebayo, O. Adedeji. (2017). Privatisation and Performance of Electricity Distribution Companies in Nigeria. J. Public Adm. Governance 7 (3), 1–14.
Amit, K., and Jitender, S. (2017). Study on Technical & Commercial Losses in Power Distribution System. Int. J. Eng. Res. Appl. 7 (9Part -7), 32–37.
Dodo, U. A. (2020). Appraisal of Aggregate Technical, Commercial and Collection Losses in Nigerian Electricity Distribution System. Niger. J. Technol. Dev. 17 (4), 286–294.
Goran, S. (2018). Strategies for Reducing Losses in Distribution Networks. UK: Imperial College London, 1–87.
Gosh, S. (2012). Loss Reduction and Efficiency Improvement: A Critical Appraisal of Power Distribution Sector in India. Int. J. Mod. Eng. Res. 2 (5), 3292–3297.
Ines, B. (2016). Minimizing Non-technical Losses with Point-to-Point Measurement of Voltage Drop between Smart Meters. Int. Fed. Automatic Control. (Ifac) 49 (29), 206–211.
Jain, A., and Bagree, M. (2011). A prepared meter using mobile communication. Int. J. Eng. Sci. Tech. 3 (3), 160–166. doi:10.4314/ijest.v3i3.68432
Jeremy, D. W. (2016). Use of Smart-meter data to determine Distribution system topology. J. Eng., 1–26. doi:10.1049/joe.2016.0033
Jiang, Y., Liu, C.-C., and Xu, Y. (2016). Smart Distribution Systems. Energies 9, 297. doi:10.3390/en9040297
Kirankumar, M. (2013). Methods to Reduce Aggregate Technical and Commercial (ATC & C) Losses. Int. J. Eng. Trends Tech. 4 (5), 1501–1505.
Mahmood, M. (2014). Real-Time Study on Technical Losses in Distribution System. Int. J. Adv. Res. Electr. Elect. Instrumentation Eng. 3 (1), 131–137.
Manju, M. (2014). A Case Study on Issues and Challenges faced during Strengthening of a Distribution Unit by Reducing Aggregate Technical and Commercial Loss. Int. J. Electr. Elect. Res. 2 (1), 1–6.
Mohsin, M. (2014). Real Time Study on Technical Losses in Distribution System. Int. J. Adv. Res. Electr. Elect. Instrumentation Eng. 3 (1), 1–7.
Nigerian Electricity Regulatory Commission (2020). Distribution Company Percentage of Metered Customers (Metering Progress).
Nigerian Electricity Regulatory Commission (2019). Electricity Demand for Discos, Groups and Consumers.
Nigerian Electricity Regulatory Commission (2019). Industry-Statistics-Distribution Companies Percentage of ATC&C Losses.
Nigerian Electricity Regulatory Commission (2020). Meter Assets Provider Regulations on Metering Gap.
Nwohu, N. M., Mohammed, A. S., and Dodo, U. A. (2017). Methodology for Evaluation of Aggregate Technical, Commercial and collection (ATC&C) Losses in a Typical Radial Distribution System. Int. J. Res. Stud. Electr. Elect. Eng. 3 (2), 1–10. doi:10.20431/2454-9436.0302001
Odje, M., Uhunmwangho, R., and Okedu, K. (2018). The hydropower potential and feasibility analysis of Sombriero River, Rivers State, Nigeria. Nig. J. Tech. 37 (2), 440–444. doi:10.4314/njt.v37i2.19
R-APDRP (2009). “Methodology for Establishing Baseline at & C Losses,” in A Report on the Restructured Accelerated Power Development and Reforms Programme (R-APDRP) of Governement of India (India: Power Finance Corporation Limited).
Ramadoni, S. (2015). Performance Improvement of Radial Distribution Network with Distributed Generation Using Extended Particle Swarm Optimization Algorithm”. Int. Rev. Electr. Eng. 10 (2), 1–12.
Ramesh, L. (2009). Minimization of Power Loss in Distribution Networks by Different Techniques. Int. J. Electr. Elect. Eng. 3 (4), 1–7.
Shahi, R. V. (2011). Presentation on Electricity Distribution Losses and Concept of Aggregate Technical and Commercial Loss. New Delhi, India: Lecture Presentation, Energy Infratech Pvt. Ltd.
Siddharth, N. K., and Dhananjay, B. M. (2014). Commercial Loss Reduction Techniques in Distribution Sector – an Initiative by MSEDCL. Int. J. Adv. Res. Electr. Elect. Instrumentation Eng. 3 (1), 1–7. doi:10.15662/ijareeie.2014.0307001
Uhunmwangho, R., and Okedu, K. E. (2014). Issues and Challenges in the Nigerian Electricity Industry: Case of Benin Electricity Distribution Company. J. Niger. Inst. Prod. Eng. 17, 128–133.
Keywords: distribution companies, aggregated technical, commercial, and collection losses, meter asset provider, Nigerian Electricity Regulatory Commission
Citation: Odje M, Uhunmwangho R and Okedu KE (2021) Aggregated Technical Commercial and Collection Loss Mitigation Through a Smart Metering Application Strategy. Front. Energy Res. 9:703265. doi: 10.3389/fenrg.2021.703265
Received: 30 April 2021; Accepted: 29 September 2021;
Published: 08 November 2021.
Edited by:
Chun Sing Lai, Brunel University London, United KingdomReviewed by:
Rui Wang, Northeastern University, ChinaXue Lyu, University of Wisconsin-Madison, United States
XU Xu, Nanyang Technological University, Singapore
Copyright © 2021 Odje, Uhunmwangho and Okedu. This is an open-access article distributed under the terms of the Creative Commons Attribution License (CC BY). The use, distribution or reproduction in other forums is permitted, provided the original author(s) and the copyright owner(s) are credited and that the original publication in this journal is cited, in accordance with accepted academic practice. No use, distribution or reproduction is permitted which does not comply with these terms.
*Correspondence: Kenneth E. Okedu, T2tlZHVrZW5uZXRoQG51LmVkdS5vbQ==, S2VubmV0aC5va2VkdUB1bmlwb3J0LmVkdS5uZw==, a2Vub2tlZHVAeWFob28uY29t