 Can Huang
 Yin-Jun Zhou
 Jin-Hua Cheng
- 1School of Economics and Trade, Hubei University of Economics, Wuhan, China
- 2School of Economics and Management, China University of Geosciences, Wuhan, China
- 3Key Laboratory of River Regulation and Flood Control of Ministry of Water Resources, Changjiang River Scientific Research Institute, Wuhan, China
- 4Three Gorges Water Conservancy Complex Cascade Dispatch and Communication Center, Yichang, China
Based on the statistical data from 1997 to 2017, with the utilization of the IPCC carbon accounting method, Tapio decoupling model, and Logarithmic Mean Divisia Index (LMDI), the temporal evolution characteristics of Qinghai’s energy-related carbon emissions, the decoupling relationship, and its driving factors were analyzed. The results indicated that 1) The carbon emissions of Qinghai showed a trend of first slowly increasing, then rapidly increasing, and finally fluctuating and decreasing. It increased from 3.85 million tons in 1997 to 14.33 million tons in 2017, with an average annual growth rate of 6.79%. The carbon emission intensity revealed a steady downward trend, from 189.82 tons/million CNY in 1997 to 54.6 tons/million CNY in 2017, with an average annual growth rate of –6.04%. 2) The relationship between carbon emissions and economic growth was represented by four types: weak decoupling, strong decoupling, expansion negative decoupling, and expansion coupling. Among them, a strong decoupling was achieved only in the five periods of 1997–1998, 1999–2000, 2001–2002, 2013–2015, and 2016–2017. 3) The structural effect of energy consumption was the paramount factor in restraining carbon emissions, followed by the energy intensity effect, while economic growth, and population size were important factors facilitating the increase in carbon emissions. To this end, Qinghai should continuously optimize its energy structure and improve energy utilization efficiency, thus achieving economic green and high-quality development.
1 Introduction
Climate change and global warming have become important issues of common concern for countries all over the world in the 21st century. Carbon emissions (CO2) from the consumption of fossil energy in economic activities are the most important factor that gives rise to climate warming (Hirota et al., 2006). In 2018, global CO2 emissions from fossil fuels and industry were increased by 2.1% over the previous year, and the global CO2 emissions caused by human activities reached 36.6 billion tons (Huang et al., 2021). To cope with climate change, many countries have taken the action plan to reduce carbon emissions and made important commitments to achieve net-zero carbon emissions by the middle of the 21st century. For example, at the 75th United Nations General Assembly, China proposed that China’s CO2 emissions will strive to reach the peak before 2030 and spare no effort to achieve carbon neutrality by 2060. As the world’s largest economy, the United States has also set its emission reduction target as “to reduce CO2 emissions by 17% and 26–28% on the basis of 2005 by 2020 and 2025, respectively”, and from 2007 to 2006, United States emissions did stop growing, dropped by nearly 13.6% (Wang et al., 2020). So far, 127 countries have pledged to achieve carbon neutrality by the middle of the 21st century. Compared with developed countries that have completed industrialization, developing countries are going through a period of industrialization. Most of these countries regard traditional manufacturing as their major industry. Energy is a catalyst for rapid economic growth in these countries, leading to a significant increase in energy consumption such as coal, crude oil, and electricity (Husaini and Lean, 2015; Saqib et al., 2021). As the largest developing country in the world, it is very difficult for China to not only complete industrialization but also reach carbon neutrality from the peak of carbon in just 30 years.
There is growing interest in the relationship between economic development and carbon emissions in academia. How to reduce emissions while maintaining economic development is a traditional problem that lies in the academic and decision-making levels. The Qinghai-Tibet Plateau is a special region of China. As a crucial part of the global climate system, climate change will exert a substantial influence on the regional ecosystem. Moreover, this region had the greatest temperature increase in the past few decades (Sun et al., 2008; Dong et al., 2019), so it is facing tremendous international pressure to lower carbon emissions for this area. Since the 18th National Congress of the Communist Party of China, Chinese President Jin-ping Xi has attached great importance to ecological construction and environmental protection of Qinghai-Tibet Plateau, insisting on protecting the ecology as a major issue related to the survival and development of the country, and promoting the Qinghai-Tibet Plateau to become a model for the construction of ecological civilization via various measures such as the development of circular economy, promotion of ecological poverty alleviation, the implementation of the three-river source national park system, and the construction of ecological safety barriers (Li, 2018).
Qinghai is situated in the northeast of the Qinghai-Tibet Plateau. As the source of China’s “Three Rivers” and the main part of the Qinghai-Tibet Plateau, it is also a barrier for China’s ecological security and an important area where biodiversity is concentrated. Qinghai shoulders the great responsibilities of protecting the source of the Three Rivers and the China Water Tower. Therefore, ecological protection in Qinghai is a major issue related to the ecological security of the country.
Currently, Qinghai has the smallest carbon emissions among all provinces of China, except for Tibet. The changes in its carbon emissions are bound up with the adjustment of the economic structure. During the period of the “Western Development” strategy, high-carbon emission industries such as electricity, oil and gas, Salt Lake chemicals, and non-ferrous metals have become its four pillar industries. However, in the past decade, Qinghai’s temperature has risen by 1.4 degrees, twice the global warming rate, which has brought about glacier melting and a series of ecological risks. Therefore, Qinghai has taken the lead in industrial restructuring and ecological compensation in the plateau region. Since 2011, due to the gradual attention paid to environmental pollution, new energy, new materials, equipment manufacturing, and biological industries have gradually developed. In particular, in terms of energy, photovoltaic power generation has grown by 38% annually through vigorous development of clean energy, and now it ranks first in China. Moreover, the world’s first ultra-high voltage transmission channel of clean energy has been built, which transmits clean electricity to other provinces and significantly reduces carbon emissions. In 2013, Qinghai completed the first carbon emission trading project in western China. In 2016, the Sanjiangyuan National Park was established, which was officially designated as a national ecological barrier area. Beyond that, affected by the “Qilian Mountain series of environmental pollution cases”, a large number of illegal or unqualified mines have been closed in this area, bringing a significant reduction of carbon emissions. By contrast, the service industry has made considerable progress, accounting for almost half of GDP. The changes in Qinghai’s industrial structure and environmental protection policies are a concentrated reflection of the whole country. Studying the relationship between carbon emissions and economic development in Qinghai will be a valuable reference for other regions of China and even other underdeveloped regions in the world.
The remainder of this paper is organized as follows. Section 2 is a literature review, which summarizes the influencing factors of carbon emissions and related research methods. Section 3 introduces the methods and data sources used in this paper. Section 4 presents the results of the calculation, and the last part is the conclusion and countermeasures.
2 Literature Review
The huge carbon emissions caused by energy consumption and economic growth have led to the emergence of a large number of academic papers on the relationship between economic growth and carbon emissions, and many achievements have been made based on the environmental Kuznets hypothesis (EKC) and decoupling theory. However, there are big differences in research conclusion, such as the monotonic increase between the two (Shafik, 1994; Wagner, 2008; Zoundi, 2017), decreasing (Abdou and Atya, 2013), inverted U-shaped (Selden and Song, 1994; Panayotou et al., 1999; Galeotti et al., 2006; Apergis, 2016; Zambrano-Monserrate et al., 2016; Wang et al., 2017; Ali et al., 2021), N-type relationship (Moomaw and Unruh, 1997; Friedl and Getzner, 2003; Martinez -Zarzoso and Bengochea-Morancho, 2004; Sinha et al., 2017), and no correlation relationship exist (Lantz and Feng, 2006). The study of Dong et al. (2020a) also indicated that only for the relatively high-income countries is the EKC hypothesis valid.
Although the EKC hypothesis can depicts the dynamic relationship between the total amount of environmental pollution and economic growth, it cannot reveal the rate of change of the relationship between economic growth and environmental pollution. Influenced by the different research backgrounds, time ranges, explanatory variables and methods, there are big differences in the research conclusion (Shahbaz and Sinha, 2018).
Decoupling theory can well explain the rate of change of the relationship between economic growth and carbon emissions, and has been widely used in recent years. The application of decoupling to the environmental field was originated from the decoupling index model constructed by the Organization for Economic Co-operation and Development (OECD) in 2002. This index is used to measure the gradual deviation trends of environmental pollution or resource consumption with economic growth, which is divided into two types, absolute decoupling, and relative decoupling. Later, Vehmas et al. (2003) constructed a comprehensive framework for decoupling theory. Tapio (2005) further defined the difference between decoupling, coupling, and negative decoupling, and subdivided the three decoupling states into eight types, including weak decoupling, strong decoupling, recessive decoupling, weak negative decoupling, strong negative decoupling, expansive negative decoupling, expansive coupling, and recessive coupling. Since then, the Tapio decoupling index has been widely used in the relationship between carbon emissions and economic growth. The study of Zhang and Wang (2013) implied that the economic growth of Jiangsu Province has undergone stages of weak decoupling and strong decoupling, except for 2003–2005. Wang and Jiang (2019) used the Tapio decoupling model to analyze the decoupling elasticity between China’s economy and CO2 emissions from 2000 to 2014, and the results symbolized that the decoupling elasticity performed a downward trend. At the same time, there are two types of decoupling states: expansion negative decoupling (2002–2005) and weak decoupling (2000–2002 and 2005–2014). Wang et al. (2018) compared the decoupling effect of carbon emissions between China and India in 1980–2014 and realized that China’s carbon emissions were in a weak decoupling state, while the decoupling status of India was not regular. Research by Chen L et al. (2020) found that the decoupling effect between carbon emissions and economic growth in southwest China continued to increase from 2000 to 2015, and reached a strong decoupling state by 2015. Some studies have delved into the decoupling relationship from the perspective of industries, including the industry (Zhao et al., 2016; Meng et al., 2018), agriculture (Su et al., 2017), and power sector (Xie et al., 2019). Jiang et al. (2018) analyzed the carbon emissions of six major industries in China and realized that all industries are in a weakly decoupled state except for the transportation and agricultural sectors.
The research results on the influencing factors of carbon emissions show that income level, population size, energy intensity, energy structure, and carbon emission intensity are the main factors affecting carbon emissions. The results of O’ Mahony et al. (2012) in Ireland implied that scale effects increase carbon emissions in the transportation sector, while energy intensity effectively reduces carbon emissions in the residential sector. Cansino et al. (2015) believed that the primary factors influencing Spain’s carbon emissions should include carbon emission intensity, energy intensity, economic structure, economic activity, and population size, among which energy economic structure is the most important factor. Research by Ortega-Ruiz et al. (2020) on India emphasized that per capita income is the major factor for the increase of carbon emissions, and energy intensity is the major factor for the reduction of carbon emissions. Yang et al. (2020) found that the economic activity is the greatest driving force to promote carbon emissions of China, while the energy intensity is the biggest suppressor. Dong et al. (2020b) proposed that economic growth and population expansion should be the main reasons for the increase in global carbon emissions. Apergis et al. (2020) summarized the determinants of carbon dioxide emission intensity as energy intensity and carbon index (Apergis et al., 2020). Wang et al. (2020) decomposed the changes in carbon emissions of the United States into three major effects, including scale effect, technological effect, and structural effect. Among them, scale effect (income and population) increased carbon emissions, while technological effect (energy intensity and emission coefficient) reduced carbon emissions. Since technological innovation can improve energy utilization efficiency, reduce energy intensity and carbon emissions, it is also considered as an important influencing factor of carbon emissions (Chen J. D et al., 2020; Sun et al., 2020; Sun et al., 2021).
Although the above influencing factors of carbon emissions have been recognized by most scholars, it is generally believed that the driving factors of carbon dioxide emissions growth are different in regions with different per capita income levels, and the economic growth and energy consumption have significant differences in carbon emissions between developed and less-developed regions. For example, studies by Saidi and Mbarek (2016), Cai et al. (2018), and Waheed et al. (2019) show that energy consumption, carbon emissions, and economic growth in developed countries and regions have little dependence on economic growth. For economically underdeveloped countries and regions, industrialization, urbanization, and transportation have huge demand for energy, and economic growth has made a great contribution to carbon emissions (Wang et al., 2011; Zaman et al., 2017).
As an economically developed province (municipality directly under the Central Government) in China, the studies on carbon emissions in Jiangsu (Lu et al., 2015; Li and Jiang, 2017), Shanghai (Zhao et al., 2010; Gu et al., 2019), and Guangdong, Hong Kong and Macao (Zhou et al., 2018) have attracted more attention, but the carbon emissions problem of Qinghai, which is underdeveloped economy, has been seriously ignored. Existing research on the decoupling relationship between carbon emissions and economic growth in Qinghai is not clear, and the research on the influencing factors of carbon emissions is still lacking. Qinghai has an urgent need for economic growth. Meanwhile, the coal-based energy structure is difficult to change in the short term. In the context of China’s rapid industrialization and urbanization, large-scale infrastructure construction and transformation require a large amount of energy. Decoupling economic growth from energy consumption and carbon emissions as soon as possible is the main strategic goal of Qinghai in the future economic development. Therefore, exploring the changes in carbon emissions caused by energy consumption and its influencing factors, and analyzing its decoupling status with economic growth, has important reference significance for formulating reasonable emission reduction policies and maintaining ecological security.
3 Methods and Data
3.1 Carbon Emission Model
This study used the carbon emissions accounting method provided in the “IPCC (Intergovernmental Panel on Climate Change) Guidelines for National Greenhouse Gas Inventories” to measure the carbon emissions generated by the energy consumption from different fuels. According to the data provided by the official website of the National Bureau of Statistics, seven main fuels including coal, coke, crude oil, gasoline, kerosene, diesel, and fuel oil were selected in this paper while the following formula was applied to estimate carbon emissions:
In Eq. 1, C represents the total carbon emissions, Ci signifies the carbon emissions of fuel item i, Ei stands for the energy consumption of fuel item i, CCFi symbolizes the standard coal conversion coefficients of fuel item i, and Fi means the carbon emission factor of fuel item i. The standard coal conversion coefficients of various fuels were collected from the “China Energy Statistical Yearbook”, the carbon emission coefficients were derived from the IPCC reference value. The standard coal conversion coefficients and the carbon emission coefficient values of the seven main fuels are described in Table 1.

TABLE 1. Carbon emission calculation parameters.
3.2 Decoupling Model
Compared with the OECD decoupling index, the Tapio decoupling elasticity coefficient avoids the instability of base period selection and can more accurately embody the decoupling state (Zhao et al., 2016). Therefore, this paper dissected the decoupling of economic growth and carbon emissions based on the Tapio decoupling elastic coefficient theory. The decoupling state is divided into eight types, including weak decoupling, strong decoupling, recessive decoupling, weak negative decoupling, strong negative decoupling, expansive negative decoupling, expansive coupling, and recessive coupling (Table 2). The calculation method is as follows:
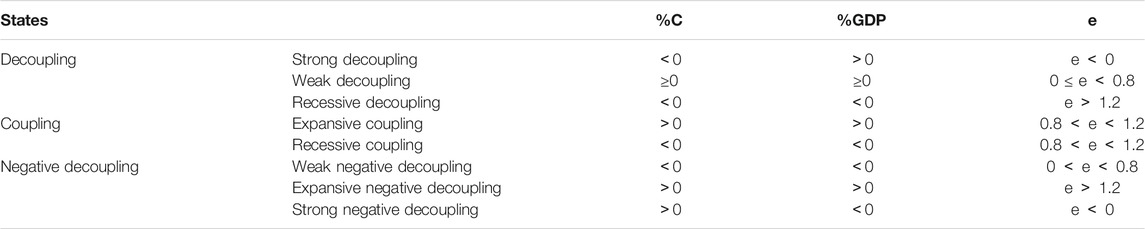
TABLE 2. Decoupling elasticity and decoupling state.
In the formula, e represents decoupling elasticity, which represents the ratio of the rate of change of carbon emissions to the rate of change of GDP. C% represents the percentage change in carbon emissions, and GDP% represents the percentage change in GDP. Ct and C0 mark carbon emissions in period t and base period 0, respectively, and Gt and G0 stand for GDP in period t and base period, respectively.
3.3 LMDI Decomposition Method
The LMDI (Logarithmic Mean Divisia Index) method, which has no residual error in the analysis process has been well applied. It can handle zero values in the data set while there are large differences in variable values. Given that it is easy to gain research data, thus it has certain advantages compared with other methods.
First and foremost, the carbon emission accounting method supplied by the IPCC was applied in this paper to figure up the carbon emissions of Qinghai Province from 1997 to 2017, and then the LMDI was adopted to decompose the influencing factors of carbon emissions into the carbon emissions coefficient impact, energy structure impact, energy intensity impact, GDP per capita impact, and population impact. The decomposition formula of carbon emissions is stated as follows:
In Eq. 3,
Based on the LMDI method, the change in carbon emissions from 1997 to year t can be expressed as:
In the formula,
The above five driving factors can be calculated by the following formula:
Since the carbon emission coefficients of various energy sources remain unchanged during the study period (Zhang and Da, 2015), that is, the ΔCFi is equal to 0. Thus, the comprehensive effect of carbon emissions can be expressed as:
3.4 Data Sources
The data in this paper came from “China Statistical Yearbook”, “China Energy Statistical Yearbook”, “Qinghai Statistical Yearbook”, and “IPCC National Greenhouse Gas Inventory Guidelines.” Among them, the GDP of Qinghai Province and the consumption of seven fuels of coal, coke, crude oil, gasoline, kerosene, diesel, and fuel oil were all originated from the “China Statistical Yearbook” offered by the NBS (National Bureau of Statistics of China) [NBS (National bureau of statistics of China), 2018], and the standard coal conversion coefficients for various fuels were from the “China Energy Statistics Yearbook” supplied by the DESNBS (Department of Energy Statistics, National Bureau of Statistics of China) [DESNBS (Department of Energy Statistics, National Bureau of Statistics of China), 2018], the carbon emission coefficient was derived from the reference value of the IPCC National Greenhouse Gas Inventory Guidelines (IPCC, 2006). The population size was viewed as the year-end permanent population of Qinghai. The data came from the 1997–2017 Qinghai Statistical Yearbook (Qinghai provincial bureau of statistics, 2018).
4 Results
4.1 Characteristics of CO2 Emissions and Carbon Emission Intensity
Figure 1 manifests the changing trend of carbon emissions and emission intensity in Qinghai Province. Except for a short-term decline in a few years, the carbon emissions have been growing in most years, increasing from 3.85 million tons in 1997 to 14.33 million tons in 2017, with an average annual growth rate of 6.79%. According to the characteristics of changes in carbon emissions, this period could be divided into three stages. The first stage ranged from 1997 to 2005 when carbon emissions rose slowly at an average annual growth rate of 4.01%. The second stage started from 2005 to 2013, during which carbon emissions were climbed rapidly at an average annual rate of 14.48%. The third stage was from 2013 to 2017, during which the average annual growth rate of carbon emissions was −2.02%, showing a fluctuating trend of decline.
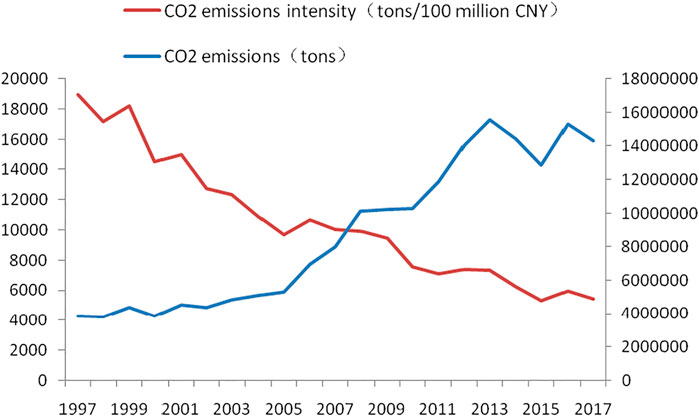
FIGURE 1. CO2 emissions and emission intensity in Qinghai Province.
Carbon emission intensity, which is defined as the ratio of carbon emissions to GDP, showing a steady downward trend, from 189.82 tons/million CNY in 1997 to 54.6 tons/million CNY in 2017, with an average annual growth rate of −6.04%. Except for the temporary increase in carbon emission intensity in 1998–1999, 2000–2001, 2005–2006, 2011–2012, and 2015–2016, the carbon emission intensity in other periods displayed a downward trend. Especially in 2001–2005 and 2012–2015, that is, during the “Tenth Five-Year Plan” and “Twelfth Five-Year Plan” period of Qinghai Province, carbon emission intensity was dropped at an average annual rate of −10.33% and −10.49%, respectively. During the tenth 5-year period, Qinghai Province guaranteed a stable supply of coal by advancing technological innovation and strengthening enterprise management, and effectively solving the contradiction that coal supply could not meet the requirements. The “Twelfth Five-Year Plan” period was a key period for Qinghai Province to facilitate ecological and environmental protection and construction. Despite carbon emissions increased during these two periods, energy efficiency has been greatly enhanced due to the use of clean energy and the implementation of Qinghai’s ecological security policy.
4.2 Analyses of the Decoupling Between CO2 Emissions and Economic Growth
According to the decoupling elasticity shown in Table 3, the relationship between carbon emissions and economic growth can be classified into four types: weak decoupling, strong decoupling, expansive negative decoupling, and expansive coupling. In most periods, the decoupling states were strong and weak decoupling. Decoupling elasticity in the five stages of 1997–1998, 1999–2000, 2001–2002, 2013–2015, and 2016–2017 was negative, indicating that carbon emissions were declining along with economic growth, that is, the economy remained in a state of strong decoupling. However, the elastic values of decoupling in the year 1998–1999, 2000–2001, 2005–2006, and 2011–2012 were relatively large, showing that the economy was in the state of expansive negative decoupling, that is, the growth rate of carbon emissions surpassed the rate of economic growth, and the economic development was at the cost of sacrificing the environment and extensive utilization of resources. In the periods of 2007–2008 and 2012–2013, the decoupling elasticity of Qinghai Province was 0.96 and 0.89, respectively, which was more than 0.8, indicating that the growth rate of carbon emissions was basically in sync with the economic growth. In the remaining periods, the decoupling relationship displayed a weak decoupling state. In these stages, both the carbon emissions and economic output of Qinghai were dropped, but the economic output was grown more quickly than the carbon emissions.
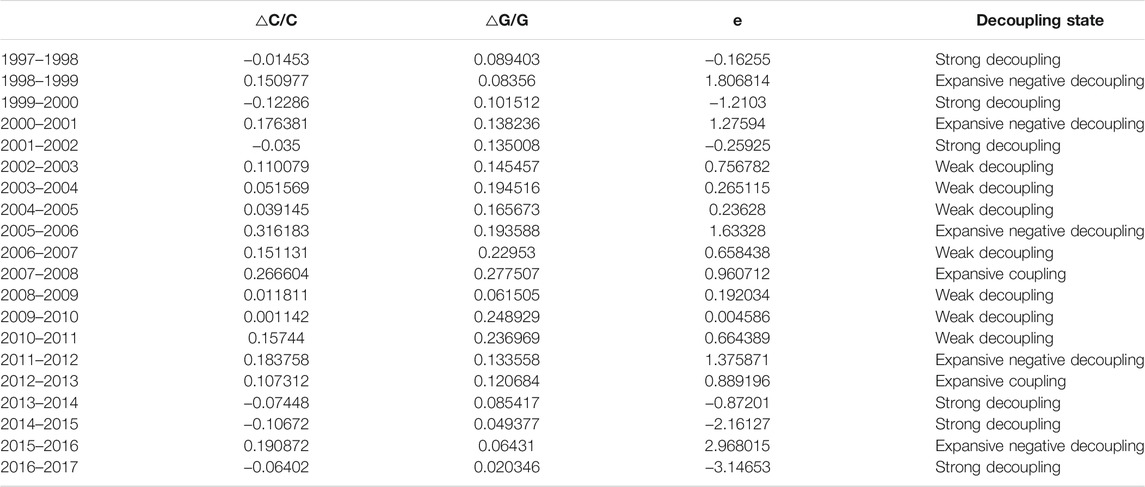
TABLE 3. The decoupling state for Qinghai over 1997–2017.
4.3 Decomposition Results of CO2 Changes
By taking the decomposition results into consideration, from 1997 to 2017, the carbon emissions triggered by the energy consumption structure effect was declined by 23,219.3 thousand tons and reached the maximum value especially in 2004–2005. The energy consumption structure representing the ratio between the consumption of various fuels and the total energy consumption in this paper is the paramount factor in restraining the increase in carbon emissions. Because of the decline in the proportion of coal consumption, and the promotion of low-carbon technology in Qinghai Province during this period, the acceleration of industrial transformation and upgrading to reinforce green development has increased the use of clean energy and alleviated the impact of coal consumption.
Figure 2 implies that coal has always been the main fuel and energy source in Qinghai Province, the consumption of coal during the study period has performed a continuous growth trend, from 3.93 million tons of standard coal in 1997 to 12.48 million tons of standard coal in 2017. In recent years, Qinghai has reduced its dependence on coal resources through the development of a circular economy and the continuous increase of the proportion of renewable energy. This has led to a continuous decline in the proportion of coal consumption in total energy consumption, from 73% in 1997 to 62.74% in 2017. As the main energy source in Qinghai, the decline in the ratio of coal consumption is an important reason for curbing carbon emissions. Crude oil also contributes a lot to energy consumption, which is becoming the second major source of carbon emissions. Its consumption has increased from 0.74 million tons of standard coal to 21.79 million tons of standard coal, but its share of total consumption has dropped from 13.72 to 10.96%. Compared with coal and crude oil, the proportion of coke and diesel has revealed an upward trend in recent years, rising from 2.37 to 2.78% in 1997 to 10.7 and 11.15% respectively, and their consumption has risen from 0.13 and 0.15 million tons of standard coal in 1997 to 2.18 and 2.22 million tons of standard coal in 2017.
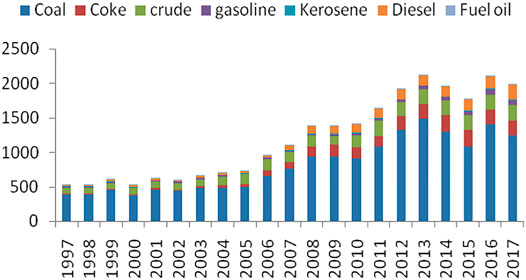
FIGURE 2. The composition of energy consumption in Qinghai Province (10 thousand tons of standard coal).
It can be seen from Table 4 that energy intensity is another substantial factor that accelerates the reduction of carbon emissions, followed by the energy consumption structure, and this effect has manifested an increasing trend during the study period. Energy intensity is the proportion of total energy consumption of the seven fuels in GDP, which can portray the energy utilization efficiency. The lower the energy intensity is, the higher the energy utilization efficiency will be. From 1997 to 2017, the energy intensity effect reduced carbon emissions by 10.36 million tons. The total energy consumption during this period highlighted a continuously increasing trend (Figure 3), with an average annual growth rate of 9.32%, from 7.07 million tons of standard coal in 1997 to 42.02 million tons of standard coal in 2017. Among them, energy consumption grew rapidly from 2002 to 2012, with a growth rate of 13.21%. Although the total energy consumption continues to increase, the energy intensity has shown a steady decline, from 3.49 tons/10,000 CNY in 1997 to 1.6 tons/10,000 CNY in 2017, implying that energy use efficiency has been continuously improved in the process of economic growth.
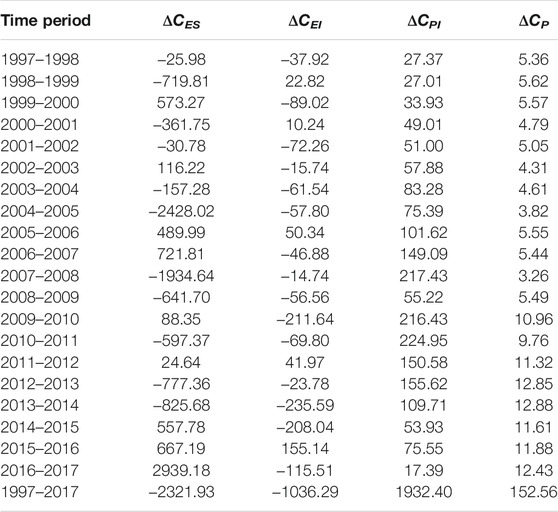
TABLE 4. Decomposition of energy-related carbon emissions changes (ten thousand tons).
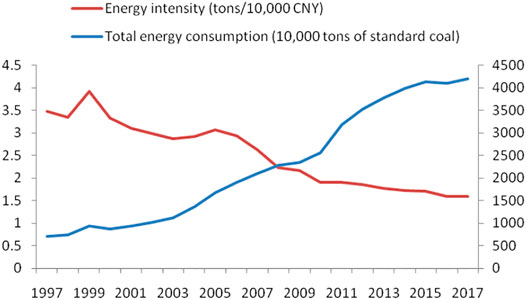
FIGURE 3. Changes in total energy consumption and energy intensity in Qinghai Province.
Table 4 indicates that economic growth is a vital factor to arouse the increase in carbon emissions, leading to 19.324 million tons of increase in carbon emissions from 1997 to 2017, and the contribution to carbon emissions implied a trend of increasing first and then decreasing. It is generally believed that the impact of economic growth on carbon emissions depends on how the economic structure is adjusted and what production methods are used. When the economic structure changes from agriculture to industry, the increase in output is bound to cause a rapid increase in carbon emissions, and when the economic structure changes from industry to the tertiary industry, carbon emissions will decrease. In addition, if an extensive production method based on inputs of production factors is adopted in the process of economic growth, it will bring about adverse effects such as high resource consumption and low production efficiency, leading to a rapid increase in carbon emissions. If an intensive production method aimed at improving total factor productivity is adopted, economic growth will shift from quantitative expansion to quality improvement, and carbon emissions will be significantly reduced. With the implementation of the country’s western development strategy, Qinghai’s per capita GDP has shown a rapid growth trend at an average annual rate of 10.47% (Figure 4), increasing from 4,088.51 CNY in 1997 to 43,893.48 CNY in 2017. Among them, the growth rate was the fastest from 2001 to 2013, with an average annual growth rate of 11.73%. During this period, the industrialization of Qinghai was advancing rapidly. Since the implementation of the Western Development Strategy in 2001, through a variety of market access in Qinghai and preferential tax policies, simplify examination and approval procedures for investment projects, encourage all kinds of enterprises and personal investment and participate in roads, Bridges, aviation, communication, water conservancy, and other infrastructure and urban public facilities construction, such as water supply, heat supply and gas supply. Some advantageous industries, such as salt lakes, electric power, non-ferrous metals, and non-metallic minerals, have been encouraged by policies, leading to rapid development of industrial industries. Industrial added value has maintained double-digit growth for many years in a row, and its growth rate was higher than that of GDP from 2001 to 2009. Industry has become the dominant force driving Qinghai’s economic growth, and the proportion of industrial added value in the region’s GDP has continued to increase. Industrialization and urbanization consume a lot of resources and energy. At the same time, because economic growth in this period mainly relied on large-scale investment in resources and other production factors rather than technology, the rapid increase in energy-intensive and high-emission industries has led to the rapid increase of energy consumption and high-emission industries. As a result, total energy consumption and carbon emissions are rising rapidly.

FIGURE 4. Changes in per capita real GDP and population in Qinghai Province.
The population expansion increases the total energy demand, and the concentration of population in cities and towns will also bring about concentrated consumption of energy and CO2 emissions, resulting in an increase in regional carbon emissions. From 1997 to 2017, the permanent population of Qinghai embodied a trend of continuous and steady growth (Figure 4), climbing from 4.97 million to 5.98 million, with an average annual growth rate of 0.87%. During this period, the urbanization rate of permanent residents (the ratio of urban permanent residents to the total population) in Qinghai rose from 34.69 to 53.07%. The increase in population, especially the increase in urban population, has increased Qinghai’s carbon emissions. Thus, it can be observed from Table 4 that the population scale impact caused an increase in carbon emissions of 1.53 million tons. Although the population size contributes a small amount to carbon emissions, its contribution to carbon emissions is demonstrating an increasing trend, which is also a non-negligible factor bringing the increase to carbon emissions.
5 Conclusion and Policy Implications
Compared with developed regions, the situation encountered by underdeveloped regions is even more severe, for the sake of driving China to realize the “dual carbon” goal by 2060. On the one hand, underdeveloped regions urgently need to expand their incomes by driving output to catch up with developed regions, while economic activities are the biggest contributors to carbon emissions, which will inevitably increase the difficulty of energy conservation and emission reduction. On the other hand, the urbanization experienced by Qinghai will also make the urban population continue to expand. Although the population impact has a weaker contribution to carbon emissions, its impact has a growing trend. As the urban population generates more carbon emissions than the rural population, and more investment is spent on urban infrastructure construction and renovation, this has also increased the pressure in underdeveloped regions.
In this paper, the Tapio decoupling elastic coefficient was applied to dissect the relationship between carbon emissions and economic growth in Qinghai Province from 1997 to 2017 whilst the LMDI decomposition method was utilized to expatiate the influencing factors of carbon emissions. The relationship between carbon emissions and economic growth reveals a transition from strong decoupling to weak decoupling and then strong decoupling. However, this change is not stable, which differs from China’s developed regions (such as Jiangsu Province), implying a stable weak or strong decoupling state (Zhang and Wang, 2013). In some years, expansive negative decoupling and expansive coupling occurred, showing that the contradiction between economic growth and carbon emission reduction in underdeveloped regions has become more prominent, and the implementation of related policies is more laboursome. Regarding the decomposition results of carbon emissions, economic growth, and population expansion are viewed as the primary causes for the increase in carbon emissions. Besides, the energy structure and energy intensity effects are vital factors that drive the reduction of carbon emissions. This conclusion fits well with previous research achievements (Zhao et al., 2010; Ortega-Ruiz et al., 2020; Yang et al., 2020) and can be applied to other regions of China or even other developing countries.
Economic growth is the most important reason for the increase in carbon emissions, which is related to the extensive growth pattern of Qinghai in the past few decades. Especially after the implementation of the Western Development Strategy, high-carbon industries have taken the lead, and residents’ consumption patterns have also undergone tremendous changes, leading to changes in carbon emissions from terminal consumption. The industries with the largest carbon emissions from terminal consumption have changed from agriculture, tobacco, and food industries to industries such as chemical products, oil, and gas extraction, non-metallic mineral products, electricity and heat production, and supply (Fan and Fang, 2020). The increase in population should be also responsible for carbon emissions, even if its impact is weaker than that of economic growth.
Nevertheless, with regards to the impacts of energy consumption structure on carbon emissions, the adjustment of the industrial structure by the national and Qinghai local governments after 2011 has caused some traditional heavy industries to be substituted by strategic emerging industries and modern service industries such as tourism. This has played a very good role in accelerating energy conservation and emission reduction, and also supplied Qinghai and other underdeveloped regions with a good reference to eliminate carbon emissions to some extent. The continuous decrease in energy intensity is another important reason for emission reduction. During the 12th Five-Year Plan period, Qinghai’s scientific and technological R&D expenditures and the circular economy added value accounted for 1.5 and 80% of the GDP respectively. Continuously strengthening the supporting capacity of capital, technology, and other factors, and promoting low-carbon technology has brought very good results to Qinghai.
Based on this, the following policy recommendations were proposed in this paper.
Firstly, it is better to keep optimizing the energy structure, implement low-carbon transformations in high-carbon industries such as electricity, oil, natural gas, chemicals, and non-ferrous metals, strengthen energy consumption management and control in high-energy-consuming industries, and eliminate outdated production capacity. Also, it is necessary to vigorously cultivate low-emission, high-efficiency strategic emerging industries, high-end manufacturing, and modern service industries, reduce the proportion of heavy industry, develop renewable and clean energy, increase the proportion of clean energy consumption, reinforce the energy utilization structure through industrial transformation and upgrading, and gradually reduce dependence on coal resources.
Then, it suggests declining energy intensity and improving energy efficiency. Energy intensity, however, is not infinitely reduced, and its effect on carbon emissions depends on the stage of industrialization (Zhao et al., 2010). Therefore, it is necessary to improve the input efficiency of production factors by virtue of continuous technological progress. Due to the low-income levels and local fiscal revenues in underdeveloped regions, it is essential to provide policy support from state finances and increase support for clean technologies and renewable energy, such as biomass, the solar, hydro, wind, and other low-carbon and non-carbon energy. The circular economy should continue to be implemented to shorten resource consumption. What’s more, the government also needs to continuously make innovations on investment and financing mechanisms and develop green finance, such as green credit and green bonds to gratify the investment and financing needs in the green and low-carbon fields, thus providing institutional guarantees for low-carbon development.
Last but not least, it is advised to reinforce the public propaganda of low-carbon consumption. Good consumption habits can restrain the increase in carbon emissions to a large extent. At present, per capita, household energy consumption in Qinghai is much lower than that in developed areas (Fan and Fang, 2020), which is closely associated with the ecological protection awareness of residents. In the future, it is necessary to further reinforce the green concept of “green water and green mountains are golden mountains and silver mountains”, advocate healthy and low-carbon lifestyles to people via communities and media, inspire residents to decline the use of fossil fuels, and strengthen the guidance of residents’ consumption habits. The government can also introduce low-carbon technology, develop low-carbon infrastructure, create a low-carbon experience environment, enhance consumer satisfaction with low-carbon consumption, and create good external conditions for low-carbon consumption.
However, the deficiency of this paper lies in the lack of in-depth analysis of the influence mechanism of energy intensity, energy structure, economic growth and population size on carbon emissions, and insufficient data is used. In future research, it is necessary to further build a carbon emission impact mechanism model and conduct empirical tests, and at the same time use more data to facilitate classification and comparison, so as to propose targeted countermeasures for different regions.
Data Availability Statement
Publicly available datasets were analyzed in this study. This data can be found here: The data in this paper mainly come from “China Statistical Yearbook”, “China Energy Statistical Yearbook”, “Qinghai Statistical Yearbook”, and “IPCC National Greenhouse Gas Inventory Guidelines.” Among them, the GDP of Qinghai Province and the consumption of seven fuels of coal, coke, crude oil, gasoline, kerosene, diesel, and fuel oil all come from the “China Statistical Yearbook” provided by the NBS (National Bureau of Statistics of China) (NBS, 2018), and the standard coal conversion coefficients for various fuels are from the “China Energy Statistics Yearbook” provided by the DESNBS (Department of Energy Statistics, National Bureau of Statistics of China) (DESNBS, 2018), the carbon emission coefficient is derived from the reference value of the IPCC National Greenhouse Gas Inventory Guidelines (IPCC, 2006). The population size is expressed as the year-end permanent population of Qinghai. The data comes from the 1997–2017 Qinghai Statistical Yearbook (Qinghai provincial bureau of statistics, 2018).
Author Contributions
CH contributed significantly to analysis and wrote the article; Y-JZ performed the method and the analysis with constructive discussions. J-HC provided important reference opinions when revising the paper.
Funding
This research was financially supported by the National Natural Science Foundation of China (Grant No. 42107504), the Humanities and Social Science Foundation of Ministry of Education, China (Grant No. 21YJC790052), and the Central Public-interest Scientific Institution Basic Research Fund (Grant No. 2021743 and No. 2021485).
Conflict of Interest
The authors declare that the research was conducted in the absence of any commercial or financial relationships that could be construed as a potential conflict of interest.
Publisher’s Note
All claims expressed in this article are solely those of the authors and do not necessarily represent those of their affiliated organizations, or those of the publisher, the editors and the reviewers. Any product that may be evaluated in this article, or claim that may be made by its manufacturer, is not guaranteed or endorsed by the publisher.
References
Abdou, D. M. S., and Atya, E. M. (2013). Investigating the Energy-Environmental Kuznets Curve: Evidence from Egypt. Ijge 7 (2), 103–115. doi:10.1504/ijge.2013.057436
Ali, A., Usman, M., Usman, O., and Sarkodie, S. A. (2021). Modeling the Effects of Agricultural Innovation and Biocapacity on Carbon Dioxide Emissions in an Agrarian-Based Economy: Evidence from the Dynamic ARDL Simulations. Front. Energ. Res. 8, 592061. doi:10.3389/fenrg.2020.592061
Apergis, N. (2016). Environmental Kuznets Curves: New Evidence on Both Panel and Country-Level CO2 Emissions. Energ. Econ. 54, 263–271. doi:10.1016/j.eneco.2015.12.007
Apergis, N., Payne, J. E., and Rayos-Velazquez, M. (2020). Carbon Dioxide Emissions Intensity Convergence: Evidence from Central American Countries. Front. Energ. Res. 7, 00158. doi:10.3389/fenrg.2019.00158
Cai, Y., Sam, C. Y., and Chang, T. (2018). Nexus between Clean Energy Consumption, Economic Growth and CO2 Emissions. J. Clean. Prod. 182, 1001–1011. doi:10.1016/j.jclepro.2018.02.035
Cansino, J. M., Sánchez-Braza, A., and Rodríguez-Arévalo, M. L. (2015). Driving Forces of Spain׳s CO2 Emissions: A LMDI Decomposition Approach. Renew. Sust. Energ. Rev. 48, 749–759. doi:10.1016/j.rser.2015.04.011
Chen, J. D., Xu, C., Xie, Q. J., and Song, M. L. (2020). Net Primary Productivity-Based Factors of China's Carbon Intensity: A Regional Perspective. Growth and change 51 (4), 1437–1953. doi:10.1111/grow.12423
Chen, L., Cai, W., and Ma, M. (2020). Decoupling or Delusion? Mapping Carbon Emission Per Capita Based on the Human Development index in Southwest China. Sci. Total Environ. 741, 138722. doi:10.1016/j.scitotenv.2020.138722
DESNBS (Department of Energy Statistics, National Bureau of Statistics of China) (2018). China Energy Statistical Yearbook 1998-2018. Beijing: China Statistics Press.
Dong, H., Song, Y., and Zhang, M. (2019). Hydrological Trend of Qinghai Lake over the Last 60 years: Driven by Climate Variations or Human Activities. J. W ater Clim. Change 10, 524–534. doi:10.2166/wcc.2018.033
Dong, K., Dong, X., and Jiang, Q. (2020a). How Renewable Energy Consumption Lower Global CO 2 Emissions? Evidence from Countries with Different Income Levels. World Econ. 43, 1665–1698. doi:10.1111/twec.12898
Dong, K., Hochman, G., and Timilsina, G. R. (2020b). Do drivers of CO2 Emission Growth Alter Overtime and by the Stage of Economic Development. Energy Policy 140, 111420. doi:10.1016/j.enpol.2020.111420
Fan, Y., and Fang, C. (2020). Insight into Carbon Emissions Related to Residential Consumption in Tibetan Plateau-Case Study of Qinghai. Sust. Cities Soc. 61, 102310. doi:10.1016/j.scs.2020.102310
Friedl, B., and Getzner, M. (2003). Determinants of CO2 Emissions in a Small Open Economy. Ecol. Econ. 45, 133–148. doi:10.1016/s0921-8009(03)00008-9
Galeotti, M., Lanza, A., and Pauli, F. (2006). Reassessing the Environmental Kuznets Curve for CO2 Emissions: A Robustness Exercise. Ecol. Econ. 57, 152–163. doi:10.1016/j.ecolecon.2005.03.031
Gu, S., Fu, B., Thriveni, T., Fujita, T., and Ahn, J. W. (2019). Coupled LMDI and System Dynamics Model for Estimating Urban CO2 Emission Mitigation Potential in Shanghai, China. J. Clean. Prod. 240, 118034. doi:10.1016/j.jclepro.2019.118034
Hirota, M., Tang, Y., Hu, Q., Hirata, S., Kato, T., Mo, W., et al. (2006). Carbon Dioxide Dynamics and Controls in a Deep-Water Wetland on the Qinghai-Tibetan Plateau. Ecosystems 9 (4), 673–688. doi:10.1007/s10021-006-0029-x
Huang, C., Wang, J. W., Wang, C. M., Cheng, J. H., and Dai, J. (2021). Does Tourism Industry Agglomeration Reduce Carbon Emissions. Environ. Sci. Pollut. Res. Int. 28, 30278–30293. doi:10.1007/s11356-021-12706-2
Husaini, D. H., and Lean, H. H. (2015). Does Electricity Drive the Development of Manufacturing Sector in Malaysia. Front. Energ. Res. 3, 00018. doi:10.3389/fenrg.2015.00018
IPCC (2006). Guidelines for National Greenhouse Gas Inventories. Bracknell, UK: IPCC WGI Technical Support Unit.
Jiang, R., Zhou, Y., and Li, R. (2018). Moving to a Low-Carbon Economy in China: Decoupling and Decomposition Analysis of Emission and Economy from a Sector Perspective. Sustainability 10 (4), 978. doi:10.3390/su10040978
Lantz, V., and Feng, Q. (2006). Assessing Income, Population, and Technology Impacts on CO2 Emissions in Canada: Where's the EKC. Ecol. Econ. 57, 229–238. doi:10.1016/j.ecolecon.2005.04.006
Li, D. R. (2018). People's Daily Commentary: Qinghai-Tibet Plateau Witnesses China's Ecological Civilization's World Contribution.
Li, R., and Jiang, R. (2017). Moving Low-Carbon Construction Industry in Jiangsu Province: Evidence from Decomposition and Decoupling Models. Sustainability 9 (6), 1013. doi:10.3390/su9061013
Lu, Q., Yang, H., Huang, X., Chuai, X., and Wu, C. (2015). Multi-sectoral Decomposition in Decoupling Industrial Growth from Carbon Emissions in the Developed Jiangsu Province, China. Energy 82, 414–425. doi:10.1016/j.energy.2015.01.052
Martinez -Zarzoso, I., and Bengochea-Morancho, A. (2004). Pooled Mean Group Estimation for an Environmental Kuznets Curve for CO2. Econ. Lett. 82, 121–126.
Meng, M., Fu, Y., and Wang, X. (2018). Decoupling, Decomposition and Forecasting Analysis of China's Fossil Energy Consumption from Industrial Output. J. Clean. Prod. 177, 752–759. doi:10.1016/j.jclepro.2017.12.278
Moomaw, W. R., and Unruh, G. C. (1997). Are Environmental Kuznets Curves Misleading Us? the Case of CO2 Emissions. Envir. Dev. Econ. 2, 451–463. doi:10.1017/s1355770x97000247
NBS (National bureau of statistics of China) (2018). China Statistical Yearbook 1998-2018. Beijing: China Statistics Press.
O’ Mahony, T., Zhou, P., and Sweeney, J. (2012). The Driving Forces of Change in Energy-Related CO2 Emissions in Ireland: A Multi-Sectoral Decomposition from 1990 to 2007. Energy Policy 44, 256–267. doi:10.1016/j.enpol.2012.01.049
Ortega-Ruiz, G., Mena-Nieto, A., and García-Ramos, J. E. (2020). Is India on the Right Pathway to Reduce CO2 Emissions? Decomposing an Enlarged Kaya Identity Using the LMDI Method for the Period 1990-2016. Sci. Total Environ. 737, 139638. doi:10.1016/j.scitotenv.2020.139638
Panayotou, T., Sachs, J., and Peterson, A. (1999). Developing Countries and the Control of Climate Change: A Theoretical Perspective and Policy Implications. Cambridge: CAER Ⅱ Discussion Paper. No. 44.
Qinghai provincial bureau of statistics (2018). Qinghai Statistical Yearbook 1998-2018. Beijing: China Statistics Press.
Saidi, K., and Ben Mbarek, M. (2016). Nuclear Energy, Renewable Energy, CO 2 Emissions, and Economic Growth for Nine Developed Countries: Evidence from Panel Granger Causality Tests. Prog. Nucl. Energ. 88, 364–374. doi:10.1016/j.pnucene.2016.01.018
Saqib, A., Chan, T.-H., Mikhaylov, A., and Lean, H. H. (2021). Are the Responses of Sectoral Energy Imports Asymmetric to Exchange Rate Volatilities in Pakistan? Evidence from Recent Foreign Exchange Regime. Front. Energ. Res. 9, 614463. doi:10.3389/fenrg.2021.614463
Selden, T. M., and Song, D. (1994). Environmental Quality and Development: Is There a Kuznets Curve for Air Pollution Emissions. J. Environ. Econ. Manag. 27, 147–162. doi:10.1006/jeem.1994.1031
Shafik, N. (1994). Economic Development and Environmental Quality: An Econometric Analysis. New York: Oxford economic papers, 757–773.
Shahbaz, M., and Sinha, A. (2018). Environmental Kuznets Curve for CO2 Emission: A Literature Survey. J. Econ. Stud. 46 (2), 106–168. doi:10.1108/jes-09-2017-0249
Sinha, A., Shahbaz, M., and Balsalobre, D. (2017). Exploring the Relationship between Energy Usage Segregation and Environmental Degradation in N-11 Countries. J. Clean. Prod. 168, 1217–1229. doi:10.1016/j.jclepro.2017.09.071
Su, M., Jiang, R., and Li, R. (2017). Investigating Low-Carbon Agriculture: Case Study of China's Henan Province. Sustainability 9 (12), 2295. doi:10.3390/su9122295
Sun, H., Edziah, B. K., Kporsu, A. K., Sarkodie, S. A., and Taghizadeh-Hesary, F. (2021). Energy Efficiency: The Role of Technological Innovation and Knowledge Spillover. New York: Technological Forecasting & Social Change, 120659. doi:10.1016/j.techfore.2021.120659
Sun, H., Kporsu, A. K., Taghizadeh-Hesary, F., and Edziah, B. K. (2020). Estimating Environmental Efficiency and Convergence: 1980 to 2016. Energy, 118224. doi:10.1016/j.energy.2020.118224
Sun, Y., Li, X., Liu, L., Xu, H., and Zhang, D. (2008). Climate Change and sandy Land Development in Qinghai Lake Watershed, China. Front. Environ. Sci. Eng. China 2, 340–348. doi:10.1007/s11783-008-0045-5
Tapio, P. (2005). Towards a Theory of Decoupling: Degrees of Decoupling in the EU and the Case of Road Traffic in Finland between 1970 and 2001. Transport Policy 12, 137–151. doi:10.1016/j.tranpol.2005.01.001
Vehmas, J., Malaska, P., Luukkanen, J., Kaivo-oja, J., Hietanen, O., Vinnari, M., et al. (2003). “Europe in the Global Battle of Sustainability: Rebound Strikes Back?—Advanced Sustainability Analysis,” in Publications of the Turku School of Economics and Business Administration, Series Discussion and Working Papers (Turku, 7. 2003.
Wagner, M. (2008). The Carbon Kuznets Curve: A Cloudy Picture Emitted by Bad Econometrics. Resource Energ. Econ. 30 (3), 388–408. doi:10.1016/j.reseneeco.2007.11.001
Waheed, R., Sarwar, S., and Wei, C. (2019). The Survey of Economic Growth, Energy Consumption and Carbon Emission. Energ. Rep. 5, 1103–1115. doi:10.1016/j.egyr.2019.07.006
Wang, Q., and Jiang, R. (2019). Is China's Economic Growth Decoupled from Carbon Emissions. J. Clean. Prod. 225, 1194–1208. doi:10.1016/j.jclepro.2019.03.301
Wang, Q., Su, M., and Li, R. (2018). Toward to Economic Growth without Emission Growth: the Role of Urbanization and Industrialization in China and India. J. Clean. Prod. 205, 499–511. doi:10.1016/j.jclepro.2018.09.034
Wang, S. S., Zhou, D. Q., Zhou, P., and Wang, Q. W. (2011). CO2 Emissions, Energy Consumption and Economic Growth in China: A Panel Data Analysis. Energy Policy 39 (9), 4870–4875. doi:10.1016/j.enpol.2011.06.032
Wang, Y., Zhang, C., Lu, A., Li, L., He, Y., ToJo, J., et al. (2017). A Disaggregated Analysis of the Environmental Kuznets Curve for Industrial CO2 Emissions in China. Appl. Energ. 190, 172–180. doi:10.1016/j.apenergy.2016.12.109
Wang, Z., Jiang, Q., Dong, K., Mubarik, M. S., and Dong, X. (2020). Decomposition of the US CO2 Emissions and its Mitigation Potential: An Aggregate and Sectoral Analysis. Energy Policy 147, 111925. doi:10.1016/j.enpol.2020.111925
Xie, P., Gao, S., and Sun, F. (2019). An Analysis of the Decoupling Relationship between CO2 Emission in Power Industry and GDP in China Based on LMDI Method. J. Clean. Prod. 211, 598–606. doi:10.1016/j.jclepro.2018.11.212
Yang, J., Cai, W., Ma, M., Li, L., Liu, C., Ma, X., et al. (2020). Driving Forces of China's CO2 Emissions from Energy Consumption Based on Kaya-LMDI Methods. Sci. Total Environ. 711, 134569. doi:10.1016/j.scitotenv.2019.134569
Zaman, K., Moemen, M. A.-e., and Moemen, M. (2017). Energy Consumption, Carbon Dioxide Emissions and Economic Development: Evaluating Alternative and Plausible Environmental Hypothesis for Sustainable Growth. Renew. Sust. Energ. Rev. 74, 1119–1130. doi:10.1016/j.rser.2017.02.072
Zambrano-Monserrate, M. A., Valverde-Bajana, I., Aguilar-Bohorquez, J., and Mendoza-Jimenez, M. J. (2016). Relationship between Economic Growth and Environmental Degradation: Is There Evidence of an Environmental Kuznets Curve for Brazil. Int. J. Energ. Econ. Pol. 6 (2), 208–216. doi:10.2139/ssrn.2346173
Zhang, M., and Wang, W. (2013). Decouple Indicators on the CO2 Emission-Economic Growth Linkage: The Jiangsu Province Case. Ecol. Indicators 32, 239–244. doi:10.1016/j.ecolind.2013.03.033
Zhang, Y.-J., and Da, Y.-B. (2015). The Decomposition of Energy-Related Carbon Emission and its Decoupling with Economic Growth in China. Renew. Sust. Energ. Rev. 41, 1255–1266. doi:10.1016/j.rser.2014.09.021
Zhao, M., Tan, L., Zhang, W., Ji, M., Liu, Y., and Yu, L. (2010). Decomposing the Influencing Factors of Industrial Carbon Emissions in Shanghai Using the LMDI Method. Energy 35 (6), 2505–2510. doi:10.1016/j.energy.2010.02.049
Zhao, X., Zhang, X., and Shao, S. (2016). Decoupling CO2 Emissions and Industrial Growth in China over 1993-2013: The Role of Investment. Energ. Econ. 60, 275–292. doi:10.1016/j.eneco.2016.10.008
Zhou, Y., Shan, Y., Liu, G., and Guan, D. (2018). Emissions and Low-Carbon Development in Guangdong-Hong Kong-Macao Greater Bay Area Cities and Their Surroundings. Appl. Energ. 228, 1683–1692. doi:10.1016/j.apenergy.2018.07.038
Zoundi, Z. (2017). CO2 Emissions, Renewable Energy and the Environmental Kuznets Curve, a Panel Cointegration Approach. Renew. Sust. Energ. Rev. 72, 1067–1075. doi:10.1016/j.rser.2016.10.018
Glossary
CNY chinese yuan
CO2 carbon dioxide
DESNBS department of energy statistics, national bureau of statistics of china
EKC environmental kuznets curve
GDP gross domestic product
IPCC intergovernmental panel on climate change
LMDI logarithmic mean divisia index
NBS national bureau of statistics of china
OECD organization for economic co-operation and development
R&D research and development
tce tons of standard coal equivalent
C total carbon emissions
C0 carbon emissions in base period 0
C% percentage change in carbon emissions
CCFi the conversion factor of fuel item i
Ci carbon emission of fuel item i
Ct carbon emissions in year t
e decoupling elasticity
Ei energy consumption of fuel item i
EI energy intensity
ES energy consumption structure
Fi the carbon emission factor of fuel item i
G0 gdp in the base period
GDP% percentage change in gross domestic product
Gt gdp in year t
PI gdp per capita
Pt the total population in year t
Keywords: CO2 emissions, decoupling, LMDI method, energy consumption, Qinghai
Citation: Huang C, Zhou Y-J and Cheng J-H (2021) Research on Energy-Related CO2 Emissions Characteristics, Decoupling Relationship and LMDI Factor Decomposition in Qinghai. Front. Energy Res. 9:700385. doi: 10.3389/fenrg.2021.700385
Received: 12 May 2021; Accepted: 24 November 2021;
Published: 20 December 2021.
Edited by:
Christopher Koroneos, University of Western Macedonia, GreeceReviewed by:
Kangyin Dong, University of International Business and Economics, ChinaHuaping Sun, Jiangsu University, China
Copyright © 2021 Huang, Zhou and Cheng. This is an open-access article distributed under the terms of the Creative Commons Attribution License (CC BY). The use, distribution or reproduction in other forums is permitted, provided the original author(s) and the copyright owner(s) are credited and that the original publication in this journal is cited, in accordance with accepted academic practice. No use, distribution or reproduction is permitted which does not comply with these terms.
*Correspondence: Yin-Jun Zhou, emhvdXlpbmp1bjExMTRAMTI2LmNvbQ==