 Xue Li
 Zhourong Zhang
- Shanghai Key Laboratory of Power Station Automation Technology, School of Mechatronic Engineering and Automation, Shanghai University, Shanghai, China
To reduce the risk of voltage violation after gas station networks (GSNs) are attacked, this study investigates an inter-area mobile charging strategy of plug-in hybrid electric vehicles (PHEVs) to decrease the charging load by taking full advantage of charging resources. First, considering the location of the charging station, the waiting time, and the charging fee, an inter-area mobile charging strategy of PHEVs is proposed, and a mobile charging model of PHEVs among regions is established to relieve the charging pressure. Second, the risk index is developed to analyze the risk of voltage violation in terms of the results of probabilistic load flow (PLF). Finally, the proposed strategy is tested on a modified coastal active power distribution network, and simulation results show that the charging load of PHEVs is dispersed among regions and the risk of voltage over-limit can be reduced.
1 Introduction
The scale of plug-in hybrid electric vehicles (PHEVs) has developed rapidly during the past several years. The high penetration of PHEVs causes the power grids to confront the operation risks (Badawy and Sozer (2017)). Moreover, with the increasing pervasion of communication networks into gas stations, gas station networks (GSNs) have been formed (Chao et al. (2018); Xie et al. (2018); Zhang et al. (2019); Du et al. (2019a)), which are also subject to cyberattacks. Once GSNs are attacked, the charging load will definitely increase with the lack of fuel in PHEVs. Due to the limited number of charging piles, it is an indisputable fact that charging resources will be scarce under GSNs that have been attacked. The increasing of the charging load can raise the voltage violation risks of grids (Li et al. (2020)). It is necessary to investigate the charging strategy of PHEVs to allocate the charging resources reasonably and the grid voltage violation risk to guarantee the safe operation of power grids.
Various charging strategies have been proposed to deal with the problems mentioned above that are caused by the PHEV charging load. Vehicle-to-grid (V2G) strategies are developed (Ko et al. (2018); Liu D. et al. (2018); Zhong et al. (2018); Zeng et al. (2018)). A battery replacement strategy has been proposed (Dong et al. (2016)), which cannot reduce the charging demand under GSNs that have been attacked. A centralized charging strategy of PHEVs has been presented to reduce voltage deviation via a series of fitness functions (Maigha and Mariesa Crow, (2014)). A PHEV smart charging strategy has been proposed to minimize the MG dependency on the main grid (Fouladi et al. (2019)). An orderly charging strategy has been investigated by considering various factors such as the economic benefits of users (Liu A. et al. (2018)), the working status of charging piles and charging habits of users (Chen and Huang (2019)), the fluctuation of the charging load (Cai et al. (2021)), and so on. However, the surge of the PHEV charging load will lead to a long queue in the charging stations of GSNs’ attacked areas, while the public charging piles in the unattacked area may be in an idle status, as shown in Figure 1. In this regard, the strategies mentioned above are not applicable without investigating the charging optimization among the areas. Moreover, the queuing problem in charging stations is rarely considered.
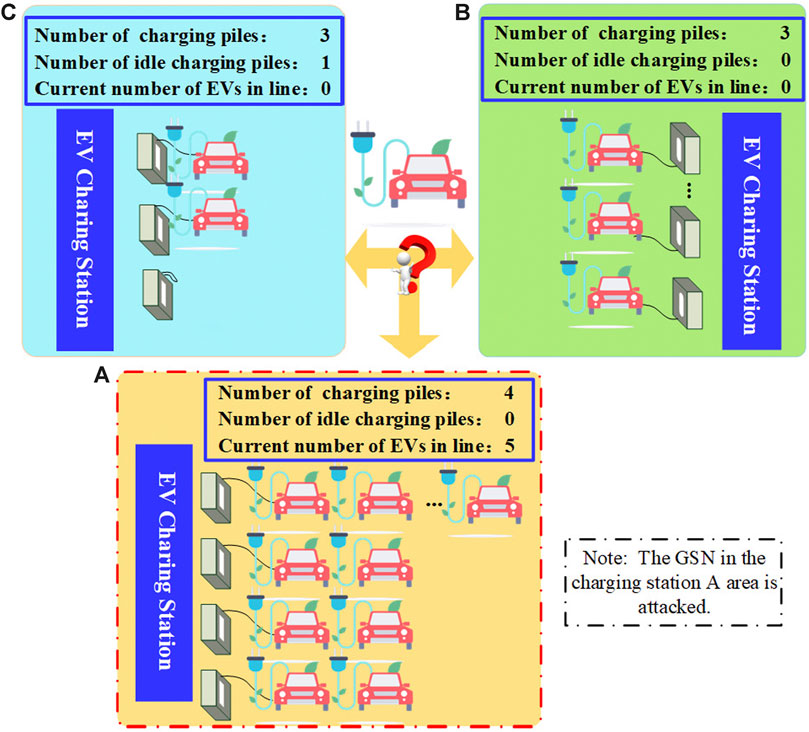
FIGURE 1. Schematic diagram of the unbalanced charging load.
It is undeniable that the increase in the PHEV charging load in the attacked area will bring another problem, in that the security of the grid operation will be damaged. Various negative effects of electric vehicles connecting to the power grid are investigated, including voltage risks, and power flow risks (Pouladi et al. (2016); Salehi and Abdolahi (2019); Nafisi et al. (2016a); Yang et al. (2020); Wang et al. (2018); Nornagoro et al. (2020)). The impact of electric vehicle access on the voltage drops and power loss of power grids has been analyzed without establishing a relevant index (Pouladi et al. (2016); Salehi and Abdolahi (2019); Nafisi et al. (2016a)). The voltage over-limit and overload risk caused by electric vehicles connecting to the power grid have been presented from the perspective of components and networks (Yang et al. (2020)). The risks caused by the charging and discharging of electric vehicles to microgrids have been evaluated, from the aspects of expected lack of power supply, expected load reduction frequency, and load reduction probability (Wang et al. (2018)). The load loss ratio and overload risks are analyzed (Li et al. (2021); Du et al. (2019b)). The studies mentioned above only focus on the impact on the voltage level of power grids under the normal operation of GSNs. Even so, the risks are seldom quantified (Pouladi et al. (2016); Salehi and Abdolahi (2019); Nafisi et al. (2016a)). Due to the coincidence of the charging peak of the electric vehicle and the daily load peak (Nafisi et al. (2016b)), the surge of the PHEV charging load in the attacked area could greatly reduce the grid voltage, especially during the peak charging period.
To address these problems under GSNs that have been attacked, this study analyzes the risk of voltage violation while using a mobile charging strategy of regional PHEVs. The main contributions of this study are as follows:
1) Considering the location of charging stations, waiting time, and charging fee, an inter-area mobile charging strategy of PHEVs is proposed to choose the optimal charging station. A PHEV mobile charging model is then established to disperse the charging stress in the attacked region.
2) Considering the probability and severity of voltage violation, an index of the voltage violation risk is developed to analyze the impact of PHEV mobile charging on distribution networks under GSNs’ attacked regions.
The rest of this article is organized as follows. Section 2 describes the PHEV mobile charging model based on the mobile charging strategy, including the PHEV charging model and the queue charging model. Section 3 presents the index of the voltage violation risk based on the results of probabilistic load flow (PLF). In section 4, simulation results are shown in detail, followed by discussion in section 5.
2 Probability Model of Plug-In Hybrid Electric Vehicle Mobile Charging
The driving mode of PHEVs can be divided into the combustion mode and the electric mode depending on different driven powers. In the traditional charging model of PHEVs, the electric energy required to charge is determined by the daily driving distance and operating status (OS). The OS is the ratio of the distance traveled in the electric mode to the daily driving mileage. Once GSNs are attacked, the PHEV will be more dependent on the electric power, as presented in Figure 2. Moreover, the length of queuing in the charging stations may be longer due to the limitation of charging piles.
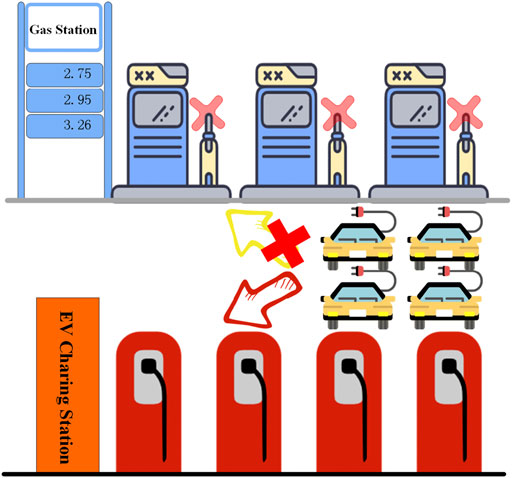
FIGURE 2. Schematic diagram of PHEV energy acquisition with GSNs being attacked.
To solve the problem mentioned above, a mobile charging strategy is designed by considering the queue length, the charging fee, and the geographical location of each charging station. Then, the PHEV mobile charging model is established based on the mobile charging strategy.
2.1 Mobile Charging Strategy of Plug-In Hybrid Electric Vehicles With Gas Station Networks Attacked
Due to the limited number of charging piles, it is undeniable that there will be a charging congestion in charging stations located in GSNs’ attacked areas, while there are some charging piles available in other charging stations. In this regard, this section proposes a mobile charging strategy for PHEVs between regions by considering charging fee, moving distance, and queuing time, as shown in Figure 3.
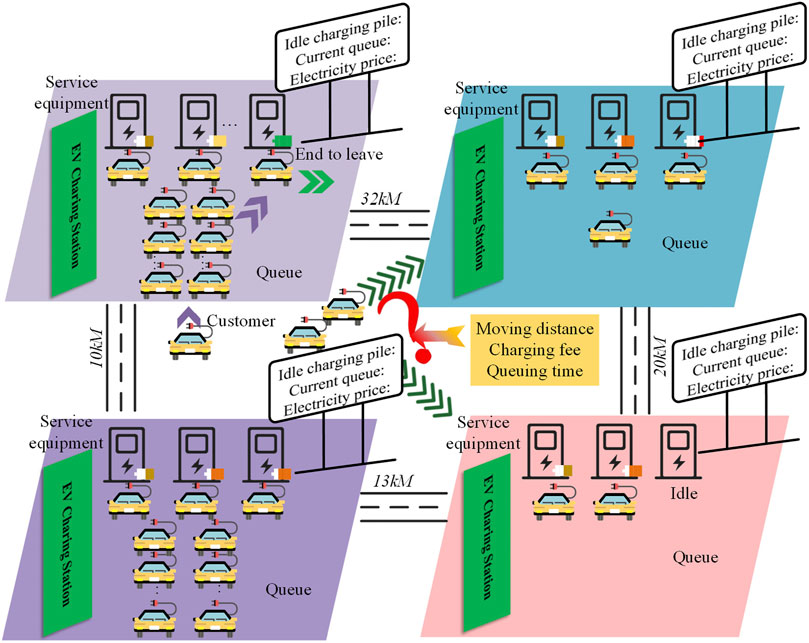
FIGURE 3. Schematic diagram of the PHEV mobile charging strategy.
First, the expected charging fees for the
where
Next, considering the distance between the charging stations and the queue length of each charging station at the time instant t, the comprehensive index of each charging station can be calculated as follows:
where
Comparing the indicators of each charging station, the optimal charging station is selected as follows:
where
The optimal charging station for the
2.2 Mobile Charging Model of Plug-In Hybrid Electric Vehicles Under GSNs Attacked
According to the mobile charging strategy proposed above, the mobile charging model of PHEVs is established. In the PHEV charging model with GSNs that have been attacked in the study by Li et al. (2020), the mismatch between the quantity of charging piles and PHEVs is ignored. There may be no idle charging piles when a PHEV arrives, especially during peak periods, as shown in Figure 4. Therefore, it is profitable for PHEV users to carry out the mobile charging.
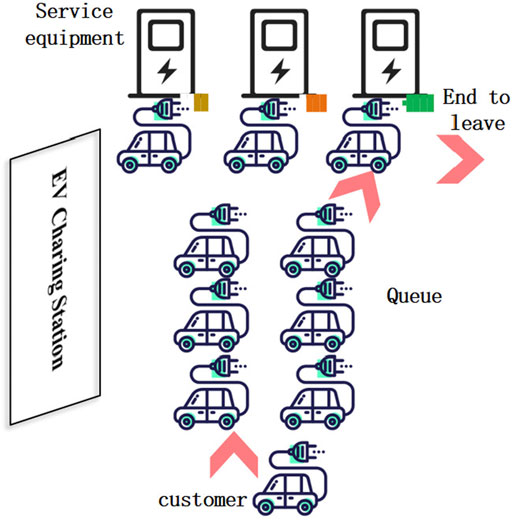
FIGURE 4. PHEV queuing diagram.
To establish a PHEV charging model under GSNs that have been attacked, the daily commuting distance of PHEVs is analyzed. Through the statistical data analysis, the probability characteristic of the daily commuting distance of the vehicle conforms to the lognormal distribution (Li and Zhang (2012); Villanueva et al. (2011)). The probability density function (PDF) of the daily commuting distance for the
where
According to the driving distance in the combustion mode, the fuel consumption of the day can be obtained as follows:
where
When GSNs are unavailable, the driving distance in the combustion mode can be calculated using the following:
where
The driving distance in the electric mode
Similarly, the driving distance in the electric mode is determined by the remaining fuel.
According to
where
The power required to fully charge the
Then the charging duration of the
where
For the convenience of modeling, it is assumed that the end of the last trip for PHEVs is the beginning of charging and that PHEVs are only charged once a day (Tian et al. (2010); Clement-Nyns et al. (2010)). As stated by statistics, the time of the start of charging conforms to the normal distribution, and its PDF can be expressed as follows:
where
According to the first come first service (FCFS) queuing principle, the charging priority is set depending on the arrival time of PHEVs. To determine whether the PHEV arriving at time instant t can be charged immediately, it is necessary to know the working status of the charging pile at time instant t. The working status of the charging pile at time instant t can be expressed as follows:
where
Then, the remaining working time of all charging piles is sorted in ascending order at each moment. When the State value at time instant t is 1, the queue duration of the
According to the mobile charging strategy, if the current charging station is the optimal charging station, the ending time of charging is
otherwise, the charging load is as follows:
If the current charging station is not the optimal charging station, the moving time is calculated as follows:
where
Then the arrival time of the target charging station is as follows:
However, considering the remaining power of the PHEV including the remaining fuel and remaining power, the maximum travelable distance is obtained as follows:
When
The
When the ending time of charging
otherwise, the charging load is as follows:
Then, the total charging load of all PHEVs in a single charging station is as follows:
where
3 Risk Index of Voltage Violation Based on Probabilistic Load Flow
Probabilistic load flow (PLF) was proposed by Borkoaka in 1974 to solve the uncertainty in the power system and reflect the influence of random changes of various factors on the operation of the system. Considering the randomness of the distributed power generation and the PHEV load probability model in the grid, the PLF algorithm based on the 2m + 1 point estimation method (PEM) is employed to solve the voltage, and the risk of voltage violation is analyzed.
3.1 Correlation Transformation
To deal with the correlation of the input variables of PLF (wind speed, light intensity, daily load, etc.), Nataf transformation and elementary transformation (ET) are applied to transform the input variables in the correlated non-normal random vector space (CNNRVS) into the independent standard normal random vector space (ISNRVS) for the PEM (Li et al. (2020)). Wind speed, light intensity, and daily load variables can be described by Weibull distribution, Beta distribution, and normal distribution, respectively (Bilir et al. (2015); Cao et al. (2018); Ran and Miao (2016)). The PHEV charging load adopts the mobile charging model established above.
3.1.1 Nataf Transformation
Nataf transformation is used to transform the variables in the CNNRVS into the correlated standard normal random vector space (CSNRVS). It should be noted that Nataf transformation is applicable for variables known by the marginal distribution function and the correlation coefficient matrix. Specific steps are as follows.
As for input vector X, it is assumed that the cumulative distribution function (CDF) of the input variable
where
3.1.2 Elementary Transformation
After the Nataf transformation, the random vector Z in the CSNRVS is obtained, which needs to be transformed into the ISNRVS by ET transformation. ET transformation requires the use of two lemmas:
Lemma 1 (Knapp (2007)) It is assumed that
Lemma 2 (Bauer (1996)) If there is an n-dimensional invertible matrix that conforms to Eq. 23, then Eq. 24 is also satisfied, as follows:
where
The vector Z obeys the normal distribution, and the components have correlation.According to the definition of the covariance matrix, it can be known that
According to Lemma 2, the random vector Y can be obtained. Comparing Eq. 24 with Eq. 26, it can be seen that
3.2 Probabilistic Load Flow Based on 2m + 1 PEM
The Monte Carlo and PE methods are commonly used to solve PLF. Although the Monte Carlo method is highly accurate, it is computationally intensive. Compared with the Monte Carlo method, the PEM can not only reduce computational burden but also achieve high accuracy by using the generated input variable samples, which becomes a good alternative to the Monte Carlo method. There are several different PEM approaches; the 2m + 1 PEM is widely used in PLF because it involves less calculation and higher accuracy than other PE methods (Che et al. (2020); Xia et al. (2016)). The 2m + 1 PEM is also called the 3m method. For m input variables, 3m estimated points are constructed while m points correspond to the same estimated point vector, so the 3m PEM is transformed to the 2m + 1 PEM. The specific method is as follows.
The estimated value
where
where
When other input variables take the mean value, the variable
According to the analysis above, the input vector
where E represents the mean operator, and
The specific procedures of PLF are designated in Algorithm 1:
Algorithm 1:Procedures of PLF
Input:
Output:
1:
2:
3:Y
4:for i = 1:m
5:
6:
7: Calculate
8:
9:
10: for k = 1:3
11:
12: end
13:
14:end
15:
16:
17:for i = 1:2m + 1
18: v = Flow
19:
20:end
Input and Output:
3.3 Risk Index of Voltage Violation
The voltage violation risk of the
where
The probability of voltage violation can be obtained from the voltage distribution of PLF results. In general, the voltage distribution obeys normal distribution. The probability of voltage violation can be expressed as follows:
where
The severity of the voltage violation is presented as follows:
where
The corresponding load loss can be derived using the severity of the voltage violation. The relationship between severity and load loss is linear within a certain range, as shown in Figure 5. The critical value of the upper severity is 14.29% (
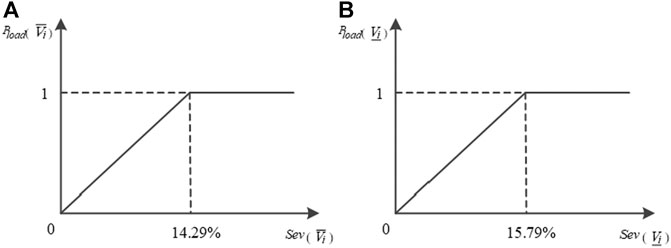
FIGURE 5. Load loss when voltages exceed the security limits. (A) Voltage exceeds the upper limit. (B) Voltage exceeds the lower limit.
The charging load increases after GSNs are attacked, and it is an indisputable fact that the voltage level decreases and the risk of voltage violation increases. PHEVs in the attacked area are motivated to perform mobile charging using the proposed mobile charging strategy. The charging stress in the attacked area is then abated, which reduces the risk of voltage violation.
4 Simulations
The modified coastal active power distribution network is used as a case study to analyze the impact of the proposed mobile charging strategy on the voltage (Strugar et al. (2013)), as shown in Figure 6. Three wind farms and two photovoltaic systems are installed at nodes 3, 4, 6, 11, and 17, respectively. Four charging stations (A, B, C, and D) are considered in nodes 9, 13, 15, and 20. It is assumed that there are 14,000 residents in the area and the quantities of vehicles per capita is 291 vehicles per 1,000 people (RS.Statistical Office (2016)). Moreover, the penetration rate of PHEVs is set as 35%; it indicates that the network has about 1,426 PHEVs (Li et al. (2020)). It is being supposed that gas stations in the area located in nodes 9 and 15 cannot provide gas service due to GSNs being attacked, and only the charging stations work normally. In other words, GSNs in the area containing the charging stations A and C are attacked, while GSNs in the areas containing the charging stations B and D work normally. In this part, the effectiveness of the proposed strategy is verified by comparing these three situations: GSNs are attacked and PHEVs move to charge (A–M), GSNs are attacked and PHEVs do not move to charge (A–N), and GSNs work normally and PHEVs do not move to charge (N–N).
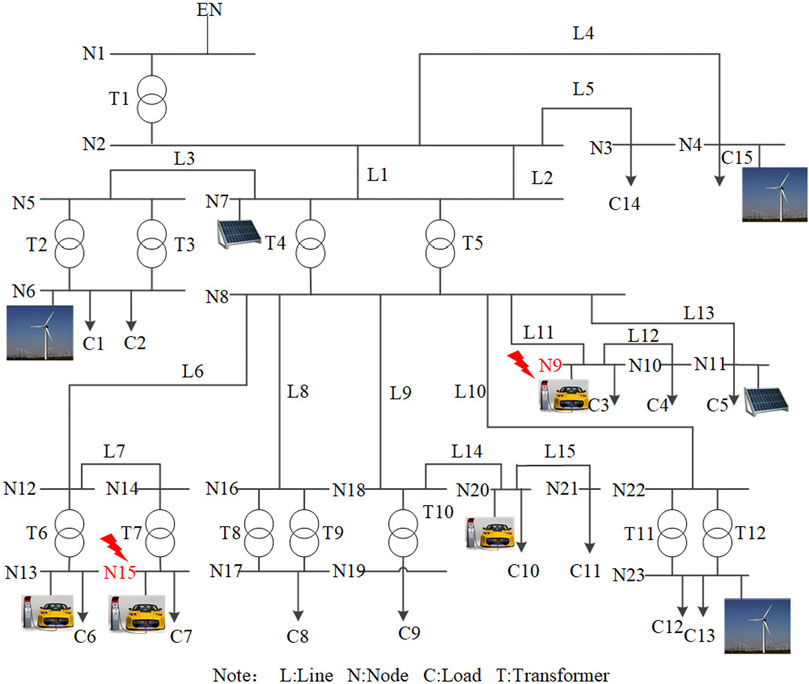
FIGURE 6. Modified real coastal active distribution network.
4.1 The Impact of Mobile Charging Strategy on Charging Load
In general, there is not a lot of surplus of charging piles, especially when GSNs are unavailable. This phenomenon adds congestion to the charging station, as shown in Figures 7, 8. It is obvious that the charging loads at charging stations A and C increase due to the unavailability of GSNs. Moreover, the charging stations A and C are fully loaded for a long time during peak charging periods. In other words, PHEVs arriving at the peak charging period will have to queue for a long time.
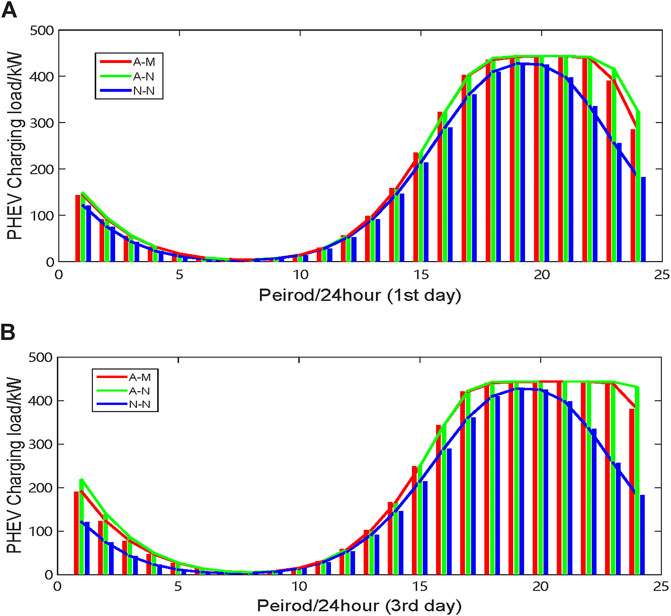
FIGURE 7. Load variation of charging station A. (A) Charging load in the first 24 h (
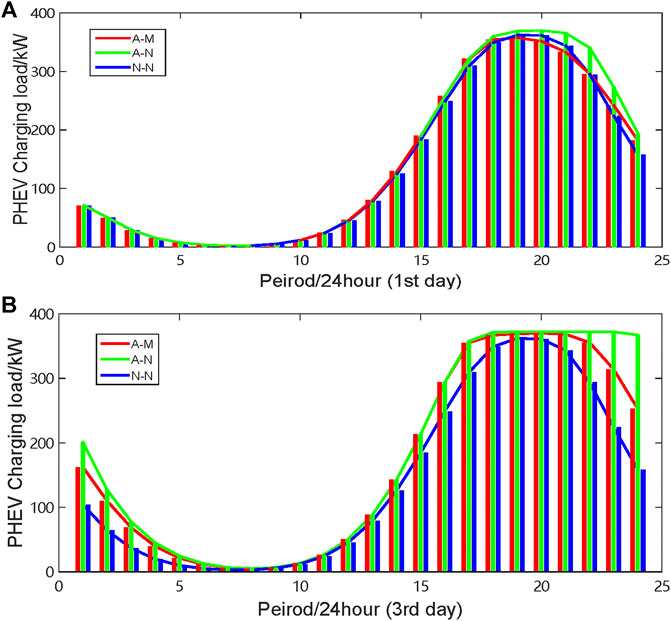
FIGURE 8. Load variation of charging station C. (A) Charging load in the first 24 h (
Moreover, the fully loaded duration of the charging station is prolonged by an increase during the attacked time, as depicted in Figures 7B, 8B. As can be observed, the charging load in case of A-N almost remains the highest during 17:00–24:00, which means that the more severe charging congestion occurs in the charging station. The charging jams and greater dependence of PHEVs on electric energy proves that mobile charging is essential.
According to this mobile charging strategy, a portion of PHEV users who originally charged at charging stations A and C are encouraged to move to stations B and D for charging. Hence, the comprehensive economic and time benefits of users are protected. Consequently, the charging stress of charging stations A and C is dispersed, and the fully loaded duration of charging stations A and C decreases, as shown by the red curves in Figures 7, 8. It is noteworthy that all charging piles are involved, to work in stations A and C during 17:00–21:00 in case of 72 h of attack. In this case, it does not illustrate that mobile charging has not occurred. As long as there are PHEVs in the queue, the charging stations are still fully loaded. Overall, the congestion in stations A and C is suitably improved.
Figures 9, 10 present the load variations of stations B and D. It is clear that the charging loads of charging stations B and D increase during the peak charging periods via mobile charging of PHEVs. Additionally, the longer the GSNs are attacked, the greater the number of PHEVs going to charging stations B and D. As a result, the charging congestion occurs in stations B and D. The worst case is presented in Figure 8B. In fact, although there is a queue at station D, it is still the optimal choice for some PHEV users. According to Figures 7–10, it is obvious that the mobile charging strategy is effective for relieving the charging stress in attacked areas.
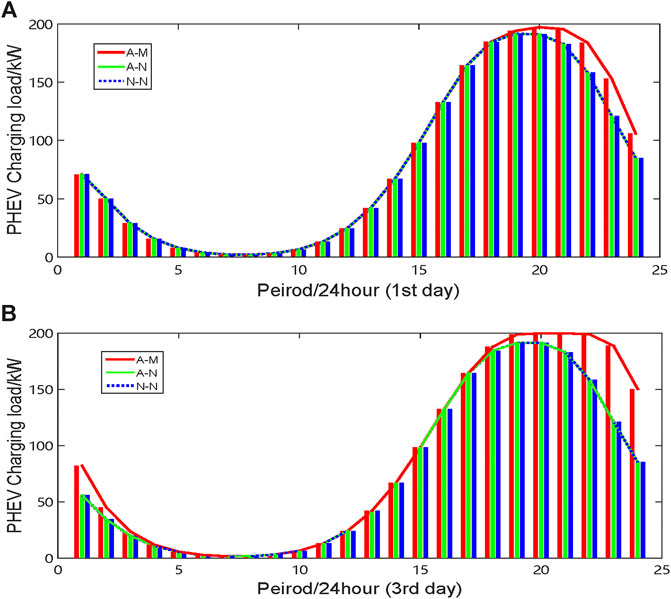
FIGURE 9. Load variation of charging station B. (A) Charging load in the first 24 h (
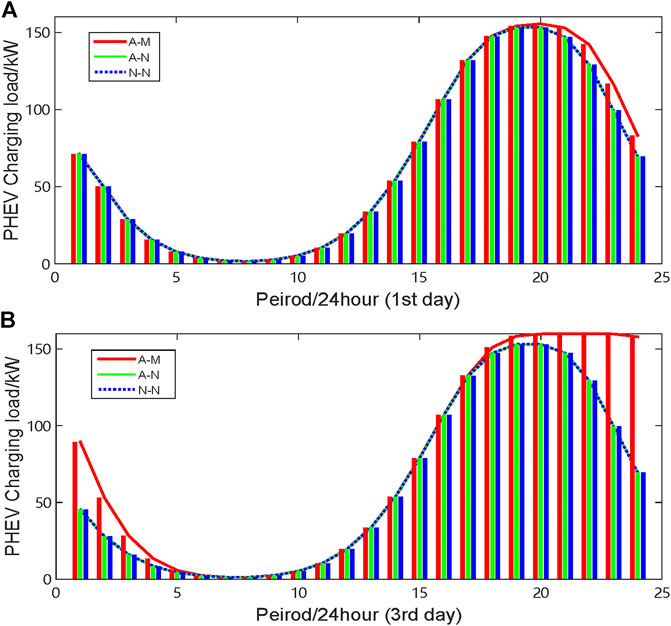
FIGURE 10. Load variation of charging station D. (A) Charging load in the first 24 h (
Each PHEV has its own waiting time and charging fee, so there are 1,426 cases in this simulation. Here, 10 distinct results of the waiting time and charging fee before and after mobile charging are presented in Tables 1, 2. It can be seen from Table 1 that after PHEVs move to the optimal charging station, the waiting time of four PHEVs is zero, while the waiting time of six PHEVs decreases significantly. Meanwhile, it is found from Table 2 that the charging fee of one PHEV decreases significantly, while the charging fee of nine PHEVs increases slightly after mobile charging. It is seen from Table 3 that although the charging fee increases, the waiting time is shortened, and the comprehensive index is better. Therefore, PHEVs choose mobile charging instead of waiting in place. When the current charging station is optimal, PHEVs will wait in place for charging, so the charging cost and waiting time will not change.

TABLE 1. Comparison of the waiting time before and after mobile charging.

TABLE 2. Comparison of the charging fee before and after mobile charging.

TABLE 3. Comparison of the comprehensive index before and after mobile charging.
4.2 The Impact of Mobile Charging Strategy on the Voltage Violation Risk
For further analysis, the risk of voltage violation is presented to illustrate the effect of the mobile charging strategy. Considering the similarity of the load variation shown above, only node 13 (connected by the charging station) and node 15 (connected by charging station C) are taken as the examples to analyze.
Figure 11 depicts the voltage comparison of node 15. A voltage drop can be observed when GSNs are unavailable. In addition, as the attack time is prolonged, the voltage drops more. However, due to the limitation of the charging piles, the voltage does not drop excessively. It is obvious that the duration that the voltage is at a lower level is longer due to the extension of the fully loaded periods. For the mobile charging strategy, the voltage of node 15 at peak periods rises up in the first 24 h of attack (first day). Consequently, the risk of voltage violation decreases significantly as shown in Figure 12A. In the case of the first 72 h of attack, no matter whether PHEVs move or not, station C is always fully loaded during 17:00–21:00, resulting in a little change in the voltage and the risk of voltage violation. After 21:00, the voltage increases and the risk of voltage violation decreases because of a decrease in the charging load of station C, as shown in Figures 11B, 12B. In conclusion, the charging load of PHEVs is dispersed using the mobile charging strategy, and the voltage level increases and the risk of voltage violation is reduced.
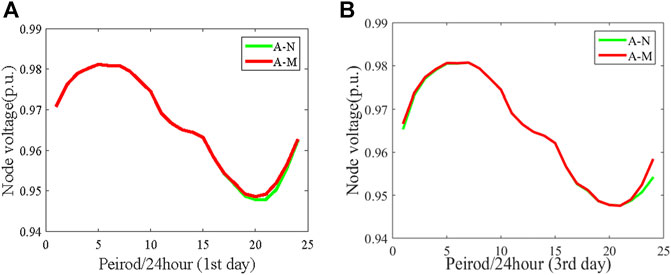
FIGURE 11. Voltage comparison of node 15 for different attack durations. (A) First 24 h (
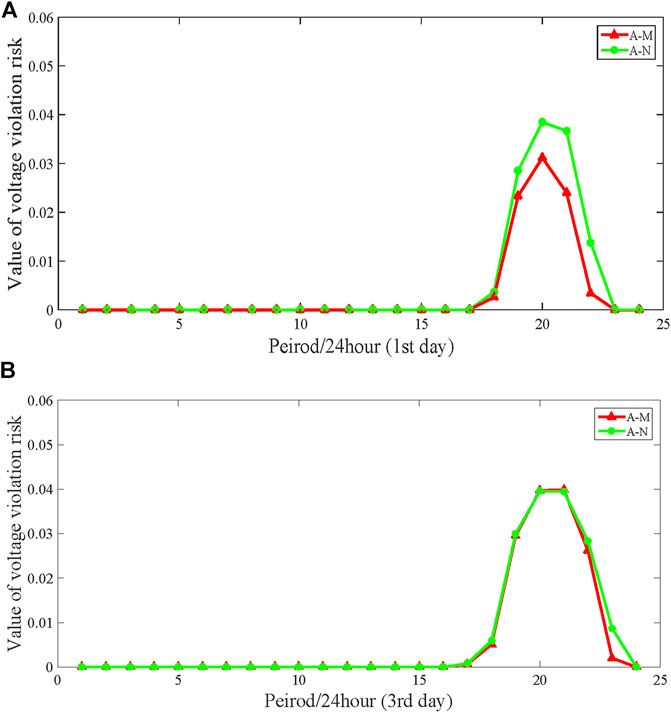
FIGURE 12. Comparison of the voltage violation risk of node 15 for different attack durations. (A) First 24 h (
Figure 13 shows the voltage and the violation risk of node 13. After mobile charging of PHEVs, it is obvious that the voltage during the peak charging period decreases because of the increase in the charging demand. However, the risk of voltage violation is always at 0, as shown in Figure 13B, denoting that the risk is not affected by mobile charging of PHEVs. In fact, although the voltage of node 13 drops on using the mobile charging strategy, it does not cause the voltage limit to be exceeded, that is, the increasing load is within its acceptable range.
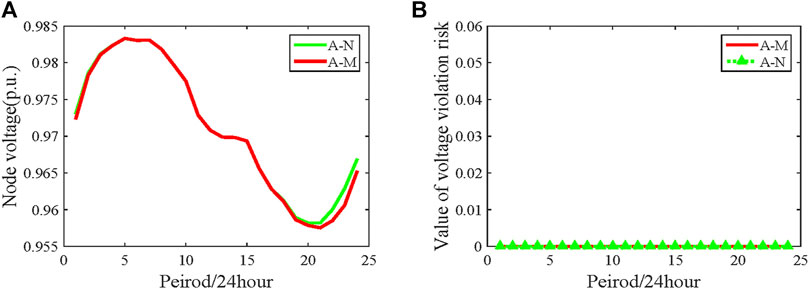
FIGURE 13. Voltage analysis of node 13. (A) Voltage comparison of node 13 in the first 24 h (
5 Conclusion
For a surge of the PHEV charging load under the regional GSNs being attacked, this study investigates the risk of voltage violation after the mobile charging of PHEVs. In view of the phenomenon of charging congestion under GSNs that have been attacked, the mobile charging strategy is proposed to encourage users to charge movably. The charging fee, queueing time, and location of the charging station are emphasized, and the mobile charging model is developed to relieve the charging stress of charging stations in the attacked areas. Then the PLF based on the 2m + 1 PEM is used to obtain the voltage distribution, and a risk index of voltage violation is set up to analyze the impact of PHEV mobile charging.
The validation of the proposed mobile charging strategy is performed on the modified coastal active power distribution network. The results demonstrate that the charging load in the attacked area of GSNs is significantly reduced, which further indicates that PHEVs are encouraged to move using the mobile charging strategy, and the full-loaded time is sharply decreased. After mobile charging, the charging stress of charging stations located in the attacked area is dispersed and the voltage level rises. Therefore, it indicates that the risk of voltage violation can be reduced using the proposed mobile charging strategy. It is worth mentioning that the security constraint of charging stations located in unattacked areas is neglected. However, the excessive movement of PHEVs may lead to an increase in the risk of voltage violation in normal areas, although the risk in normal areas has always been zero in this work. Therefore, more security constraints can be investigated in future work.
Data Availability Statement
The original contributions presented in the study are included in the article/Supplementary Material; further inquiries can be directed to the corresponding authors.
Author Contributions
All authors listed have made a substantial, direct, and intellectual contribution to the work and approved it for publication.
Funding
This research was funded by the National Science Foundation of China (Grant nos. 61773253, 61803252, and 61633016), the Project of Science and Technology Commission of Shanghai Municipality, China (20JC1414000, 19500712300, and 19510750300) and Shanghai Talent development Foundation.
Conflict of Interest
The authors declare that the research was conducted in the absence of any commercial or financial relationships that could be construed as a potential conflict of interest.
Publisher’s Note
All claims expressed in this article are solely those of the authors and do not necessarily represent those of their affiliated organizations, or those of the publisher, the editors and the reviewers. Any product that may be evaluated in this article, or claim that may be made by its manufacturer, is not guaranteed or endorsed by the publisher.
Acknowledgments
This work was supported by the Shanghai Key Laboratory of Power Station Automation Technology, Shanghai University. The authors would like to thank reviewers for their careful work. Their most helpful and constructive comments improve the quality of the article.
References
Badawy, M. O., and Sozer, Y. (2017). Power Flow Management of a Grid Tied Pv-Battery System for Electric Vehicles Charging. IEEE Trans. Ind. Applicat. 53, 1347–1357. doi:10.1109/TIA.2016.2633526
Bilir, L., İmir, M., Devrim, Y., and Albostan, A. (2015). Seasonal and Yearly Wind Speed Distribution and Wind Power Density Analysis Based on Weibull Distribution Function. Int. J. Hydrogen Energ. 40, 15301–15310. doi:10.1016/j.ijhydene.2015.04.140
Cai, Z., Shu, H., Yang, B., and Shan, J. (2021). Research on Regional Dispatching Plan and Coordinated Charging Strategy of Electric Bus. Power Syst. Technology 1070-1072, 1632–1636. doi:10.13335/j.1000-3673.pst.2020.1922
Cao, Y., Zhang, Y., Zhang, H., Shi, X., and Terzija, V. (2018). Probabilistic Optimal Pv Capacity Planning for Wind Farm Expansion Based on Nasa Data. IEEE Power Energ. Soc. Gen. Meet. (Pesgm). 8(3): 1. doi:10.1109/PESGM.2018.8585748
Che, Y., Wang, X., Lv, X., and Hu, Y. (2020). Probabilistic Load Flow Using Improved Three point Estimate Method. Int. J. Electr. Power Energ. Syst. 117, 105618. doi:10.1016/j.ijepes.2019.105618
Chen, L., and Huang, X. (2019). Ordered Charging Strategy of Electric Vehicles at Charging Station on Highway. Electric Power Automation Equipment 39, 112–117+126. doi:10.16081/j.issn.1006-6047.2019.01.017
Clement-Nyns, K., Haesen, E., and Driesen, J. (2010). The Impact of Charging Plug-In Hybrid Electric Vehicles on a Residential Distribution Grid. IEEE Trans. Power Syst. 25, 371–380. doi:10.1109/TPWRS.2009.2036481
Dong, Q., Niyato, D., Wang, P., and Han, Z. (2016). The Phev Charging Scheduling and Power Supply Optimization for Charging Stations. IEEE Trans. Veh. Technol. 65, 566–580. doi:10.1109/TVT.2015.2399411
Du, D., Chen, R., Li, X., Wu, L., Zhou, P., and Fei, M. (2019a). Malicious Data Deception Attacks against Power Systems: A New Case and its Detection Method. Trans. Inst. Meas. Control. 41, 1590–1599. doi:10.1177/0142331217740622
Du, D., Li, X., Li, W., Chen, R., Fei, M., and Wu, L. (2019b). Admm-based Distributed State Estimation of Smart Grid under Data Deception and Denial of Service Attacks. IEEE Trans. Syst. Man. Cybern, Syst. 49, 1698–1711. doi:10.1109/TSMC.2019.2896292
Fouladi, E., Baghaee, H. R., Bagheri, M., and Gharehpetian, G. B. (2019). A Charging Strategy for Phevs Based on Maximum Employment of Renewable Energy Resources in Microgrid. In 2019 IEEE International Conference on Environment and Electrical Engineering and 2019 IEEE Industrial and Commercial Power Systems Europe (EEEIC/I CPS Europe). Genova, Italy. 11-14 June 2019, IEEE. 1–5. doi:10.1109/EEEIC.2019.8783742
Chao, H., Li, J., and Peng, D. (2018). Model Predictive Control of Batch Processes Based on Two-Dimensional Integration Frame. Nonlinear Anal. Hybrid Syst. 28, 75–86. doi:10.1016/j.nahs.2017.11.002
Ko, H., Pack, S., and Leung, V. C. M. (2018). Mobility-aware Vehicle-To-Grid Control Algorithm in Microgrids. IEEE Trans. Intell. Transport. Syst. 19, 2165–2174. doi:10.1109/TITS.2018.2816935
Li, G., and Zhang, X.-P. (2012). Modeling of Plug-In Hybrid Electric Vehicle Charging Demand in Probabilistic Power Flow Calculations. IEEE Trans. Smart Grid 3, 492–499. doi:10.1109/TSG.2011.2172643
Li, X., Dong, J., Du, D., Wu, L., and Fei, M. (2020). Impact of Phev in Active Distribution Network under Gas Station Network Attack. ISA Trans. 104, 192–203. doi:10.1016/j.isatra.2019.02.024
Li, X., Jiang, C., Du, D., Wang, R., Fei, M., Li, X., et al. (2021). Optimization and Control of Cyber-Physical Power Systems under Dual-Network Interactive Cascading Failure. Control. Eng. Pract. 111, 104789. doi:10.1016/j.conengprac.2021.104789
Liu, A., Yuan, X., and Li, J. (2018a). Research on Orderly Charging Strategy of Electric Vehicle under Urban Distribution Network. Electr. Meas. Instrumentation 55, 55–55+74.
Liu, D., Zhong, Q., Zhong, Q., Wang, Y., and Liu, G. (2018b). Modeling and Control of a V2g Charging Station Based on Synchronverter Technology. Csee Jpes 4, 326–338. doi:10.17775/CSEEJPES.2016.01430
Maigha , , and Crow, M. (2014). Economic Scheduling of Residential Plug-In (Hybrid) Electric Vehicle (PHEV) Charging. Energies 7, 1876–1898. doi:10.3390/en7041876
Nafisi, H., Askarian Abyaneh, H., and Abedi, M. (2016a). Energy Loss Minimization Using Phevs as Distributed Active and Reactive Power Resources: a Convex Quadratic Local Optimal Solution. Int. Trans. Electr. Energ. Syst. 26 (6), 1287–1302. doi:10.1002/etep.2134
Nafisi, H., Agah, S. M. M., Askarian Abyaneh, H., and Abedi, M. (2016b). Two-stage Optimization Method for Energy Loss Minimization in Microgrid Based on Smart Power Management Scheme of Phevs. IEEE Trans. Smart Grid 7, 1268–1276. doi:10.1109/TSG.2015.2480999
Nornagoro, A., Banjar-Nahor, K. M., Rahman, F. S., Rahmani, R., and Hariyanto, N. (2020). Impact of Combined Electric Vehicle and Pv Parking Lot to Reliability of Distribution Network Systems and its Mitigations. In 2020 International Conference on Technology and Policy in Energy and Electric Power (ICT-PEP), Bandung, Indonesia, 23-24 Sept. 2020, IEEE, 283–288. doi:10.1109/ICT-PEP50916.2020.9249941
Pouladi, J., Bannae Sharifian, M. B., and Soleymani, S. (2016). Determining Charging Load of Phevs Considering Hvac System and Analyzing its Probabilistic Impacts on Residential Distribution Network. Electric Power Syst. Res. 141, 300–312. doi:10.1016/j.epsr.2016.08.008
Ran, X., and Miao, S. (2016). Three‐phase Probabilistic Load Flow for Power System with Correlated Wind, Photovoltaic and Load. IET Generation, Transm. Distribution 10, 3093–3101. doi:10.1049/iet-gtd.2016.0424
Salehi, J., and Abdolahi, A. (2019). Optimal Scheduling of Active Distribution Networks with Penetration of Phev Considering Congestion and Air Pollution Using Dr Program. Sustainable Cities Soc. 51, 101709. doi:10.1016/j.scs.2019.101709
Strugar, L., Katic, V. A., and Milanovic, J. V. (2013). Generic Model of Coastal Distribution Network for Power System Harmonics Studies. Przeglad Elektrotechniczny 89, 149–155.
Tian, L., Shi, S., and Jia, Z. (2010). A Statistical Model for Charging Power Demand of Electric Vehicles. Power Syst. Technology 34, 126–130. doi:10.13335/j.1000-3673.pst.2010.11.020
Villanueva, D., Pazos, J. L., and Feijoo, A. (2011). Probabilistic Load Flow Including Wind Power Generation. IEEE Trans. Power Syst. 26, 1659–1667. doi:10.1109/TPWRS.2010.2096436
Wang, L., Liu, C., Wang, B., and Cai, L. (2018). Risk Based Assessment Method for Transmission System Considering the Influence of Micro-grid Charging Station. Power Syst. Prot. Control. 46, 114–121.
Xia, S., Luo, X., Chan, K. W., Zhou, M., and Li, G. (2016). Probabilistic Transient Stability Constrained Optimal Power Flow for Power Systems with Multiple Correlated Uncertain Wind Generations. IEEE Trans. Sustain. Energ. 7, 1133–1144. doi:10.1109/TSTE.2016.2520481
Xie, X., Yue, D., and Peng, C. (2018). Relaxed Real-Time Scheduling Stabilization of Discrete-Time Takagi-Sugeno Fuzzy Systems via an Alterable-Weights-Based Ranking Switching Mechanism. IEEE Trans. Fuzzy Syst. 26, 3808–3819. doi:10.1109/TFUZZ.2018.2849701
Yang, X., Yi, Y., Zhang, Y., Mo, Y., Huang, T., and Xie, X. (2020). Operation Risk Analysis of Electric Vehicle Integrated to Distribution Network Based on Weighted Distribution Entropy. Automation Electric Power Syst. 044, 171–179.
Zeng, M., Leng, S., Zhang, Y., and He, J. (2018). Qoe-aware Power Management in Vehicle-To-Grid Networks: A Matching-Theoretic Approach. IEEE Trans. Smart Grid 9, 2468–2477. doi:10.1109/TSG.2016.2613546
Zhang, D., Liu, L., and Feng, G. (2019). Consensus of Heterogeneous Linear Multiagent Systems Subject to Aperiodic Sampled-Data and Dos Attack. IEEE Trans. Cybern. 49, 1501–1511. doi:10.1109/TCYB.2018.2806387
Keywords: gas station network (GSN), attack, plug-hybrid electric vehicle (PHEV), mobile charging strategy, risk of voltage violation
Citation: Li X, Zhang Z and Du D (2021) Risk Analysis of Voltage Violation With PHEV Inter-Area Mobile Charging Strategy Under Gas Station Networks Attacked. Front. Energy Res. 9:699879. doi: 10.3389/fenrg.2021.699879
Received: 24 April 2021; Accepted: 24 June 2021;
Published: 03 August 2021.
Edited by:
Zhile Yang, Shenzhen Institutes of Advanced Technology (CAS), ChinaReviewed by:
Yuanjun Guo, Shenzhen Institutes of Advanced Technology (CAS), ChinaYanhui Zhnag, Shenzhen Institutes of Advanced Technology (CAS), China
Tingli Chemg, Hefei University of Technology, China
Copyright © 2021 Li, Zhang and Du. This is an open-access article distributed under the terms of the Creative Commons Attribution License (CC BY). The use, distribution or reproduction in other forums is permitted, provided the original author(s) and the copyright owner(s) are credited and that the original publication in this journal is cited, in accordance with accepted academic practice. No use, distribution or reproduction is permitted which does not comply with these terms.
*Correspondence: Zhourong Zhang, cm9uZzQxMTg4QDE2My5jb20=; Dajun Du, ZGRqQGkuc2h1LmVkdS5jbg==