 Lin Teng
 Jinbao Bai1
95% of researchers rate our articles as excellent or good
Learn more about the work of our research integrity team to safeguard the quality of each article we publish.
Find out more
ORIGINAL RESEARCH article
Front. Energy Res. , 08 October 2021
Sec. Carbon Capture, Utilization and Storage
Volume 9 - 2021 | https://doi.org/10.3389/fenrg.2021.697031
This article is part of the Research Topic Cleaner Treatment Technologies and Productions in The Energy Industry View all 24 articles
Supercritical CO2 pipelines usually are used to link the CO2 capture system to the geological storage. There are severe hazards once the asphyxiating gas leaks from the long-distance pipeline. The uncertainty of near-field jet characteristics results in imprecise consequences assessment of accidental release of supercritical CO2. To improve the prediction of consequences of accidental release accuracy, the near-field mechanisms of flashing-spray jet was investigated. In this work, an experimental setup with multiple measurement instruments was developed to impose controllable CO2 release from a high-pressure vessel. The flashing-spray jet structures of supercritical CO2 from circular and rectangular orifices were recorded by a high-speed camera. Results indicate that the near-field structures of supercritical CO2 jet from circular and rectangular orifices are totally different, which causes the different dispersion consequences. The jet angle and shock waves were analyzed quantitatively. Lastly, the models of flashing-spray based on the two different phenomena from rectangular and circular orifices were discussed. The combination of macroscopic and microscopic data in the jet can help to understand the complex physics and improve discharge and dispersion model. This work provides a fundamental data to consequences assessment of accidental release of supercritical CO2.
Carbon dioxide (CO2) as a major greenhouse gas (GHG) has increased significantly impacts on the earth owing to human activities such as burning of oil and gas and the discharge of exhaust gases. The Intergovernmental Panel on Climate Change (IPCC) reported that Carbon Dioxide Capture and Storage (CCS) can eliminate 20–40% of global carbon emissions (Metz et al., 2005). Carbon dioxide usually would be captured at a large point emission source (e.g., power plants) and be transported via long pipelines to another spot for use [e.g., oil field for enhanced oil recovery (EOR)] (Ziabakhsh-Ganji and Kooi, 2014). Currently more than 50 million tons of CO2 is transported by over 6,400 km of pipelines in the United States (Metz et al., 2005). And the most pipelines are under supercritical/dense state which is considered as the most efficient way. Under stricter environmental policies, up to 200,000–360,000 km by 2050 could be built and operated in the United States, China, and Europe (John and John, 2004). This would require more attention to CO2 transportation safety.
Potential leakage can happen with the development of pipeline corrosion and other outside forces, such as construction defects, solid movement, etc. The discharge and dispersion of high-pressure CO2 pipeline different from the hydrocarbons pipeline involve complex physics including cool temperature, phase transition, sonic multiphase flow, and heavy gas dispersion. As an asphyxiant at high concentrations and heavier than air, the leaked CO2 would accumulate in low-lying land and harm safety of living creature nearby (Wang et al., 2020). For safety issues related to CO2 transportation, it is necessary to determine how CO2 is released in the case of failure. More importantly, there exists little quantitative information on the source terms including near-field characteristics, which are useful for establishing appropriate models in release and dispersion.
In recent years, many researchers have made a lot of achievements in the numerical simulation of CO2 release and diffusion. (Webber, 2011) developed the two-phase flow model for flashing jet of CO2. It revealed that two-phase homogeneous equilibrium flow models may be generalized to cover such a release. (Liu et al., 2016) simulated the CO2 dispersion over two hypothetical topographies. This study provides a viable method for assessment of risks associated with CCS. (Wareing et al., 2013a) present a composite equation of state accounting for the three-phase CO2 in the modeling of liquid CO2 release. The paper predicted the near-field structure of the jet and the fraction of solid CO2. (Liu et al., 2014) simulated the highly under-expanded single-phase CO2 jets using CFD software Fluent implanted with Peng−Robinson (PR) equation of state (EoS) for accounting for real gas behavior. The two-stages simulation approach was used and resulted in heavy computational workloads. A consequence model with a pseudo source is employed to predict the dispersion of supercritical CO2 from a high-pressure pipeline (Joshi et al., 2016). They assumed that the pseudo source plane is in the plane that is approximately 3.5 times the diameter of the orifice away from the exit plane. And in this plane, it is homogenous flow. (Woolley et al., 2014) designed an effective multiphase jet expansion model to predict the leakage of CO2 after accidental damage to the high-pressure casing. The evolution of dry ice has been considered in some research. The behavior of CO2 particles during the release of high-pressure liquids has been studied using a CFD, combined with a Reynolds stress turbulence model, Lagrangian particle tracker, particle distribution function, and turbulent shear agglomeration model for the particle evolution (Wareing et al., 2013b). The heavy gas dispersion models were developed based on the study of discharge models. In order to predict the dispersion consequences more accurately, the complex physics in near-field such as the structure and shock waves should be figured out. Unfortunately, due to a lack of experimental data in supercritical CO2 releases focusing on near-field characteristics, currently the development of more complex models is limited.
Some experiments related to the supercritical CO2 release almost focused on the macroscopic parameters, such as pressure, temperature, concentration, and velocity. However, few studies focused on microscopic parameters, such as the structure of shock waves, the evolution of solid CO2, and the expanded angle. (Ahmad et al., 2013) carried out a controlled CO2 release experiment from various circular orifices to obtain the thermo-hydraulic data of CO2. A superheated jet was founded during the releases. In our previous work (Wang et al., 2019), effects of impurity concentration, initial inner pressure, and temperature on dispersion behavior were studied. (Guo et al., 2016) designed and built a large-scale supercritical experimental pipeline with a total length of 258 m and an inner diameter of 233 mm. The under-expanded jet flow structure and phase transitions in the near-field were studied for supercritical CO2 released though different orifice diameters. Relating to the small-scale experiments focused on the near-field jet of CO2. (Wareing et al., 2014) measured dry ice particles distribution along the jets in liquid CO2 release and found that the sizes of particles are around 0.1–100 μm. And the study presented Mach disc in these releases is at a distance of around seven nozzle diameters along the centerline from the nozzle and the particles are likely to be close to equilibrium after Mach disc. The effect of superheat on flashing atomization characteristics and on the snow formation of liquid CO2 has been investigated (Lin et al., 2013). Results show that the spray pattern transfers from jet spray to cone spray, and then to a bowl spray configuration with the increase of superheat. As mentioned above, a lack of near-field experiments data limits the development of models of discharge and dispersion of CO2. In addition, CO2 was released from a circular orifice or nozzle in almost current release experiments of CO2 pipeline. However, the cracks in the damaged pipeline usually are not circular. The difference in orifice pattern may results in different consequence in an accident release.
In this paper, an experimental setup with a high-speed camera system was designed and constructed to study the near-field characteristics of flashing-spray jet of supercritical CO2 from various orifice geometries. The work focused on (1) the near-field structures during CO2 released from different orifice geometries; (2) the evolution of jet angle which can affect the dispersion region; (3) the shock waves system in the release from orifices with different geometries; (4) finally models of the flashing-spray jet of supercritical CO2.
The jet from a high-pressure CO2 vessel is different from general gas jet due to the phase transition and multiphase flow and must be considered. In view of general gas jet, the jet zone is divided into three sub-zones: flow establishment zone, tansition zone, and established flow zone, as shown in Figure 1. The fluid jet from the orifice to the ambient, which causes discontinuous velocity, further causes turbulence. As shown in Figure 1, extending the upper and lower boundaries of the jet to intersect at one point (Point O), and O is the virtual origin of the jet. And then θ is the jet angle.
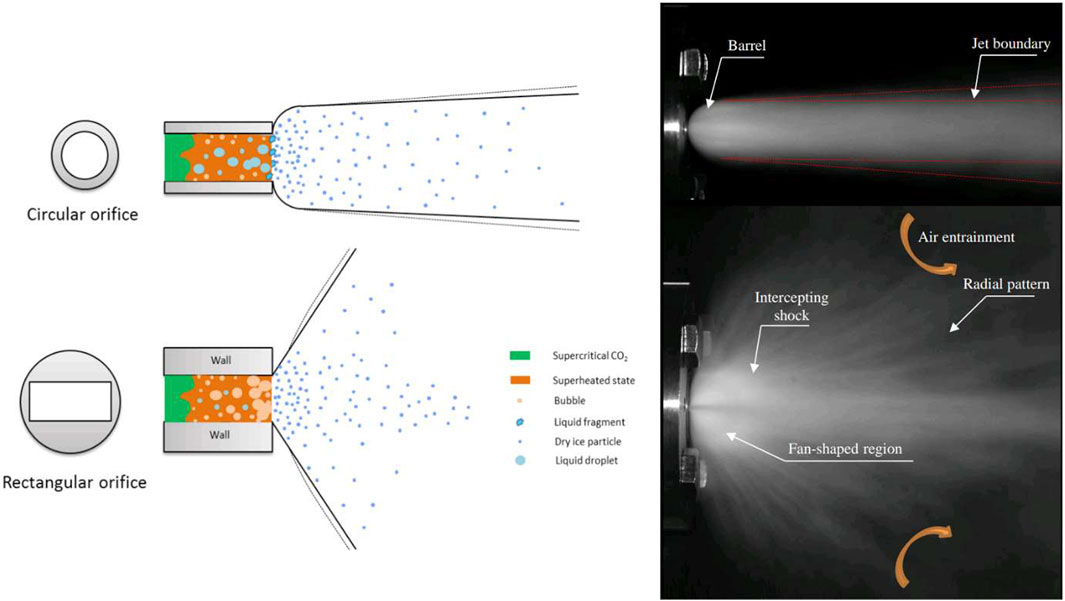
FIGURE 1. The schematic of the non-condensing gas turbulent jet (Dong, 2005).
A schematic of the highly under-expanded jet is shown in Figure 2. An expansion fan generates at the nozzle lip as the flow expands into the atmosphere. The pressure ratio P0/P∞ is an important parameter to describe the expansion level, where P0 is a stagnation pressure in the vessel and P∞ is the ambient pressure. When P0/P∞ > 15, the complicated shock waves system will forms. Except for the intercepting shock in the interior of the jet, the Mack disc normal to the flow is unique for under-expanded jet. The flow front the Mach disc is supersonic, whereas the flow behind the Mach disc is obviously subsonic. The temperature will rise sharply near the Mach disc. However, the shock-wave structure in these jets also depends on a geometry of the nozzle and the property of gas (Velikorodny and Kudriakov, 2012). Some researchers also reported that the Mack disc cannot be observed when the flow jets from a elliptic nozzle (Menon and Skews, 2010).
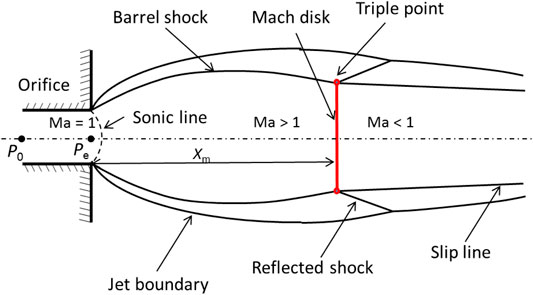
FIGURE 2. The schematic of the under-expanded jet.
For non-condensing gas jet, a theoretical analysis has been developed to predict the Mach disc location,
where Xm is location of the Mach disc, Pe is the static pressure at the exit section. It should be noted that in the fact the Mach disc location weakly depends on γ, and it can be approximated by a commonly used experimental correlation of (Ashkenas and Sherman, 1966):
In order to study the near-field structure of supercritical CO2 released from the pressure pipe, a new experimental device was designed and built, as shown in Figure 3. The experimental apparatus consists of high-pressure vessel, gas source, CO2 pump, refrigerating unit, thermostatic water bath, nozzle, and high-speed camera system. The rated pressure of the vessel with a volume 6 L is 15.0 MPa, and the material is 316L stainless steel. The container is filled with liquid CO2 cooled by a refrigeration unit and controlled by a constant temperature water bath. To study the influence of different orifice diameters and orifice patterns (circular and rectangular) on near-field structure and dispersion of supercritical CO2, six different orifices were used, as shown in Figure 3. The supercritical CO2 near-field jet structure was observed with a single-lens reflector camera with a maximum frame rate of 200,000 FPS (frames per second). In this experiment, the frame rate of the high-speed camera is set at 3000 FPS.
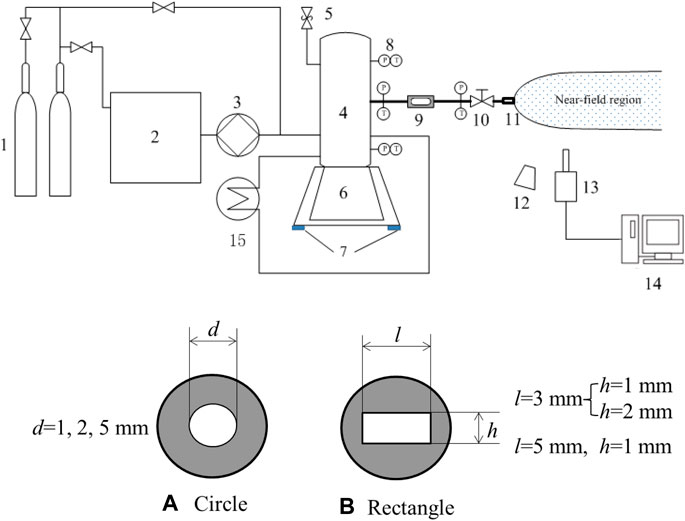
FIGURE 3. Schematic of the experimental setup. 1—CO2 gas bottle, 2—Hermetically sealed refrigerating unit, 3—CO2 cryopump, 4—Super high pressure vessel, 5—Safety valve, 6—Stainless steel base, 7—Load cells, 8—Pressure and temperature sensors, 9—Observation window, 10—Normally closed pneumatic valve, 11—Stainless steel nozzle, 12—Photoflood lamp, 13- High-speed camera (Fastcam SA-X2, Photron Ltd.), 14—Data acquisition system, 15—Thermostatic water bath.
It is very necessary to carry out the experiment under the premise of ensuring the safety of the experiment. In the process of supercritical CO2 injection, steel frame is adopted to prevent the generation of reaction force, and the noise level is controlled in an acceptable range. To ensure the stable experimental conditions, the experiments were carried out indoor to avoid the impact of atmospheric turbulence. According to the actual transportation conditions of CO2 pipeline, most of the initial conditions in the experiment are in the supercritical region. The main steps list as follows: (1) Before work, check whether the connection of the experimental device is loose and whether the container is damaged to ensure the normal operation of the equipment; (2) Open the cleaning mode to empty the air in the container to remove impurities; (3) The liquid carbon dioxide cooled by the refrigerator is fed into the container by means of a CO2 pump; (4) When the appropriate amount of CO2 is injected into the container, all valves are closed and a water bath heating sleeve is used to control the temperature in the container; (5) When the experimental conditions in the container reach the design conditions, the pneumatic valve in the pipeline will be opened quickly; (6) Record the experimental process with high speed camera.
Figure 4 presents that the near-field structure of the supercritical jet from a circular orifice and a rectangular orifice, and the experimental conditions are also presented. Same as the non-condensing gas jet, the jet region of supercritical CO2 is divided into three zones. As shown in Figure 4, in core zone, the concentration of CO2 is 100% and the constituent is gas-solid CO2 (Teng et al., 2018). With increase of jet distance, the air entrainment caused by turbulence resulted in the decrease of CO2 concentration. There is a difference between circular orifice and rectangular orifice. It can be obviously seen that the jet angle of rectangular orifice is much larger than that of circular orifice. But the jet distance of circular orifice is further than that of rectangular orifice. The jet structure in near-field caused the difference. Figure 4A shows that the release from circular hole was typical highly under-expanded jet. The shape of jet is a barrel configuration. The Mack disc appeared in this process. When supercritical CO2 is released from the rectangular orifice, the shockwave system has a fan-shaped structure, as shown in Figure 4B. In addition, the fan-shaped region in near field was brighter than other regions, because a greater concentration of solid CO2 caused a stronger reflex of light. The Mach disc was unobserved and the intercepting shock can be observed. The CO2 jet flows radially after shock wave.
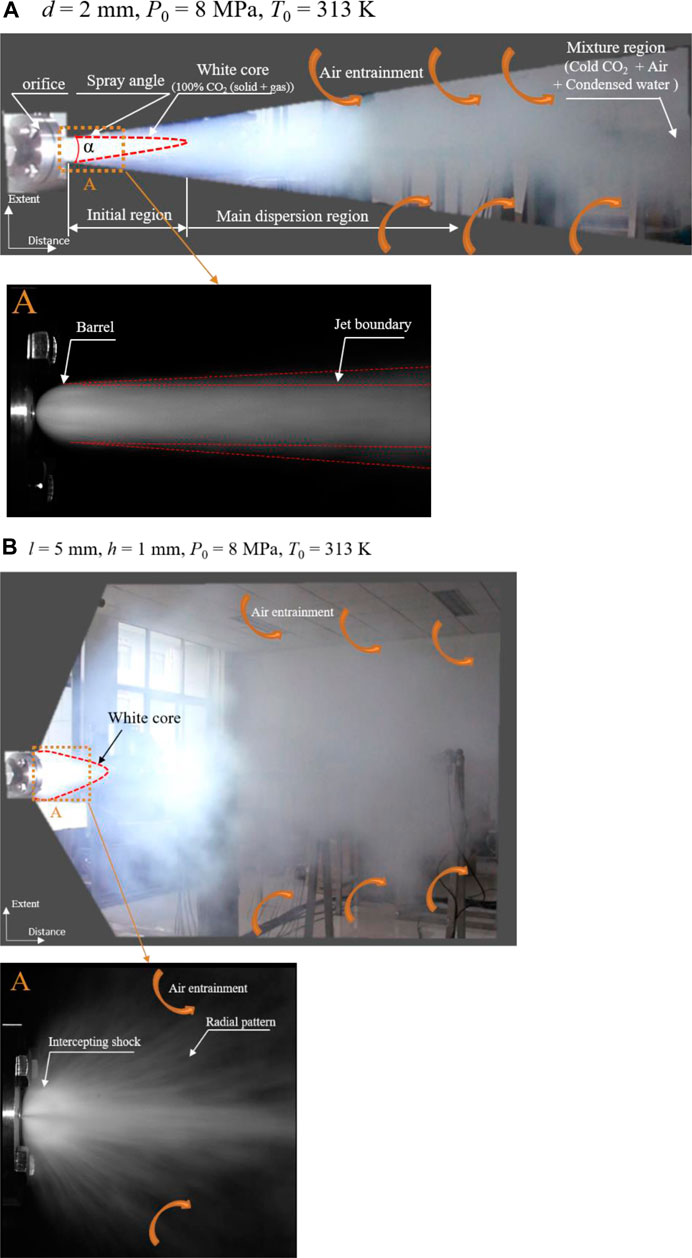
FIGURE 4. The patterns of jet of supercritical CO2 for circular (A) and rectangular (B) orifices.
In the process of release, the air entrainment occurred in a broader region when supercritical CO2 released from a rectangular orifice. This phenomenon may affect the component of heavy gas cloud in the dispersion.
Some researchers show that the Mach disc may not be observed in rectangular jet, even though the pressure ratio is ca. 5.60 (Li et al., 2017). In our research, the Mach disc cannot be observed for rectangular jet. However, the change process of the intercepting shock was recorded by high-speed camera, as shown in Supplementary Video S1. The pressure ratios in the experiments are 70–100. It can be seen from Figure 4 that the brighter region where plenty of micron-level dry ice particles generated has stronger reflectivity. Across the shock system, lots of dry ice particles sublimate due the temperature rose sharply. Thus, lower concentration of dry ice cause weaker reflectivity.
To understand the overall supercritical CO2 jet, the configuration of jet of supercritical CO2 released from a rectangular orifice (5 × 1 mm) was analyzed, as shown in Figure 5. Overall, the shape in the major axis plane is fan-shaped, and the photo from the high-speed camera was presented in Figure 4B. The shape in the minor axis plane is conical and the photo from the high-speed camera was presented in Figure 5. It may be interesting to note that the results show in the minor axis plane, the fluid expands firstly and then shrinks, and finally appears core-shaped. It can be called “Expansion-Contraction-Expansion Configuration (ECEC).” It can be obviously seen from Figure 4; Figure 5 that the shape of jet of supercritical CO2 released from a rectangular orifice is very different from that release from a circular orifice, which may cause the difference of dispersion region.
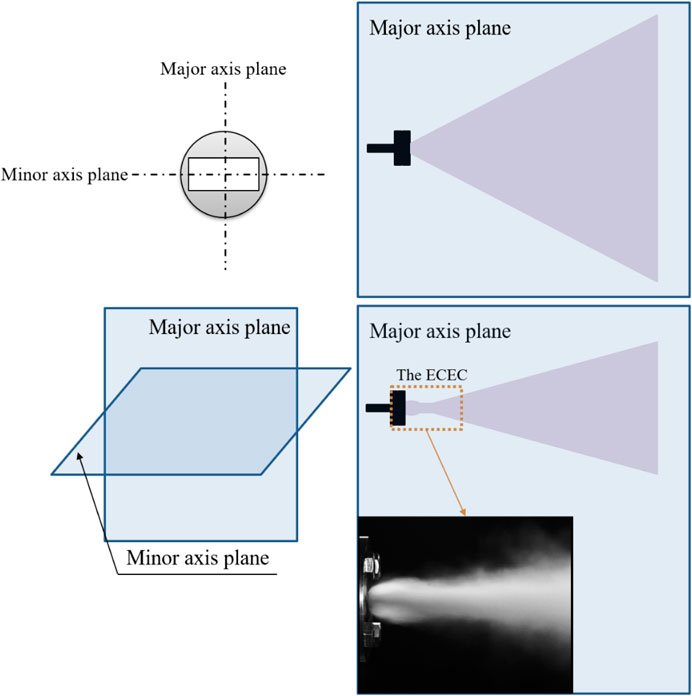
FIGURE 5. The configuration of the supercritical CO2 jet from a rectangular orifice.
The jet angle and shock waves have important impact on the near-field characteristics, which is related to the accuracy of source term model. In order to investigate the effect of orifice pattern on jet angle, a characteristic model of crack was developed to analyze the angle evolution. We assumed that the crack of the pipeline is elliptic. The rectangular orifice was used to characterize the crack. As shown in Figure 6, the length of rectangular orifice is the major axis (a) of the ellipse and the width of rectangular orifice is the minor axis (b) of the ellipse. Thus, the elliptic equation is
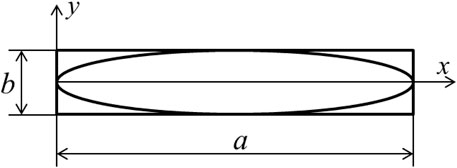
FIGURE 6. The characteristic model of the crack.
If a ≠ b, the variation of the jet angle with b/a was presented, and if a = b, the variation of the jet angle with diameter was presented in Figure 6.
Figure 7 presents the correlation between the peak value of θ (=θmax) and the characteristic parameters (b/a and d) for different pressure. Figure 7 shows the jet angle increases linearly with increased diameter of leakage orifice in circular release. And the jet angle decreases with increase of b/a. It indicates that the longer and narrower crack may cause broader dispersion region. Generally, the maximum jet angle can reach to 180°.
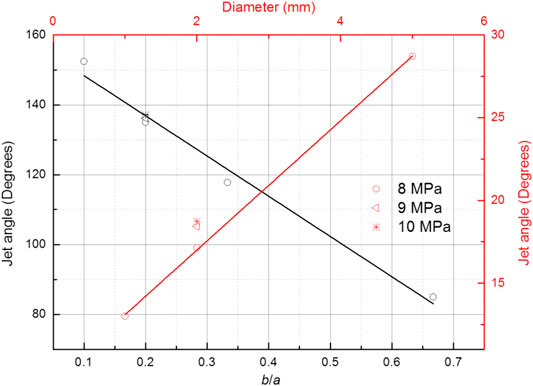
FIGURE 7. Correlation between characteristic parameters (b/a and d) and θmax.
Comparing with the circular release with the similar area (d = 2 mm), the jet angle of the rectangular release (3 × 1 mm) is six times larger than that. Figure 7 also indicates that the transportation pressure has a relatively small impact on the jet angle during supercritical CO2 release. Thus, the peak jet angle (θ) can be given as an empirical equation,
Generally, the current CO2 transportation is under supercritical or dense state (Teng et al., 2016a). But some short-distance CO2 pipeline is under gas state (Teng et al., 2016b). To evaluate the effect of phase states on jet angle, the discharge experiments from a rectangular orifice (5 × 1 mm) for supercritical, dense and gas CO2 were carried out. Figure 8 shows the variation of jet angle with time for three phase states. It can be seen that the effects of different phase states on jet angle are different. The rate of change of jet angle for supercritical CO2 release is nearly constant. In other words, the jet angle increases linearly with time. However, the rate of change of jet angle for dense and gas CO2 release is constant firstly and then increasing. And the peak jet angle of dense CO2 is slightly bigger than that of gas CO2. Overall, it can infer that the jet angles are affected by expanded process and phase transition process inside the nozzles.
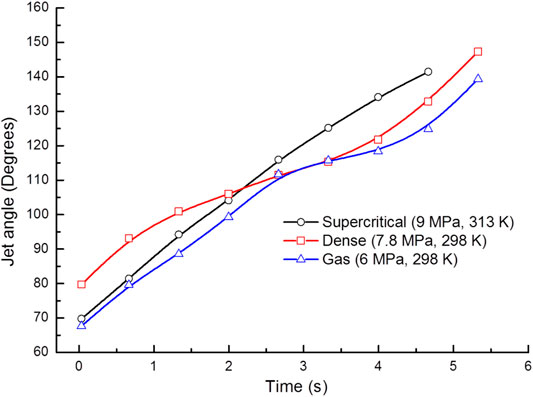
FIGURE 8. The effect of phase states on the jet angle (5x1 mm).
The data points and the error bars denote the averaged value of experimental data and the standard deviations, respectively, as shown in Figure 9. The Mach disc is a feature of under-expanded jet and the temperature changes dramatically across the Mach disc. Many researchers investigated the Mach disc (Abbett, 1971; Veser et al., 2011; Mitchell et al., 2013; Zhou et al., 2018). The pressure ratio in most of the studies is below 20 and the multiphase flow and phase transition was not involved (Otobe et al., 2008). Generally, the location of Mach disc away from the orifice is increasing with the pressure ratio. The condition is a supercritical state in our research, which indicates that the pressure ratio can be over 70. Figure 9 shows the variation of the Mach disc location with pressure ratio when supercritical CO2 released from a circular orifice. It reveals that the Mach disc location Xm increases linearly with the pressure ratio.
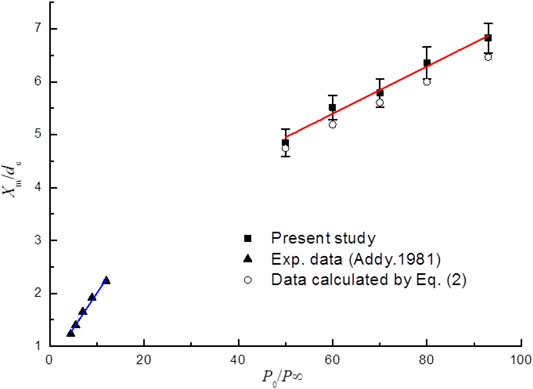
FIGURE 9. The Mack disc location vs. pressure for circular orifice (d = 2 mm).
It can be seen from Figure 9 that Eq. 2 tends to under-predict the Mach disc location. It indicates that the theoretical equation may be not applicable to the jet of supercritical CO2 because the phase transition and multiphase flow appear in this process. Figure 10 shows the peak intercepting shock locations in different size rectangular orifices. It indicates that the intercepting shock location increases approximately linearly with the equivalent diameter de. And the aspect ratio has little impact on the intercepting shock location.
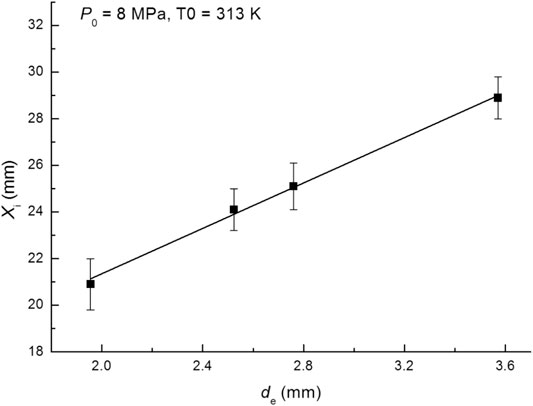
FIGURE 10. The intercepting shock location vs. equivalent diameter for rectangular orifices.
Note that it is difficult to observe or measure directly the internal situation of multiphase jet in such a supercritical release because of the complex phase transition and multiphase flow. The mechanisms of multiphase jet of supercritical CO2 can be drawn from the present experimental results including the near-field jet structure, expanded angle, and shock waves. Figure 11 presents the schematic of the model of multiphase jet of supercritical CO2 released from different pattern orifices. Overall, the multiphase jet appears due to the joint effect of internal and external transition. The supercritical CO2 in the chamber is transformed to metastable state (supersaturated state) due to the rapid pressure drop. The extremely rapid nucleation of vapor bubble in superheated state would occur with further pressure drop. This process can be supposed to homogeneous nucleation. Meanwhile, the droplets appear in the process of homogeneous nucleation. The classical nucleation theory (CNT) (Zelʹdovich, 1961) for the spontaneous nucleation is
where J is nucleation rate, kB is Boltzmann constant, m is single molecular mass, ΔG is the free energy barrier,
Where rc is the critical radius, v is specific volume, R is universal gas constant, and p is pressure.
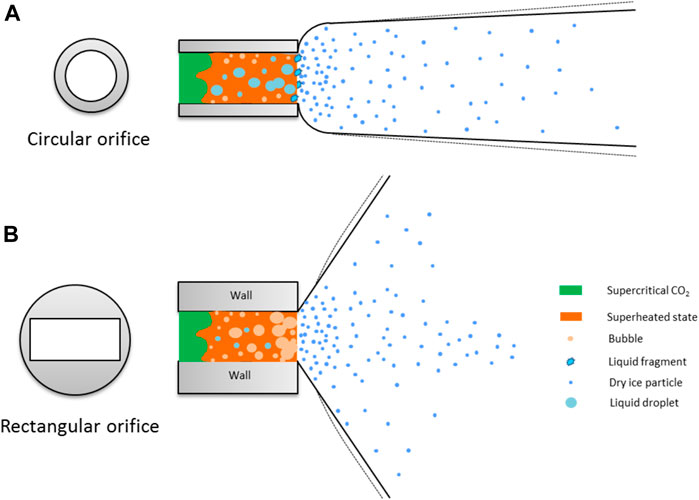
FIGURE 11. Schematic of the supercritical CO2 multiphase jet models.
Outside the chamber, the temperature reduces below triple point, which caused by Joule-Thomson effect, and then plenty of dry ice particles jet fast. As shown in near-field structure, the biggest difference between circular and rectangular jet is the different of jet angle. In earlier work (Wu et al., 1983), in the atomization regime for liquid, the jet angle was found to follow the relationship
where θ is the jet angle, ρg is the density of the gas outside the chamber, ρm is the density of the multiphase fluid in the chamber, A is a constant for a given nozzle geometry and C is also a constant, and
This paper presents the experimental results of near-field structure when supercritical CO2 releases from the orifices with different sizes and patterns. The main conclusions are summarized as follows:
1) The shape of supercritical CO2 jet from a circular orifice is a near-cylinder structure and the process is a highly under-expanded jet marked with the Mach disc. However, when supercritical CO2 is released from the rectangular orifice, the shock wave system has a fan-shaped structure, and the dispersion region perpendicular to the jet is wide.
2) According to the characteristic model of the crack, the peak jet angle increases linearly with increased diameter of leakage orifice in a circular jet. And the peak jet angle decreases with increase of b/a in a rectangular jet.
3) The traditional equation tends to under-predict the Mach disc location. The intercepting shock location in a rectangular jet increases approximately linearly with the equivalent diameter de.
4) The supercritical CO2 in the chamber is transformed to metastable state firstly, and then the droplets growth and coalescence transforms the supersaturated fluid to the liquid-domain two-phase flow for the circular jet; however, the bubble nucleation and growth transforms the flow to gas-domain two-phase flow for the rectangular jet. In the outside, the solidification process causes CO2 gas-particle flow.
The original contributions presented in the study are included in the article/Supplementary Material, further inquiries can be directed to the corresponding author.
LT and JB contributed to conception and design of the study. LT wrote sections of the manuscript. LT, JB, YL, and CW wrote sections of the manuscript. All authors contributed to manuscript revision, read, and approved the submitted version.
The present work is supported by the Research Foundation of Fuzhou University (Grant No. GXRC-20041) and the Natural Science Foundation of Chongqing (Grant No. CYY202010102001).
The authors declare that the research was conducted in the absence of any commercial or financial relationships that could be construed as a potential conflict of interest.
All claims expressed in this article are solely those of the authors and do not necessarily represent those of their affiliated organizations, or those of the publisher, the editors and the reviewers. Any product that may be evaluated in this article, or claim that may be made by its manufacturer, is not guaranteed or endorsed by the publisher.
The Supplementary Material for this article can be found online at: https://www.frontiersin.org/articles/10.3389/fenrg.2021.697031/full#supplementary-material
A, orifice area; d, diameter of the nozzle; de, equivalent diameter of the nozzl
Abbett, M. (1971). Mach disk in underexpanded exhaust plumes. AIAA J. 9, 512–514. doi:10.2514/3.6212
Ahmad, M., Osch, M. B.-v., Buit, L., Florisson, O., Hulsbosch-Dam, C., Spruijt, M., et al. (2013). Study of the thermohydraulics of CO2 discharge from a high pressure reservoir. Int. J. Greenhouse Gas Control. 19, 63–73. doi:10.1016/j.ijggc.2013.08.004
Ashkenas, H., and Sherman, F. S. (1966). Experimental methods in rarefied gas dynamics: Jet Propulsion Laboratory. California: California Institute of Technology.
Guo, X., Yan, X., Yu, J., Zhang, Y., Chen, S., Mahgerefteh, H., et al. (2016). Under-expanded jets and dispersion in supercritical CO2 releases from a large-scale pipeline. Appl. Energ. 183, 1279–1291. doi:10.1016/j.apenergy.2016.09.088
John, G., and John, D. (2004). Transmission of CO2—safety and economic considerations, IEA Greenhouse Gas R&D Programme. Energy 29, 1319–1328.
Joshi, P., Bikkina, P., and Wang, Q. (2016). Consequence analysis of accidental release of supercritical carbon dioxide from high pressure pipelines. Int. J. Greenhouse Gas Control. 55, 166–176. doi:10.1016/j.ijggc.2016.10.010
Li, X., Zhou, R., Yao, W., and Fan, X. (2017). Flow characteristic of highly underexpanded jets from various nozzle geometries. Appl. Therm. Eng. 125, 240–253. doi:10.1016/j.applthermaleng.2017.07.002
Lin, T.-C., Shen, Y.-J., and Wang, M.-R. (2013). Effects of superheat on characteristics of flashing spray and snow particles produced by expanding liquid carbon dioxide. J. Aerosol Sci. 61, 27–35. doi:10.1016/j.jaerosci.2013.03.005
Liu, B., Liu, X., Lu, C., Godbole, A., Michal, G., and Tieu, A. K. (2016). Computational fluid dynamics simulation of carbon dioxide dispersion in a complex environment. J. loss Prev. process industries 40, 419–432. doi:10.1016/j.jlp.2016.01.017
Liu, X., Godbole, A., Lu, C., Michal, G., and Venton, P. (2014). Source strength and dispersion of CO2 releases from high-pressure pipelines: CFD model using real gas equation of state. Appl. Energ. 126, 56–68. doi:10.1016/j.apenergy.2014.03.073
Menon, N., and Skews, B. W. (2010). Shock wave configurations and flow structures in non-axisymmetric underexpanded sonic jets. Shock Waves 20, 175–190. doi:10.1007/s00193-010-0257-z
Metz, B., Davidson, O., De Coninck, H., Loos, M., and Meyer, L. (2005). “IPCC special report on carbon dioxide capture and storage,” in Prepared by Working Group III of the Intergovernmental Panel on Climate Change (Cambridge, United Kingdom and New York, USA: IPCC, Cambridge University Press), 4.
Mitchell, D. M., Honnery, D. R., and Soria, J. (2013). Near-field structure of underexpanded elliptic jets. Exp. Fluids 54, 1578. doi:10.1007/s00348-013-1578-3
Nagayama, G., Tsuruta, T., and Cheng, P. (2006). Molecular dynamics simulation on bubble formation in a nanochannel. Int. J. Heat Mass Transfer 49, 4437–4443. doi:10.1016/j.ijheatmasstransfer.2006.04.030
Otobe, Y., Kashimura, H., Matsuo, S., Setoguchi, T., and Kim, H.-D. (2008). Influence of nozzle geometry on the near-field structure of a highly underexpanded sonic jet. J. Fluids Structures 24, 281–293. doi:10.1016/j.jfluidstructs.2007.07.003
Teng, L., Li, Y., Zhang, D., Ye, X., Gu, S., Wang, C., et al. (2018). Evolution and Size Distribution of Solid CO2 Particles in Supercritical CO2 Releases. Ind. Eng. Chem. Res. 57, 7655–7663. doi:10.1021/acs.iecr.8b00178
Teng, L., Li, Y., Zhao, Q., Wang, W., Hu, Q., Ye, X., et al. (2016). Decompression characteristics of CO2 pipelines following rupture. J. Nat. Gas Sci. Eng. 36, 213–223. doi:10.1016/j.jngse.2016.10.026
Teng, L., Zhang, D., Li, Y., Wang, W., Wang, L., Hu, Q., et al. (2016). Multiphase mixture model to predict temperature drop in highly choked conditions in CO2 enhanced oil recovery. Appl. Therm. Eng. 108, 670–679. doi:10.1016/j.applthermaleng.2016.07.156
Velikorodny, A., and Kudriakov, S. (2012). Numerical study of the near-field of highly underexpanded turbulent gas jets. Int. J. Hydrogen Energ. 37, 17390–17399. doi:10.1016/j.ijhydene.2012.05.142
Veser, A., Kuznetsov, M., Fast, G., Friedrich, A., Kotchourko, N., Stern, G., et al. (2011). The structure and flame propagation regimes in turbulent hydrogen jets. Int. J. Hydrogen Energ. 36, 2351–2359. doi:10.1016/j.ijhydene.2010.03.123
Wang, C., Li, Y., Teng, L., Gu, S., Hu, Q., Zhang, D., et al. (2019). Experimental study on dispersion behavior during the leakage of high pressure CO2 pipelines. Exp. Therm. Fluid Sci. 105, 77–84. doi:10.1016/j.expthermflusci.2019.03.014
Wang, H., Liu, B., Liu, X., Lu, C., Deng, J., and You, Z. (2020). Dispersion of carbon dioxide released from buried high-pressure pipeline over complex terrain. Environ. Sci. Pollut. Res. doi:10.1007/s11356-020-11012-7
Wareing, C., Fairweather, M., Peakall, J., Keevil, G., Falle, S., and Woolley, R. (2013). Numerical modelling of particle-laden sonic CO2 jets with experimental validation. AIP Conf. Proc. AIP Publishing LLC, 98–102.
Wareing, C. J., Fairweather, M., Falle, S. A. E. G., and Woolley, R. M. (2014). Validation of a model of gas and dense phase CO2 jet releases for carbon capture and storage application. Int. J. Greenhouse Gas Control. 20, 254–271. doi:10.1016/j.ijggc.2013.11.012
Wareing, C. J., Woolley, R. M., Fairweather, M., and Falle, S. A. E. G. (2013). A composite equation of state for the modeling of sonic carbon dioxide jets in carbon capture and storage scenarios. Aiche J. 59, 3928–3942. doi:10.1002/aic.14102
Webber, D. M. (2011). Generalising two-phase homogeneous equilibrium pipeline and jet models to the case of carbon dioxide. J. Loss Prev. Process Industries 24, 356–360. doi:10.1016/j.jlp.2011.01.010
Woolley, R. M., Fairweather, M., Wareing, C. J., Proust, C., Hebrard, J., Jamois, D., et al. (2014). An integrated, multi-scale modelling approach for the simulation of multiphase dispersion from accidental CO2 pipeline releases in realistic terrain. Int. J. Greenhouse Gas Control. 27, 221–238. doi:10.1016/j.ijggc.2014.06.001
Wu, K.-J., Su, C.-C., Steinberger, R. L., Santavicca, D. A., and Bracco, F. V. (1983). Measurements of the spray angle of atomizing jets. J. Fluids Eng. 105, 406–413. doi:10.1115/1.3241019
Zelʹdovich, I. Ak. B. (1961). Theory of formation of a new phase cavitation. USA: US Joint Publications Research Service.
Zhou, Z., Yanfei, L., Xiao, M., Haichun, D., Hongming, X., Zhi, W., et al. (2018). Characteristics of trans-critical propane spray discharged from multi-hole GDI injector. Exp. Therm. Fluid Sci. 99, 446–457.
Keywords: supercritical CO2, release, near-filed structure, flashing-spray model, Mach disc
Citation: Teng L, Bai J, Li Y and Wang C (2021) An Experiment on Flashing-Spray Jet Characteristics of Supercritical CO2 from Various Orifice Geometries. Front. Energy Res. 9:697031. doi: 10.3389/fenrg.2021.697031
Received: 12 May 2021; Accepted: 24 August 2021;
Published: 08 October 2021.
Edited by:
Michelle. K Kidder, Oak Ridge National Laboratory (DOE), United StatesReviewed by:
Muhammad Farooq, University of Engineering and Technology, PakistanCopyright © 2021 Teng, Bai, Li and Wang. This is an open-access article distributed under the terms of the Creative Commons Attribution License (CC BY). The use, distribution or reproduction in other forums is permitted, provided the original author(s) and the copyright owner(s) are credited and that the original publication in this journal is cited, in accordance with accepted academic practice. No use, distribution or reproduction is permitted which does not comply with these terms.
*Correspondence: Lin Teng, dGVuZ2xpbkBmenUuZWR1LmNu
Disclaimer: All claims expressed in this article are solely those of the authors and do not necessarily represent those of their affiliated organizations, or those of the publisher, the editors and the reviewers. Any product that may be evaluated in this article or claim that may be made by its manufacturer is not guaranteed or endorsed by the publisher.
Research integrity at Frontiers
Learn more about the work of our research integrity team to safeguard the quality of each article we publish.