 Pan Wu
 Lixin Zhang1
 Jianqiang Shan
- 1School of Nuclear Science and Technology, Xi’an Jiaotong University, Xi’an, China
- 2The State Key Laboratory of Multiphase Flow in Power Engineering, Xi’an Jiaotong University, Xi’an, China
Dual cooled annular fuel is a novel fuel design, which has the potential to improve the reactor power density while maintaining or improving its safety margin. The effects of tight-lattice geometry, fuel burnup, fuel expansion, coolant channel blockage on the thermal hydraulic performance of annular fuel is studied to illustrate its special features in this paper. A sub-channel analysis code named NACAF, which includes empirical constitutive models in consideration of tight-lattice effects on prediction of pressure drop, critical heat flux and turbulent mixing, channel blockage model, heat conduction model for dual surface cooling condition, coolant flowrate distribution between inner and outer channel, is developed for annular fuel assembly or core analysis based on homogenous fluid model. Validation work is carried out with comparing NACAF results with analytical solutions, as well as numerical results of existing sub-channel code for annular fuel, such as VIPRE-01 and TAFIX. Comparison results demonstrates NACAF’s prediction error is acceptable and it has the ability to simulate thermal hydraulic performance of annular fuels or annular fuel bundles. Based on the developed and verified NACAF, the special thermal hydraulic phenomena of annular fuel are studied to clarify the features of annular fuel.
Introduction
The annular fuel concept proposed by MIT can be cooled internally and externally at the same time, which is a new fuel design that can increase power density by more than 30% of its original value and provide higher safety margin (Kazimi and Hejzlar, 2006). Annular fuel has advantages of shorter heat transfer path and larger heat transfer area than traditional solid rod fuel. It has been considered as a novel fuel design for different types of nuclear reactor concepts, such as liquid cooled fast reactor (Rowinski and White, 2015), CANDU (Nava Dominguez and Rao, 2020), gas cooled reactor (Han et al., 2006) and water cooled reactor (Shin and Chun, 2012; Kwon and Kim, 2019).
As a new fuel concept, annular fuel has some special thermal hydraulic features which are different from traditional solid fuel. Annular fuel has dual cooling surface, which demands the thermal hydraulic analysis code to split the coolant according to principle of constant pressure drop in each channel. Annular fuel is designed to have a larger outside diameter to keep the same fuel to moderator volume ratio with solid fuel. A 13 × 13 annular fuel arrangement was recommended due to its best thermal hydraulic performance and largest minimum departure nucleate boiling ratio (MDNBR) in a square assembly which has the same size for 17 × 17 solid fuel (Feng and Hejzlar, 2007). Larger outside diameter results in smaller ratio of pitch over diameter (P/D ratio), which is an important factor affecting the thermal hydraulic performance of coolant flowing in sub-channels. Annular fuel assembly has a P/D ratio around 1.08 while solid fuel assembly has a P/D ratio around 1.35. Previous research results demonstrated that P/D ratio exert an influence on prediction accuracy for critical heat flux (CHF) (Groeneveld et al., 1992), pressure drop (Lee and Shin, 2012) and turbulent mixing (Lee and Shin, 2013). Moreover, with the fuel burnup increases, the dimension and conductivity of the annular fuel will change (Yilmaz and Avramova, 2016), which effects the heat flux split on the inner and outer surface and the fuel thermal hydraulic performance (Yuan and Kazimi, 2007). Additionally, the consequence of channel blockage should be carefully evaluated to assess the annular fuel performance under abnormal conditions.
In order to finalize the above thermal hydraulic performance prediction for annular fuel, a sub-channel analysis code should be developed. Many countries have developed thermal hydraulic analysis codes. Table 1 summarizes the current status of sub-channel codes for annular fuel based on traditional two fluid model which are numerically solved by finite volume method. New methods have also been used to carry out thermal hydraulic calculation for annular fuel. Esmaili et al. (2019) applied orthogonal collocation method to numerically solve the temperature distribution of annular fuel. Esmaili et al. (2020) used preconditioned Jacobian-free Newton Krylov methods to reduce computational cost of sub-channel code. However, Neither of these codes consider the effects of tight-lattice on the thermal hydraulic performance of annular fuel.
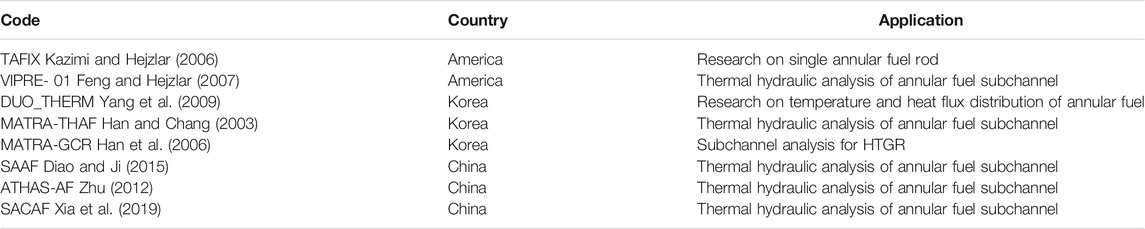
TABLE 1. Development status of annular fuel analysis codes.
In this paper, a thermal hydraulic sub-channel analysis code for annular fuel named NACAF is developed based on homogenous model. The main conservation equations and constitutive models including the annular fuel features are introduced in Development of NACAF code. In Code verification of NACAF, the code verification of the NACAF code is carried out through comparison with analytical solution and code to code comparison. The special thermal hydraulic phenomena study of annular fuel assembly is carried out to investigate the effects of the tight-lattice geometry, fuel burnup, fuel dimensional change and partial blockage. The conclusions of this paper are presented in Conclusions.
Development of NACAF Code
Geometry of Annular Fuel
As shown in Figure 1A, annular fuel has dual cooling surfaces, and the fission energy produced by the fuel pellet is distributed to the inner and outer channels depending on the heat conduction of the fuel pellet and coolant state in the flow channel. The coolant flowing into the fuel assembly is distributed to the inner and outer channel according to the principle of constant pressure drop. As shown in Figure 1B, the outer channel is an open channel, which allow mass, momentum and energy exchange between outer channels, while the inner channel is an isolated flow path.
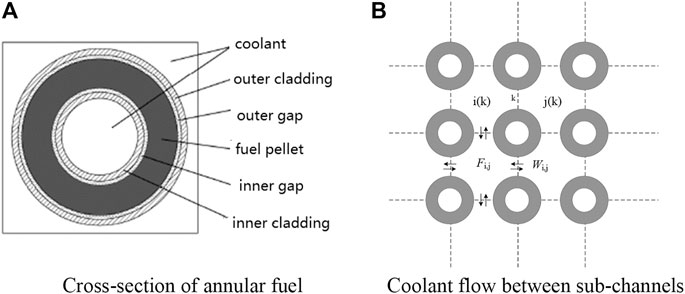
FIGURE 1. Schematic diagram of annular fuel and coolant flow relationship between sub-channels.
Conservation Equations of NACAF
Code NACAF applies homogenous model to calculate the thermal-hydraulic behavior of the coolant. Homogenous model is particularly well adapted for the simulation of dispersed bubbly flow or single phase flow, which is just the flow types we are investigating in the paper. In order to facilitate numerical simulation, it is necessary to divide the coolant flow area in the fuel assembly into many control volumes in the lateral and axial directions. In the axial direction, the flow channel is averagely divided into different nodes depending on the user’s requirement. In the lateral direction at each elevation, the flow area outside of the fuel pellet is divided into different sub-channels as what have been done in traditional sub-channel code for solid fuel, and the inner flow channel of the annular fuel is regarded as a single isolated sub-channel, as shown in Figure 2. In the left figure, an annular fuel rod bundle is made up of outer channel, inner channel, gap, fuel element, assembly border. In the right figure, i and j denote the serial number of the sub-channel in radial and axial direction. J denotes the total number of control volumes in the axial direction. For the minimum control volume in right figure, the mass, energy and momentum conservation equations are established according to theory of homogenous model presented in this book (Shan et al., 2017).
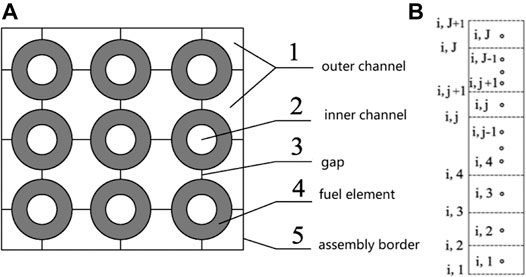
FIGURE 2. Division and numbering of sub-channel (A) and axial section (B).
Mass Conservation Equation
The mass conservation equation for fluid is written as follows:
Where,
The first term in Eq. (1) represents the mass storage in a control volume; the second term represents the mass of coolant flowing in and out of the control volumes.
Energy Conservation Equation
The energy conservation equation for the control volume is written as follows:
where the first term on the left-hand side denotes the energy storage in the control volume. The second term denotes the energy of coolant flowing in and out of the control volume. On the right–hand side in Eq. 2, the first term represents the heat flux from the fuel rods. The second term denotes the energy generated in the control volume. The third and the forth term denotes the work produced by surface force and gravity.
Momentum Conservation Equation
The momentum conservation equation for the control volume is written as follows:
where the subscript W represents solid wall boundary, the subscript F represents fluid boundary. The first term on the left-hand side of Eq. 3 denotes the momentum inflowing and outflowing through the connection with other control volumes. The second term denotes the momentum in the control volumes. On the right–hand side, the first term denotes the surface stress tensor (tangential and normal forces) from fluid boundary. The second tensor represents the surface stress tensor (tangential and normal forces) from solid wall boundary. The last term denotes the gravity of the control volume.
Eqs. 1–3 makes up the basic equations to obtain the coolant thermal-hydraulic condition. All lateral flow velocity of coolant flowing in the inner channel is 0.
Constitutive Models for Annular Fuel
Constitutive models including wall friction correlation, heat transfer correlation, CHF correlation and turbulent mixing correlation, are required to help numerically solve the above conservation equations simultaneously.
Wall Friction Model
The pressure drop correlation due to wall friction in single phase flow is presented as follow:
The single-phase friction factor f can be calculated by the Blasius equation (Elger et al., 2016):
Where the constants a, b, and c are determined from the experimental data of single-phase flow in a smooth circular tube. For turbulent flow, a = 0.32, b = −0.25, c = 0.0. For laminar flow, a = 64.0, b = −1.0, c = 0.0 (Elger et al., 2016).
The normal gap width over fuel diameter is around 0.35 for solid fuel assembly in PWR, while it’s around 0.08 in annular fuel assembly. The tight-lattice geometry of annular fuel assembly has a great impact on the frictional resistance coefficient of the rod bundle according to previous researches (Lee and Shin, 2012). Traditional friction correlations suitable for smooth circular tube over-predict the pressure drop of tight-lattice assembly whose normal gap width over fuel diameter is lower than 0.1. This is mainly due to the non-uniform velocity and wall shear stress distribution in the flow channels of tight-lattice fuel assembly (Rehme, 1972). In order to take the tight-lattice effect into consideration, the frictional resistance coefficient model based on experimental data of bare 4 × 4 annular fuel bundle is embedded in NACAF. The frictional resistance coefficient is defined as (Lee and Shin, 2012):
where,
CHF Model
In order to consider the tight-lattice effect on CHF prediction, a correction factor for CHF prediction is adopted to the code. The CHF calculation correlation (Groeneveld et al., 1992) is defined as:
where,
where,
Turbulent Mixing Model
The calculation model for the mixing of turbulent flow is defined as (Wu and Oka, 2015):
where,
The correlation of turbulent mixing coefficient used in NACAF refers to the work of (Gabraith and Knudsen, 1972; Castellana et al., 1974):
where,
Channel Blockage Model
For annular fuel, the debris or obstacles are possible to block the inner or outer coolant flow channel. It’s easier for sub-channel code to use form resistance k to represent the blockage ratio instead of reducing the flow area. The relationship between the inlet form resistance k and the blockage ratio is calculated by the following equation refer to (Idelchik, 1994):
C is a constant coefficient, which is set as 0.5 in this paper. The blockage ratio ε is calculated by:
Among them,
The parameter
Coolant Flowrate Distribution Model
The axial pressure drop of each coolant channel equals to each other in an annular fuel assembly. The sub-channel code must distribute a suitable flowrate to each channel to achieve this criterion within a limited iteration. The total axial pressure drop of onecoolant channel can be written as:
Where,
Eq. 17 can be expanded into a more specific form (Shan, et al., 2017):t
where,
Heat Conduction Model
The heat conduction model is used to solve the temperature field of annular fuel rod and obtain the heat flux split to inner and outer surface. Due to the special structure of the annular fuel rod, the fuel pellet is cooled simultaneously by coolant flowing in the inner and outer channel. A heat conduction model with convective boundary condition at both sides is developed in NACAF to distribute the heat to the internal and external channels.
The annular fuel pellet can be divided into N nodes in the radial direction, as shown in Figure 3. The differential equation of heat conduction in the one-dimensional coordinate system is defined as (Tao, 2013):
where,
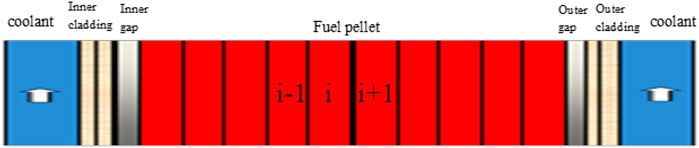
FIGURE 3. Radial node division of annular fuel.
The thermal resistances between node i and (i-1) can be expressed as:
where, δ is the length from node center to the node boundary in unit of m, k is the thermal conductivity in unit of W/m2/K,
As shown in Figure 4, the annular fuel is divided into N control volumes in the radial direction. The one-dimensional discrete equation of heat conduction of the annular fuel can be reorganized as:
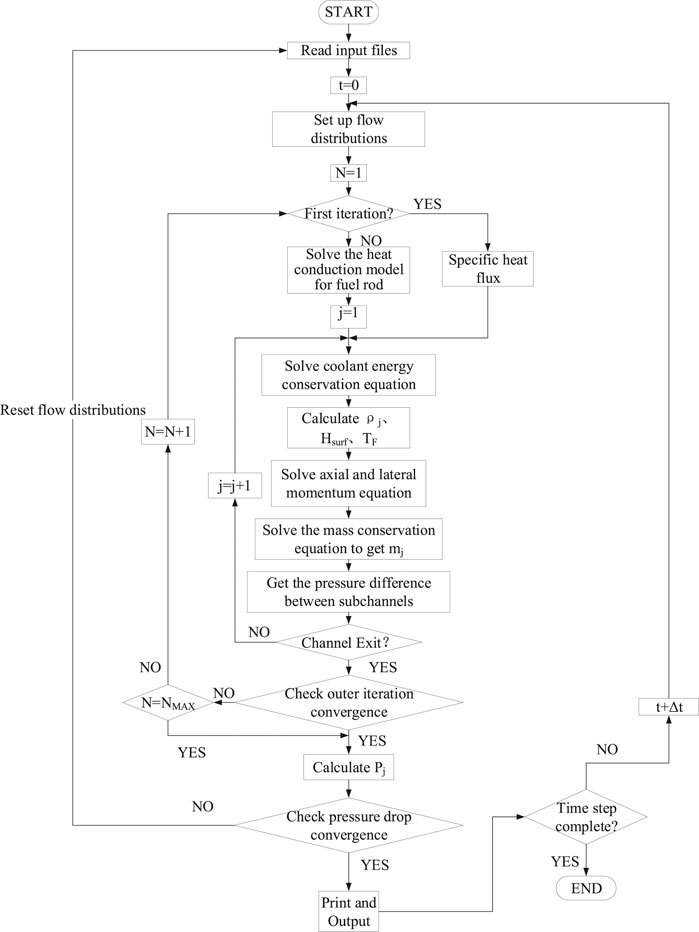
FIGURE 4. Calculation flow-chart of NACAF.
Based on the above equation, the temperature matrix for each node is formed:
The solution of each node temperature can be achieved by Gaussian elimination method.
The fuel pellet conductivity is key to the radial temperature distribution and heat flux spilt. It will change with the burnup and fuel porosity fraction. The fuel conductivity model used in NACAF consider the effects of fuel temperature, fuel porosity fraction and burnup. The modified fuel thermal conductivity model (Hagrman, 1979; Tong and Weisman, 1979) is defined as:
where, KT represents the thermal conductivity of
KT, KP, Kb are defined as:
where, T in Eq. 25 is the fuel temperature in unit of °C, P in Eq. 26 represents the porosity fraction in the fuel. BU in Eq. 27 indicates the fuel burnup (MWD/TU). The gas gap heat transfer coefficient is assumed to be 6000 W·(m2·K)−1.
Calculation Flow
The calculation flow chart of NACAF which contains inner and outer iterations is shown in Figure 4. The fuel bundle geometry as well as the flow and pressure boundary are read as input of NACAF. The flow channel is separated into J sections in the axial direction. At the beginning of the numerical process, an initial coolant flowrate distribution among sub-channels is assumed and the first outer iteration step (N = 1) starts. During the outer iteration N, the thermal-hydraulic state of coolant inside sub-channels are calculated from the bottom of the flow channel (j = 1) to the top (j = J) of the flow channel. For flow channels at a certain height, the fuel conduction model and coolant energy conservation equation are solved together to get the coolant enthalpy for all sub-channels and fuel temperature distribution for all fuel rods. Then the coolant enthalpy can be used to obtain the coolant density, which is further used to solve the momentum equations for axial flow and lateral flow, as well as the mass equation for each control volume at this axial height. After these calculations, the thermal-hydraulic state of coolant at this axial height is obtained and the calculation moves to sub-channels for the next axial height until the channel outlet is reached (j = J). This process is called inner iteration. After the inner iteration is finished, the convergence criterion is checked whether to proceed to next outer iteration. If the outer iteration criterion is satisfied, check if the pressure drop in each sub-channels is all the same. If not, the coolant flowrate distribution between each sub-channels need to be adjusted and the outer and inner iterations start to repeat again.
Code Verification of NACAF
Comparison of NACAF With Analytical Solution
In this paper, radial fuel temperature distribution is validated through analytical solution of annular fuel. The radial temperature analytical correlations and boundary of the single annular fuel model are presented as follows (Bejan and Kraus, 2003):
where
Figure 5 shows the comparison of radial temperature predicted by NACAF and analytical solution. It is evident that the predicted temperature distribution in the radial direction are very close to the analytical solution.
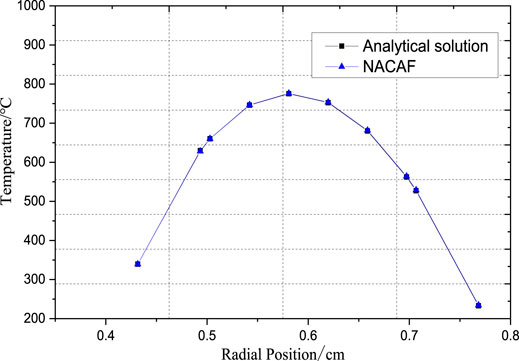
FIGURE 5. Comparison of radial temperature.
Comparison With TAFIX and VIPRE
The results of NACAF (including pressure drop, flow distribution and DNBR) are further validated through code-to-code comparison with TAFIX and VIPRE-01 (Feng, 2005; Kazimi and Hejzlar, 2006). The single annular fuel rod model will be selected as the reference simulation object. Supplementary Table S3 (included in supplementary material) shows the operating condition of a single annular fuel rod. The empirical correlations selected for NACAF in this verification work are the same as what were applied in TAFIX and VIPRE-01 (Feng, 2005; Kazimi and Hejzlar, 2006), as shown in Supplementary Table S1 (included in the supplementary material). The tight-lattice effect on pressure drop, turbulent mixing and CHF prediction are ignored here.
The comparison of the key thermal hydraulic parameters for annular fuel calculated by these three codes are shown in Figure 6. As shown in Figures 6A,B, the heat flux of the inner and outer surface are compared. The heat flux distribution along the axial height predicted by these three codes are similar and the maximum relative error of NACAF is 3.49% when compared to TAFIX and is 2.12% when compared to VIPRE-01. The heat transfer coefficients for inner and outer channel along the axial height are compared in Figures 6C,D. The overall variation trend is coincident and the maximum relative error is 9.70% compared to TAFIX and 4.59% compared to VIPRE-01. The heat transfer coefficient predicted by VIPRE-01 is higher than the prediction of TAFIX and NACAF at upper elevation, while the results of TAFIX and NACAF is close to each other. The DNBR variation along with axial height predicted by these three codes are similar, while the minimum DNBR values are different. NACAF predicts the largest MDNBR value for the inner channel and the smallest MDNBR value for the outer channel. It is apparent that the differences of these results calculated by the three codes are very small. Prediction errors exist in the comparison due to the difference on factors such as water-steam physical parameters and two-phase friction models.
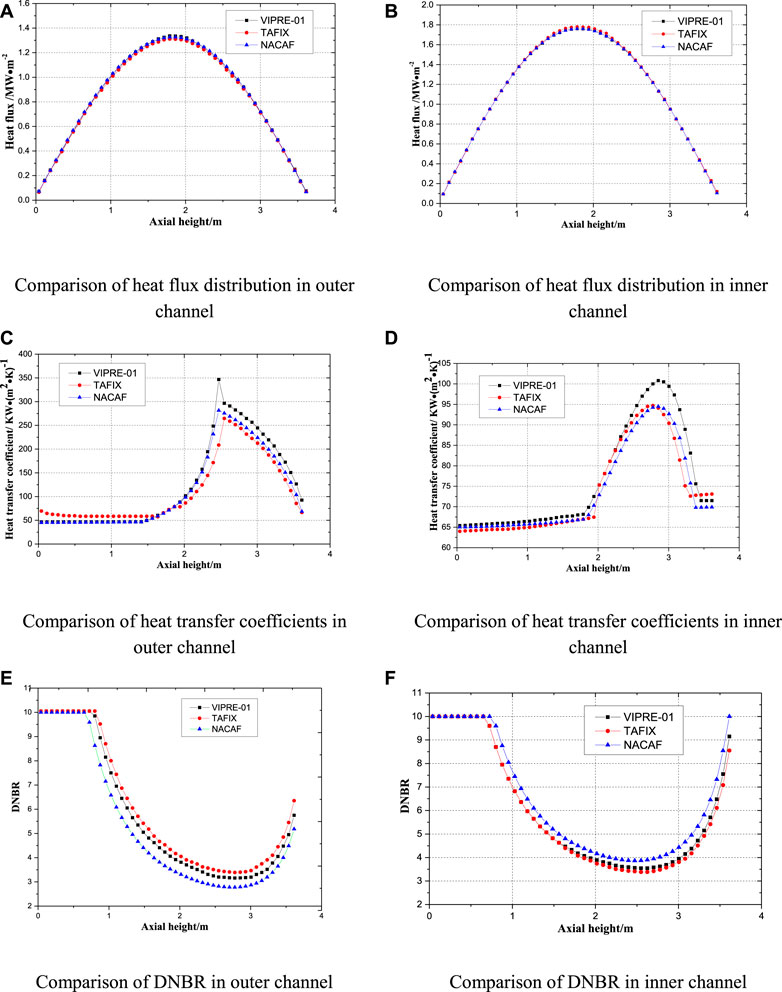
FIGURE 6. Comparison of thermal hydraulic parameters calculated by three sub-channel codes.
The prediction performances of NACAF compared with TAFIX and VIPRE-01 are summarized in Supplementary Table S4 (included in supplementary material). The relative flowrate prediction errors of NACAF for inner and outer channel are around 1.9 and 2.1% compared to results predicted by TAFIX and are around 0.7 and 0.5% compared to results predicted by VIPRE-01. The relative pressure drop prediction error of NACAF for inner and outer channel is around 3.2% compared to results predicted by TAFIX and is around 0.7% compared to results predicted by VIPRE-01.
In conclusion, the maximum relative prediction error of coolant flowrate, pressure drop, heat flux and DNBRs is lower than 5% when compared to previous developed codes, which demonstrates that the coolant flowrate split model, heat conduction model, wall friction model and the numerical solution method incorporated in NACAF are successfully developed. NACAF can be used to carry out thermal hydraulic analysis for annular fuel assemblies and cores.
Special Thermal Hydraulic Phenomena Study for Annular Fuel Assembly
Tight-Lattice Effect on Annular Fuel Assembly
Description of Study on Tight-Lattice Effect
The results calculated by using different correlations (which are suitable to P/D = 1.08 and P/D = 1.35) are compared to analyze the tight-lattice effect on the turbulent mixing rate, CHF and pressure drop of the annular fuel assembly. The fuel rod arrangement and the radial power distribution of a 5 × 5 annular fuel assembly is shown in Supplementary Figure S1 (included in the supplementary material). The fuel power in the radial direction is different. The centermost fuel has a power ratio of 1.4 and the 16 fuel rods in the outermost layer has a power ratio of 0.5, while the rest of the fuel rods has a power ratio of 1.0. The operating conditions and geometry parameters of the 5 × 5 annular fuel assembly are introduced in Supplementary Table S2 (included in the supplementary material). Under the same operating conditions, comparative result analyses about tight lattice effect are performed.
Tight-Lattice Effect on Pressure Drop
The predicted results of pressure drop without and with considering the tight-lattice effect are shown in Figure 7. It is apparent that the pressure drop calculated by the tight -lattice model is 20% lower than prediction results without tight-lattice effect. The results show that the tight-lattice effect lead to a lower pressure drop in the annular fuel assembly.
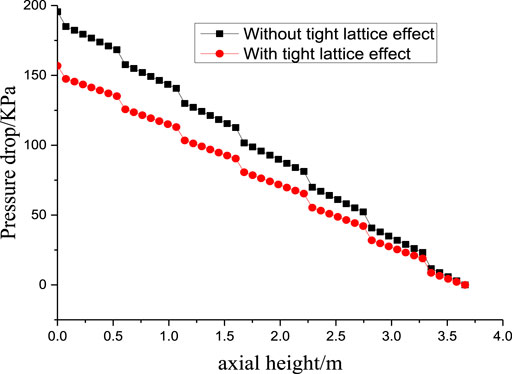
FIGURE 7. Pressure drop of 5 × 5 annular fuel assembly.
Tight-Lattice Effect on CHF
Figure 8 shows the MDNBR (the minimum departure from nucleate boiling ratio) results calculated without and with considering the tight-lattice effect. The MDNBR in the 5 × 5 annular fuel assembly with considering tight-lattice effect is about 0.6% lower than the prediction results without considering tight-lattice effect. The CHF value difference after axial height of 2.5 m is due to the flow quality correction in Eq. 11. When the flow quality is lower than -0.15, the tight-lattice correction Fx in Eq. 11 equals to 1, which means tight-lattice has no effect on CHF value. When flow quality is higher than -0.15 and lower than 0.36, the tight-lattice correction Fx becomes related to the flow quality, which results in difference values after axial height of 2.5 m in Figure 8.
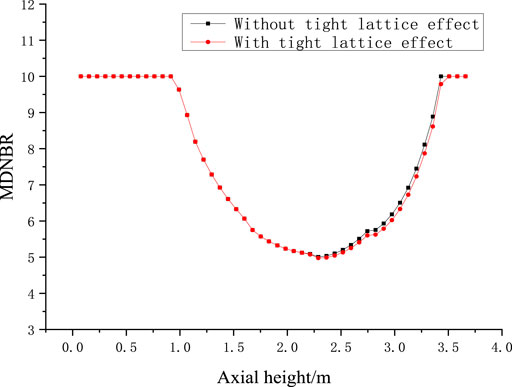
FIGURE 8. MDNBR of 5 × 5 annular fuel assembly.
Tight-Lattice Effect on Turbulent Mixing Rate
In order to evaluate the tight-lattice effect on the turbulent mixing rate, the outlet coolant temperature distribution of outer channels is calculated without and with considering the tight-lattice effect. The outlet coolant temperature distributions of outer channels before and after considering the tight-lattice effect are shown in Figures 9A,B. Turbulent mixing rate increases with the P/D ratio decreasing because tight-lattice structure could help produce greater lateral velocity and periodic flow fluctuations, which further results in more uniform temperature distribution.
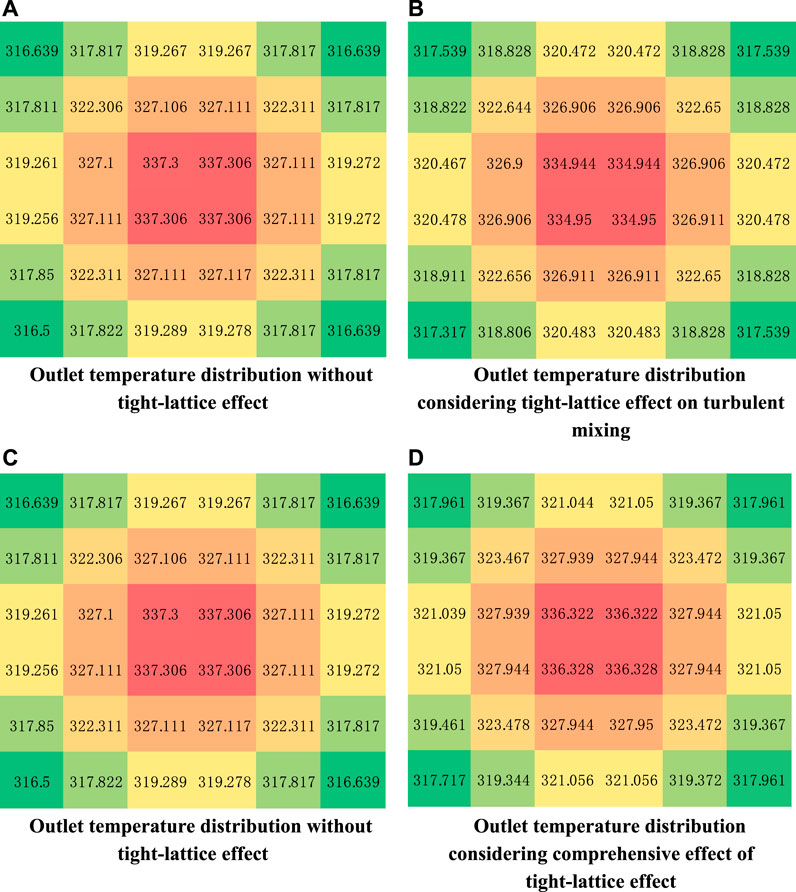
FIGURE 9. Outlet temperature distribution change before and after considering the tight lattice effect.
Comprehensive Effect of Tight Lattice Model
In this section, all the tight lattice models (including models for CHF, pressure drop and turbulent mixing) are taken into consideration, and the comprehensive effect of the tight-lattice structure on the thermal hydraulic analysis in annular fuel assembly is analyzed.
The comparison of MDNBR results without and with considering the tight-lattice effect are shown in Figure 10. The MDNBR obtained with correlation for P/D ratio of 1.08 is approximately 3.5% lower than the that calculated by correlation for P/D of 1.35. Figures 9C,D shows outlet temperature distribution difference without and with considering the tight-lattice effect. The temperature distribution calculated by the correlation for tight-lattice geometry is more uniform than that calculated by the correlation for normal fuel bundle geometry. From Figure 11, we can see that the inner and outer surface temperature distribution of annular rod 13 along the axial direction has very small change before and after considering the tight lattice effect due to very large heat transfer coefficient of single phase and nucleate boiling heat transfer mechanism.
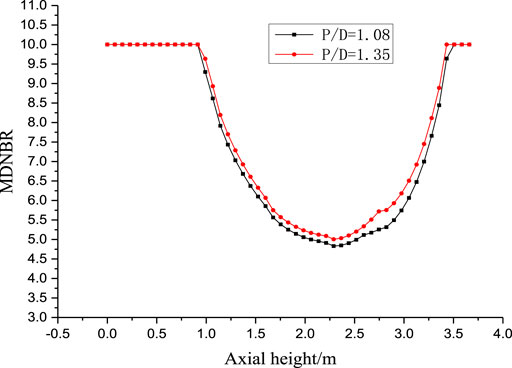
FIGURE 10. MDNBR of 5 × 5 annular fuel assembly.
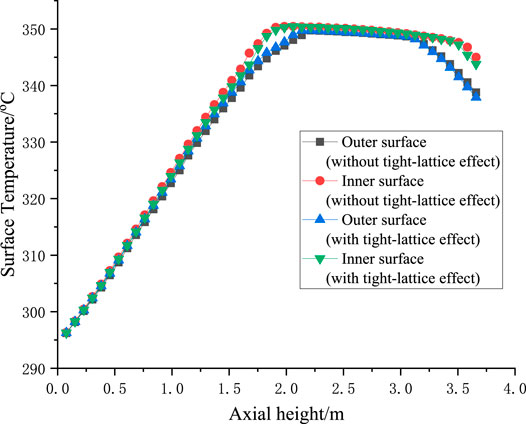
FIGURE 11. Inner and outer surface temperature distribution of rod 13 before and after considering the tight lattice effect.
Effect of Annular Fuel Burnup on Pellet Temperature Distribution
In this section, the effect of annular fuel burnup on the pellet radial temperature distribution is analyzed using the single annular fuel rod model which has been described in Code verification of NACAF as the analysis object. Figure 12 shows the radial temperature profiles of the annular fuel rod at the burnup of 0 GWD/MTU, 10 GWD/MTU, 20 GWD/MTU, 25 GWD/MTU and 30 GWD/MTU. The results show that the maximum temperature of the annular fuel pellet increases with the increase of fuel burnup due to the fact that the fuel thermal conductivity decreases with the increasing burnup. For burnup of 30 GWD/MTU, the maximum fuel temperature increased to 873.94°C, which is 35.56°C higher than maximum fuel temperature at burnup of 0 GWD/MTU.
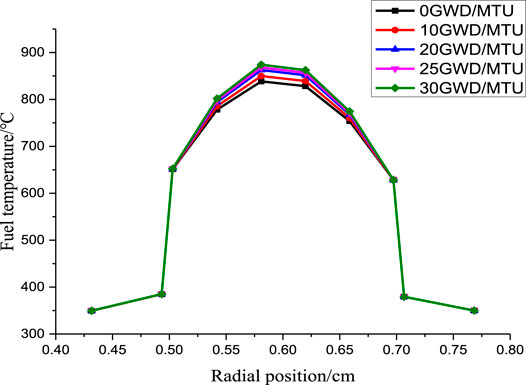
FIGURE 12. Fuel temperature at different burnup.
Annular Fuel Dimensional Changes
The annular fuel dimension will change due to swelling, densification and thermal expansion under continuous irradiation (Yuan and Kazimi, 2007). The deformation of the UO2 fuel pellet is larger than the Zr-4 cladding, which enlarge the inner gas gap and shrink the outer gas gap, as shown in Supplementary Figure S2 (included in the supplementary material). Gap width change of inner and outer gaps will further result in heat split change between the inner and outer surface and corresponding DNBR variations. It’s quite necessary to clarify the effects of gap change on the thermal hydraulic performance of annular fuel.
In this simulation, the swelling effect is assumed to expand the fuel pellet toward the outer surface. The swell ratio here is defined as the ratio of gap width change over the original gap width. 10% swell ratio means the displacement of the fuel pellet is 0.0085 mm (10%*0.085). The thermal hydraulic analyses for swell ratio over 10–60% are carried out.
Figure 13 shows the average heat flux variation of inner and outer cladding surface with the swelling ratio change. When the swelling ratio increase, the inner gap width increase and the outer gap width decrease, which result in higher thermal resistance for inner gap and lower thermal resistance for outer gap. The heat flux at the outer surface increase with the swelling ratio increase while the heat flux at the inner surface keep decreasing with the swelling ratio increase. Figures 14A,B shows the maximum and minimum cladding temperature variation with swelling ratio. The outer surface cladding temperature increases and the inner surface cladding temperature decreases with the swelling ratio increase.

FIGURE 13. Average heat flux of inner and outer channel with fuel pellet displacement variation.
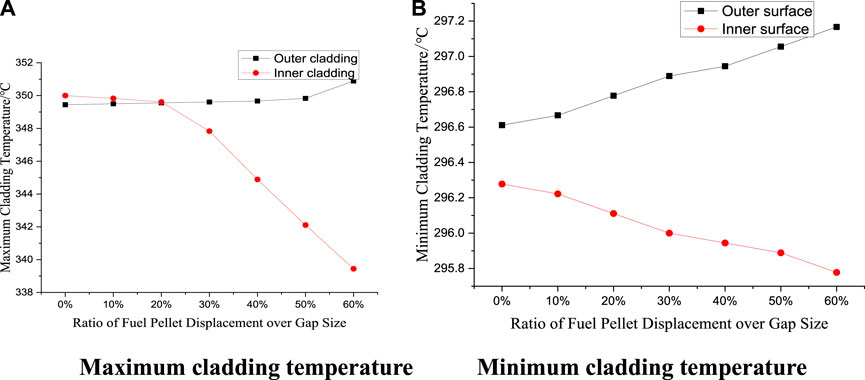
FIGURE 14. Maximum and minimum cladding temperature of inner and outer channel fuel pellet displacement variation.
Figure 15 shows the radial temperature distribution for different swelling ratio. Under large swelling ratio conditions, the location of peak temperature in the radial direction moves toward the inner side. The outer cladding temperature increases and the inner cladding temperature decreases with the swelling ratio increase, which results in the situation that outer cladding temperature is slightly higher than inner cladding temperature at large swelling ratio. The peak fuel temperature decreases during the swelling process.
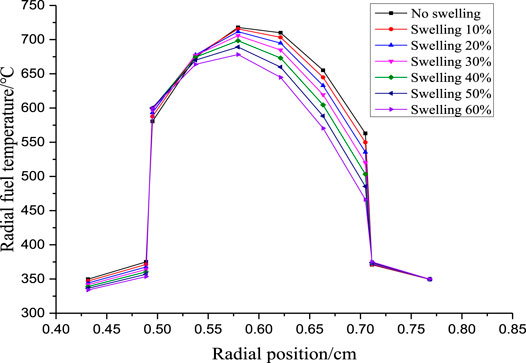
FIGURE 15. Radial fuel temperature distribution with fuel pellet displacement variation.
Figure 16 shows the DNBR variation for the inner and outer coolant channel along with the axial height. As indicated in Figure 13, the outer surface heat flux increases and the inner surface heat flux decreases with the swelling ratio increase. This phenomenon results in the DNBR increase for inner coolant channel and DNBR decrease for outer coolant channel. The MDNBR at outer surface will become lower than 1.3 when swelling ratio is over 20%. When swelling ratio increases to 40%, the MDNBR will stay lower than 1, which indicates that CHF happens at the outer surface and the outer surface temperature has the risk of sudden increase. It can be seen that swelling deteriorates the safety performance of annular fuel. In the geometry design of annular fuel, it’s better to leave more space for the outer gap or add some materials with big thermal resistance in the outer gap, to avoid the MDNBR decrease in the outer channel during swelling.
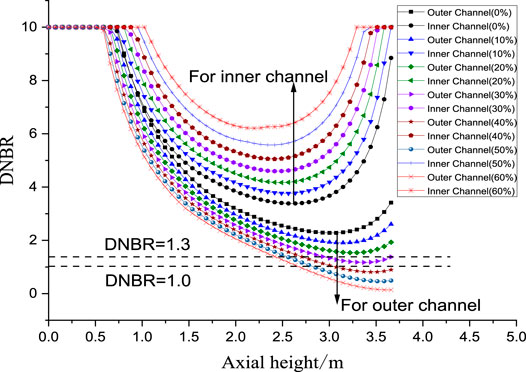
FIGURE 16. Inner and outer channel DNBR variation at different swelling ratios.
Partial Blockage of Inner and Outer Channel
The effect of partial blockage of inner or outer channel on thermal hydraulic performance of annular fuel is carried out using NACAF. The blockage happens at the inlet of fuel bundle, which result in coolant flow area reduction. The fuel cladding temperature, DNBR, flow and heat split between inner and outer channels under partial blockage conditions at different extent (10, 20, 30, 50, 70 and 80%) are analyzed.
Supplementary Table S5 (included in supplementary material) summaries the flowrate, heat flux and maximum cladding temperature change of inner and outer surface in different blockage situations. The flow distribution between inner and outer channel is very sensitive to blockage area. Higher blockage area in the channel results in larger flowrate decrease. The inner channel blockage has larger impact on flow distribution than the outer channel blockage. 80% blockage in the inner channel results in 40% flowrate decrease for inner channel while 80% blockage in the outer channel results in around 20% flowrate decrease for the outer channel. The heat flux distribution, the maximum cladding temperature is not quite sensitive to the blockage area. For the case of large blockage ratio, the heat flux at both cladding surface has a 1% change and the maximum cladding temperature has a 1°C change. This is mainly due to the fact that the decrease of coolant flowrate make the coolant in the channel work in the nucleated boiling heat transfer region, which has a larger heat transfer coefficient than the subcooled boiling or single phase heat transfer mechanism.
Figures 17A,B shows the inner and outer cladding temperature variation with inner channel blockage ratio change. It’s obviously that decreasing flowrate in the inner channel will result in earlier onset of nucleate boiling in the inner channel, as indicated in Figure 17A. But the maximum cladding temperature of the inner surface doesn’t change due to higher heat transfer effectiveness in the nucleated boiling region. The flowrate increase in outer channel makes the onset of nucleate boiling happens at a higher elevation and has little effects on the outer surface cladding temperature. Same trend is found for cladding temperature change in case of outer channel blockage, as shown in Figures 17C,D. Blockage in the outer channel will not increase the cladding temperature and it’s helpful to low down the inner cladding temperature when the outer channel blockage ratio is around 80%.
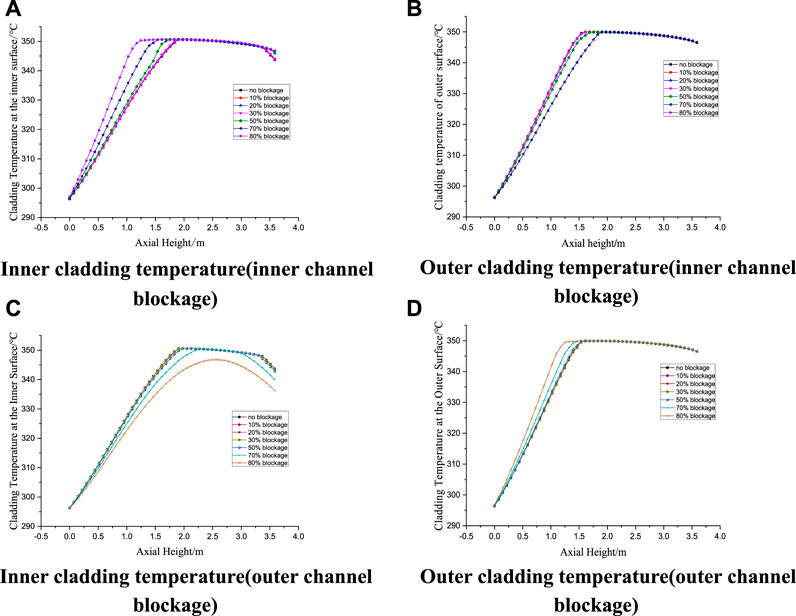
FIGURE 17. Cladding temperature variation with axial height under different inner and outer channel blockage ratio.
Figure 18 shows the MDNBR variation with axial height change. Blockage in flow channel lowers down its coolant flowrate and increase the coolant flowrate in other channels. MDNBR decrease with the increase of the blockage ratio due to lower flowrate and higher void fraction at elevation around 2.7 m. For the same blockage ratio, partial blockage of the inner channel will cause more DNBR drop compared to the situation of outer channel blockage, which means that blockage in the inner channel is more threatening. However, 80% blockage in the inner channel make the MDNBR slightly lower than 1.3.
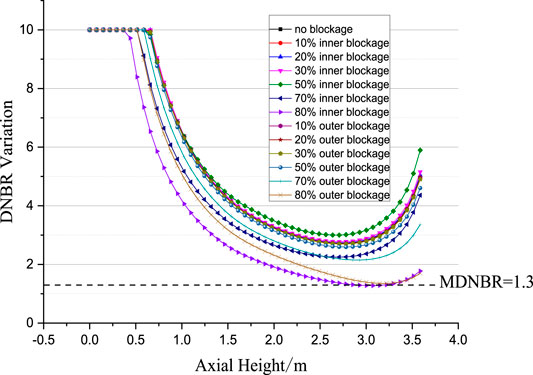
FIGURE 18. MDNBR variation along with axial height under different blockage.
From the above analysis, we can find that blockage in the inner and outer channel will not bring a big change in cladding temperature of annular fuel. However, the flowrate decrease in the flow channel will result in void fraction increase and CHF decrease, which makes the annular fuel has a DNB risk. Through our calculation, we can found that 80% channel blockage in inner channel or outer channel will decrease the MDNBR of annular fuel from 3 to 1.3. Larger blockage over 80% will threaten the safety of annular fuel.
Conclusion
A thermal-hydraulic sub-channel analysis code for annular fuel, NACAF, is developed regarding the effects of tight-lattice on the prediction of critical heat flux, pressure drop and turbulent mixing coefficient, the effects of fuel burnup on the fuel conductivity, the channel blockage model. NACAF is verified through analytic solution comparison and code-to-code comparison with VIPRE-01 and TAFIX for annular fuel. The prediction of radial temperature distribution, heat flux split for inner and outer surface, flow split for inner and outer channel, and the DNBR value are coincident with the prediction results using VIPRE-01 and TAFIX. The relative prediction errors are acceptable and demonstrate that NACAF is able to be preliminarily used for thermal hydraulic analysis for annular fuel. Special thermal hydraulic phenomena is analyzed for a 5*5 annular fuel assembly, including the effects of tight-lattice geometry, the fuel burnup change, fuel dimensional change and the partial channel blockage. Conclusions can be achieved as follows:
1) The MDNBR in annular fuel assembly after considering tight-lattice effect is approximately 3.5% lower than that without considering tight-lattice effect. The tight-lattice structure like annular fuel assembly can reduce the total pressure by about 20% compared to the results of cylindrical solid fuel assembly. The turbulent mixing rate increases with the decrease of P/D ratio, due to the fact that a greater lateral velocity and periodic flow fluctuations exists in the tight-lattice structure.
2) The thermal conductivity in the fuel decreases with fuel burnup increase, which leads to the fuel pellet temperature increase. Maximum fuel temperature in the radial direction increases with the fuel burnup increase. For 30 GWD/MTU, the maximum fuel temperature increased to 873.94, 35.56°C larger than that at 0 GWD/MTU. The maximum fuel temperature at 30 GWD/MTU is still far below the fuel temperature limit.
3) The displacement of the fuel pellet will increase the inner gap width and decrease the outer gap width. The thermal hydraulic analysis under fuel pellet displacement equals to 10–60% of the standard gap size are carried out. MDNBR of inner surface increases with the increase of displacement due to the fact that less heat is distributed to the inner surface. MDNBR value of outer surface decreases with fuel displacement increase. MDNBR at outer surface becomes lower than 1.3 when the fuel pellet displacement is over 20% of the standard gap size, which indicates that the MDNBR value is very sensitive to the gap size. When displacement is over 30% of the standard gap size, MDNBR becomes lower than 1, which indicates that CHF happens at the outer surface and the outer surface temperature has the risk of sudden increase. In the geometry design of annular fuel, it’s better to leave more space for the outer gap or add some materials with large thermal resistance in the outer gap, to avoid MDNBR decrease in the outer channel when swelling happens.
4) Thermal hydraulic analyses of annular fuel assembly are carried out under different partial blockage ratio over 10–80% at inner and outer channel. Blockage happened in the inner channel results in larger MDNBR drop than the conditions when blockage is in the outer channel. When inner channel has a partial blockage of 80%, it has a MDNBR slightly lower than 1.3, which is close to the safety limit. Larger blockage over 80% will threaten the safety of annular fuel.
Data Availability Statement
The original contributions presented in the study are included in the article/Supplementary Material, further inquiries can be directed to the corresponding authors.
Author Contributions
PW: Conceptualization, Writing - Original Draft, Writing- Reviewing and Editing, Investigation, Supervision LZ: Visualization, Formal analysis, Investigation, Writing - Original Draft JS: Resources, Writing- Reviewing and Editing, Supervision BZ: Resources, Writing- Reviewing and Editing.
Conflict of Interest
The authors declare that the research was conducted in the absence of any commercial or financial relationships that could be construed as a potential conflict of interest.
Publisher’s Note
All claims expressed in this article are solely those of the authors and do not necessarily represent those of their affiliated organizations, or those of the publisher, the editors and the reviewers. Any product that may be evaluated in this article, or claim that may be made by its manufacturer, is not guaranteed or endorsed by the publisher.
Acknowledgments
The authors would like to express their special thanks for the financial support from China Institute of Atomic Energy.
Supplementary Material
The Supplementary Material for this article can be found online at: https://www.frontiersin.org/articles/10.3389/fenrg.2021.696331/full#supplementary-material
References
Castellana, F. S., Adams, W. T., and Casterline, J. E. (1974). Single-Phase Subchannel Mixing in a Simulated Nuclear Fuel Assembly. Nucl. Eng. Des. 26, 242–249. doi:10.1016/0029-5493(74)90059-4
Diao, J., and Ji, S. (2015). Development and Verification of Thermal-Hydraulic Analysis Code for Annular Fuel. At. Energ. Sci. Technology. 6 (49), 1051–1056. doi:10.7538/yzk.2015.49.06.1051
Elger, D. F., LeBret, B. A., and Crowe, C. T. (2016). Engineering Fluid Mechanics. Hoboken (NJ): Wiley.
Esmaili, H., Kazeminejad, H., Khalafi, H., and Mirvakili, S. M. (2020). Subchannel Analysis of Annular Fuel Assembly Using the Preconditioned Jacobian-Free Newton Krylov Methods. Ann. Nucl. Energ. 146, 107616. doi:10.1016/j.anucene.2020.107616
Esmaili, H., Kazeminejad, H., and Khalafi, H. (2019). Prediction of Temperature Distribution in Annular Fuels Using Orthogonal Collocation Method. Ann. Nucl. Energ. 134, 77–87. doi:10.1016/j.anucene.2019.06.015
Feng, D. (2005). Innovative Fuel Designs for High Power Density Pressurized Water Reactor[D]. Cambridge: Massachusetts Institute of Technology.
Feng, D., Hejzlar, P., and Kazimi, M. S. (2007). Thermal-Hydraulic Design of High-Power-Density Annular Fuel in PWRs. Nucl. Technology 160 (1), 16–44. doi:10.13182/nt07-a3882
Galbraith, K. P., and Knudsen, J. G. (1972). Turbulent Mixing Between Adjacent Channels for Single-Phase Flow in a Simulated Rod Bundle. Oregon State University. Corvallis: 12th National Heat Transfer Conference. 118, 90–100.
Groeneveld, D. C., Joober, K., and Doerffer, S. (1992). The Effect of Fuel Subchannel Geometry on CHF, Proc. 5th Int. Topical Meeting on Nuclear Reactor Thermal Hydraulics. Salt Lake City: NURETH-5), 683–690.
Hagrman, D. L. (1979). Fuel Thermal Conductivity (FTHCON). Status Report[R]. Report No: EY-76-C-07-1570 Idaho. doi:10.2172/6414165
Han, K.-H., Seo, K.-W., Hwang, D.-H., and Chang, S. H. (2006). Development of a Thermal Hydraulic Analysis Code for Gas-Cooled Reactors with Annular Fuels. Nucl. Eng. Des. 236 (2), 164–178. doi:10.1016/j.nucengdes.2005.07.006
Han, K. H., and Chang, S. H. (2003). Development of a Thermal-Hydraulic Analysis Code for Annular Fuel Assemblies. Nucl. Eng. Des. 226 (3), 267–275. doi:10.1016/s0029-5493(03)00208-5
Kazimi, M. S., and Hejzlar, P. (2006). High Performance Fuel Design for Next Generation PWRs[R]. Cambridge: MIT, MIT-NFC-PR-082.
Kwon, H., and Kim, S. (2019). Preliminary Thermal Hydraulic Design of SMR Core with 13 X 13 Annular Fuel Assemblies. Jeju, Korea: Transactions of the Korean Nuclear Society Spring Meeting.
Lee, C. Y., Shin, C. H., and In, W. K. (2012). Pressure Drop in Dual-Cooled Annular and Cylindrical Solid Fuel Assemblies for Pressurized Water Reactor. Nucl. Eng. Des. 250, 287–293. doi:10.1016/j.nucengdes.2012.05.039
Lee, C. Y., Shin, C. H., Park, J. Y., and In, W. K. (2013). An Experimental Investigation on Turbulent Flow Mixing in a Simulated 3×3 Dual-Cooled Annular Fuel Bundle Using Particle Image Velocimetry. Nucl. Eng. Des. 260, 134–144. doi:10.1016/j.nucengdes.2013.03.013
Nava Dominguez, A., Rao, Y. F., and Beuthe, T. (2020). Advances of the AC-DC Code, a Coupled Computational Tool to Perform Thermalhydraulic Modeling of Fuel Bundles with Annular Fuel Elements. Nucl. Eng. Des. 356, 110360. doi:10.1016/j.nucengdes.2019.110360
Rehme, K. (1972). Pressure Drop Performance of Rod Bundles in Hexagonal Arrangements. Int. J. Heat Mass Transfer. 15 (12), 2499–2517. doi:10.1016/0017-9310(72)90143-3
Rowinski, M. K., White, T. J., and Zhao, J. (2015). Innovative Model of Annular Fuel Design for Lead-Cooled Fast Reactors. Prog. Nucl. Energ. 83, 270–282. doi:10.1016/j.pnucene.2015.04.002
Shan, J. Q., Liao, C. K., and Gou, J. L. (2017). Numerical Analysis Method for Transient Safety of Pressurized Nuclear Power plant[B]. Xi’an: Xi’an Jiaotong University Press.
Shin, C.-H., Chun, T.-H., Oh, D.-S., and In, W.-K. (2012). Thermal Hydraulic Performance Assessment of Dual-Cooled Annular Nuclear Fuel for OPR-1000. Nucl. Eng. Des. 243, 291–300. doi:10.1016/j.nucengdes.2011.12.010
Wu, J., and Oka, Y. (2015). Subchannel Analysis With Turbulent Mixing Rate of Supercritical Pressure Fluid. Nucl. Eng. Des. 287, 119–130. doi:10.1016/j.nucengdes.2015.02.014
Xia, H., Lu, C., Wu, Y., Wu, Z., Tian, W., Su, G. H., et al. (2019). Development of a Subchannel Analysis Code and its Application to Annular Fuel Assemblies. Ann. Nucl. Energ. 129, 428–436. doi:10.1016/j.anucene.2019.02.016
Yang, Y. S., Shin, C. H., Chun, T. H., and Song, K. W. (2009). Evaluation of a Dual-Cooled Annular Fuel Heat Split and Temperature Distribution. J. Nucl. Sci. Technology 46 (8), 836–845. doi:10.1080/18811248.2007.9711593
Yilmaz, M. O., Avramova, M. N., and Andersen, J. G. M. (2016). Development, Verification, and Validation of a Fuel thermal Conductivity Degradation Model in CTF. Ann. Nucl. Energ. 97, 246–261. doi:10.1016/j.anucene.2016.07.020
Yuan, Y., Kazimi, M. S., and Hejzlar, P. (2007). Thermomechanical Performance of High-Power-Density Annular Fuel. Nucl. Technology 160 (1), 135–149. doi:10.13182/nt07-a3888
Zhu, Y. (2012). Study on Thermal-Hydraulic Characteristics of Water-Cooled Reactor with Annular Fuel. Master Degree: Xi'an Jiaotong University.
Nomenclature
r radius of the fuel, m
D the diameter of the fuel rod, m
T the fuel temperature, °C
P the porosity fraction in the fuel
BU the fuel burnup, MWD/TU
q the heat generation rate, W/m3
ε the blockage ratio
Subscript/Superscript
V coolant velocity on the boundary, m/s control volume
F surface of fluid
W wall
S surface of control volume
min the minimum value
f the wall friction coefficient fuel
i channel number inner channel
o outer channel
f1 fluid in inner channel
f2 fluid in inner channel
Keywords: annular fuel, thermal-hydraulics, tight-lattice fuel assembly, sub-channel analysis code, fuel burnup
Citation: Wu P, Zhang L, Shan J and Zhang B (2021) Researches on Special Thermal Hydraulic Phenomena of Annular Fuel Assembly by Sub-Channel Analysis Code-NACAF. Front. Energy Res. 9:696331. doi: 10.3389/fenrg.2021.696331
Received: 16 April 2021; Accepted: 22 July 2021;
Published: 13 August 2021.
Edited by:
Shoaib Usman, Missouri University of Science and Technology, United StatesReviewed by:
Hussein Togun, Thi Qar University, IraqJiankai Yu, Massachusetts Institute of Technology, United States
Jinbiao Xiong, Shanghai Jiao Tong University, China
Copyright © 2021 Wu, Zhang, Shan and Zhang. This is an open-access article distributed under the terms of the Creative Commons Attribution License (CC BY). The use, distribution or reproduction in other forums is permitted, provided the original author(s) and the copyright owner(s) are credited and that the original publication in this journal is cited, in accordance with accepted academic practice. No use, distribution or reproduction is permitted which does not comply with these terms.
*Correspondence: Pan Wu, d3VwYW4yMDE1QHhqdHUuZWR1LmNu; Jianqiang Shan, anFzaGFuQHhqdHUuZWR1LmNu