 L. W. He
 Y. X. Li
 Y. Zhou2
- 1School of Mechanical Engineering, Shanghai Jiao Tong University, Shanghai, China
- 2Shanghai Nuclear Engineering Research and Design Institute Co., Ltd, Shanghai, China
During a nuclear power plant severe accident, discharging gas mixture into the spent-fuel pool is an alternative containment depressurization measurement through which radioactive aerosols can be scrubbed. However, it is necessary to develop a code for analyzing the decontamination factor of aerosol pool scrubbing. This article has established the analysis model considering key aerosol pool scrubbing mechanisms and introduced the Akita bubble size relationship. In addition, a code for evaluating the decontamination factor of aerosol pool scrubbing was established. The Advanced Containment Experiment and Light Water Reactor Advanced Containment Experiment were simulated with the code considering different bubble sizes of the Akita model and MELCOR default value to verify the suitability of the Akita bubble size model for simulating aerosol pool scrubbing. Furthermore, the simulation results were compared with the results analyzed by MELCOR code and COCOSYS code from literature, and equivalent predictive ability was observed. In addition, a sensitivity analysis on bubble size was conducted, and the contribution of different behaviors and mechanisms has been discussed. Finally, the bubble breakup equation was revised and verified with the conditions of the multi-hole bubbler in the Advanced Containment Experiment and Light Water Reactor Advanced Containment Experiment.
Introduction
Aerosol pool scrubbing is a specific phenomenon wherein aerosol particles carried by mixing gas are transported into the pool; thereafter, the gas condenses and cools, depositing the aerosol particles in the pool. This typical phenomenon may occur in a suppression pool of boiling water reactor (BWR), steam generator of pressurized water reactor, and spent-fuel pool of a new type reactor designed in China (Li and Cao, 2015; Rýdl et al., 2016; Gao et al., 2017). This process can substantially reduce the risk of containment failure and decrease the quantity of radioactive release (Jo et al., 2016; Kanai et al., 2016; Dong and Yang, 2019). Aerosol pool scrubbing and its characteristics are of vital importance during the evaluation of radioactive source term in severe accidents. Typically, the decontamination factor (DF) is considered a significant parameter for evaluating the removal of radioactive substances during this process (Powers and Sprung, 1993; Berzal et al., 1995).
In the 1980s, many international programs for experimental investigation on aerosol pool scrubbing were conducted, including the Advanced Containment Experiment (ACE) and the Electric Power Research Institute (EPRI) experimental program conducted by EPRI, investigation of basic pool scrubbing mechanism carried out by Japan Atomic Energy Research Institute on Experimental Facility for Pool Scrubbing Investigation, and Pool Scrubbing Effect on Iodine Decontamination tests sponsored by the Paul Scherrer Institute in Switzerland, concentrating on the influences of the diameter of aerosol particles, gas characteristics, injection device, and pool thermal-hydraulics on pool scrubbing (Berzal et al., 1995). Based on these, theoretical investigations have been preliminarily progressed, with three main analytical models, namely, SUPRA (Wassel et al., 1985), BUSCA (Ramsdale et al., 1995), and SPARC, developed to deal with the aerosol pool scrubbing issues. The SPARC model was introduced in the CONTAIN code to analyze the suppression pool scrubbing by Sandia National Laboratory (Washington et al., 1991). In addition, an updated version of the SPARC model (SPARC-90) (Owczarski and Burk, 1991) was employed as a pool scrubbing module in a lumped-parameter code, called MELCOR. Moreover, certain improvements have been considered in the SPARC-B/98 model and this model was successfully adopted in the COCOSYS code developed by Gesellschaft für Anlagen-und Reaktorsicherheit. However, detailed information regarding the analytical model and numerical schemes of SPARC-B/98 are unavailable to the public (Gao et al., 2017). Furthermore, there still exists a large difference between calculations (for all the mentioned above models) and experimental data of DF.
Aerosol pool scrubbing was first applied in BWR for a new type reactor designed in China with a spent-fuel pool as an alternative measure for containment depressurization; however, the effectiveness of aerosol pool removal has yet to be verified and evaluated (Li et al., 2021). Therefore, experimental research and model improvement are being conducted in China. In this paper, as the first step, an analytical model framework has been proposed and thereafter verified with the data of various international experiments.
Through extensive literature research, the classic aerosol pool scrubbing correlations, which are verified and suitable for systematic analysis code, were selected. The key mechanism of aerosol pool scrubbing, aerosol characteristics, and bubble characteristics were considered. In particular, for the bubble size, the empirical relationship of Akita bubble size that considers the surface tension of the liquid, viscosity, and injection air velocity was introduced, which is classic, verified, and suitable for systematic analysis code. Thus, based on these models, first, the analysis model of aerosol pool scrubbing was built. Thereafter, validations against public experimental data from ACE and LACE have been presented, and sensitivity analysis on bubble size was conducted. Furthermore, the contributions of different behaviors and mechanisms have been discussed. Finally, the bubble breakup equation was revised and verified with ACE and LACE experiments.
Aerosol Pool Scrubbing Model
Aerosol pool scrubbing is characterized as a complex process wherein radioactive aerosols are transported into a water pool, carried by steam or non-condensable gas, and then deposited within the pool with the discharge of the carrying gas. Many thermal-hydraulic phenomena are involved, including the interaction of aerosol particles captured by the water phase and bubble collapse and rise, which lead to heat and mass transfer on the gas–liquid interface. Typically, it can be divided into two overlapped zones, namely, the injection zone (at the bottom) and bubble rise zone (at the top) along the vertical direction of the water pool, in the light of different flow regimes and characteristics (Berzal et al., 1995; Owczarski and Burk, 1991), as shown in Figure 1.
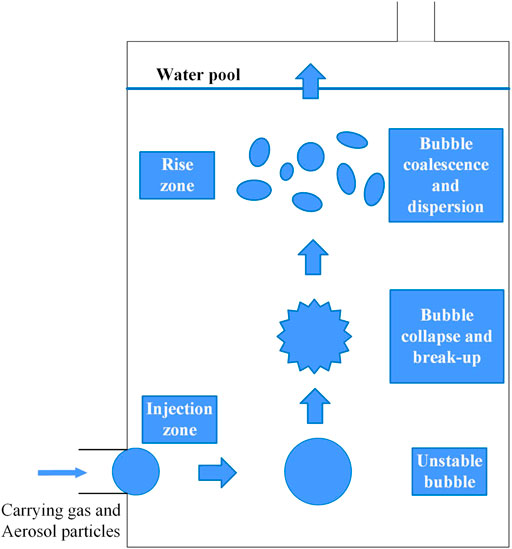
FIGURE 1. Schematic diagram of pool scrubbing process.
The
The weighted
where
Injection Zone
It is assumed that thermal balance can be instantaneously ensured (Owczarski and Burk, 1991) when aerosol particles with carrying gas are injected into the water pool; thus, heat and mass transfer and particle diffusion driven by thermophoresis can be neglected. Steam condensation, inertial impaction, and gravitational, centrifugal, and diffusional deposition are the dominant mechanisms that determine DF within the injection zone.
Aerosol particles can be driven to the gas–liquid interface by the steam concentration gradient and are subsequently captured. When steam condensation occurs, the steam condensation decontamination factor (DFCD) can be expressed as follows (Berzal et al., 1995):
where
Inertial impaction can probably happen when bubbles form at the exit of the injection device and decelerate due to the resistance from the water. However, aerosol particles may continue to move on and be captured on the gas–liquid interface due to the inertial force. The inertial impaction decontamination factor
where
For the bubbler with multi-holes, the effects of gravitational, centrifugal, and diffusional deposition on the removal of aerosols are additionally introduced in the formation and separation stages of the bubble ball in the injection zone. The relevant decontamination factor is calculated as follows (Berzal et al., 1995):
where
Bubble Rising Zone
Simulations were conducted in the rise zone, considering the effects of gravitational deposition, centrifugal capture, Brownian diffusion, particle migration, and deposition caused by bubble breakup and resistance due to the steam flow at the gas–liquid interface. The cumulative decontamination factor of the aerosols with different particle sizes in the bubble rising region,
where n denotes the number of space intervals,
Gravitational deposition refers to the deposition of aerosol particles in the bubble due to their own gravity, which typically has a significant effect on particles with a diameter greater than 1 μm. Due to the small size and low velocity of the aerosol particles, most of their motions are in the low Reynolds number (Re) range (William et al., 1989), and thus applying Stokes law and introducing the Cunningham slip coefficient, the final free deposition velocity of the particles with smaller size can be obtained, as in Eq. 17. For particles with an aerodynamic diameter greater than 70 μm, Stokes law is no longer applicable (Berzal et al., 1995). Based on the balance between the resistance acting on the particles and the gravity, the relationship between
where
When the bubble rises in the pool, there is a relative movement with the surrounding liquid, and the viscous shear effect of the liquid makes the surface and inside of the bubble rotate continuously. Consequently, the aerosol particles in the bubble are captured by the centrifugal force moving to the bubble interface, and the centrifugal capture velocity can be expressed as follows (Gauntt et al., 2000):
where
Based on the permeation theory of the mass transfer process, and considering the influence of vapor flow at bubble interface during the bubble rising process, the correction factor
where
Further, considering the aerosol particle capture during bubble breakup,
where
The particle size of soluble aerosols increases remarkably due to the steam condensation on the surface when the steam partial pressure in the bubble is greater than that on the surface of the aerosol particle, thus influencing pool scrubbing. The size change rate can be obtained from the modified Mason equations (Knudsen, 1970; Jokiniemi, 1990; Owczarski and Burk, 1991), as shown in the following:
where r refers to the radius of the aerosol particle,
Bubble size is also an important factor that affects the efficiency of aerosol pool scrubbing. In the existing simulations, a specified equivalent sphere diameter has often been used to represent the average size of the entire stable bubble group, such as the MELCOR code. Based on experimental data and dimensional analysis, Akita and Yoshida (1974) have proposed the bubble average size prediction relationship, which indicates that the bubble size in the rise zone is controlled by the balance between coalescence and rupture rate of the bubble.
where
Aerosol Pool Scrubbing Simulation Code Algorithm
The aerosol pool scrubbing calculation process involves calculations and repeated calls of gas–liquid physical parameters and bubble hydrodynamic parameters, among others. Moreover, a coupling relationship exists between the thermal-hydraulic model and the aerosol removal mechanism, and the spatial discrete iterative calculation of the rise zone is required. The overall calculation was implemented using the FORTRAN language and the calculation process is shown in Figure 2.

FIGURE 2. Flowcharts for aerosol pool scrubbing simulation.
The input parameters required for the pool scrubbing calculation are detailed in Table 1, which primarily consist of parameters related to the aerosol particle, injection gas, pool, and gas injection device. Moreover, the calculation control parameters were required to be set, such as the number of space steps. The output primarily included the particle size distribution of the aerosol, finally leaving the pool and the aerosol washing purification coefficients DFi and DFo.
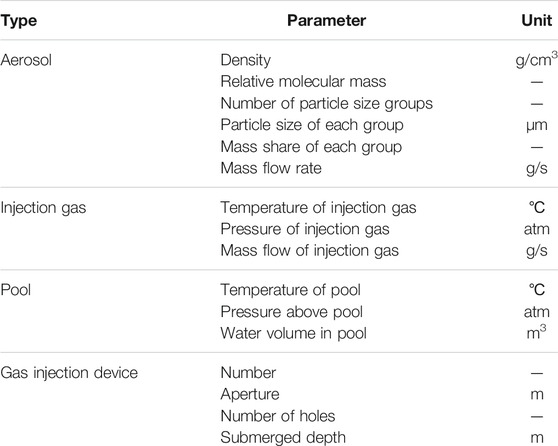
TABLE 1. Main input parameters.
Experimental Verification
Validations With ACE Tests
ACE tests are managed by EPRI (Ramsdale et al., 1992; Humphries et al., 2015). They consist of four typical cases focusing on pool scrubbing (AA1∼AA4) to figure out the retention characteristics of aerosol particles with carrying gas discharged by bubbler with multi-holes and provide basic support for code validations. The filtered test vessel was approximately 6.1 m in height and 1.524 m in diameter, with a cylindrical bubbler installed in the bottom. There were 51 little holes with a diameter of 9.525 mm on the upper surface of the bubbler, from which the aerosols came into the water pool with carrying gas. The water depth could be varied.
Soluble aerosols of CsI and CsOH and insoluble aerosol of MnO were selected on behalf of radioactive aerosols generated during severe accidents, with size distribution in accordance with lognormal distribution, as shown in Table 2, where AMMD refers to the aerodynamic median mass diameter and GSD is the geometric standard deviation. Aerosol size distribution was measured by cascade impactors from two different sampling stations for each condition to reduce the effects of uncertainty in experimental measurements (Ramsdale et al., 1992). The detailed experimental conditions, including aerosol mass flow rate, water depth above the bubbler, pool temperature, carrying gas mass flow rate, temperature, pressure, and steam fraction, are listed in Table 2. The temperature was measured by thermocouples, the pressure was measured by pressure transducers, and the submerged depth of the bubbler was measured by liquid level sensor, flow rates of steam, noncondensable gas, manganese, cesium, and other vapors used to produce aerosols were measured by sharp-edged orifice meter, turbine meter, and rotameter (Ramsdale et al., 1992; Berzal et al., 1995). The primary differences among the conditions from AA1 to AA4 include steam fraction, pool temperature, water depth above the bubbler, and aerosol properties (soluble, insoluble).
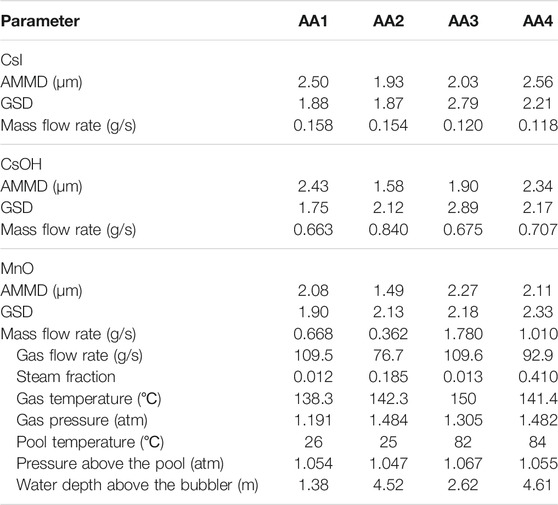
TABLE 2. Main parameters of ACE test conditions.
Herein, underestimation factor (UF) (Humphries et al., 2015), an important parameter, was introduced to represent the deviation of the simulated results from the experimental results, as shown in the following:
where
The experimental results of DF for AA1∼AA4, compared to calculation results are presented in Table 3. The DFs range in the ACE experiment was determined by two methods: mass balance and aerosol concentration measurement to reduce the uncertainty of measurements (Ramsdale et al., 1992; Berzal et al., 1995). DF-A is the simulation result using the Akita bubble size relationship and DF-M represents the result calculated based on the MELCOR default bubble diameter value of 0.7 cm. The value of overall UF for DF-M was approximately 24.41, which implies that significant underestimation may appear when using this method. According to the conditions of AA1∼AA4, the bubble diameter of each working condition calculated using the Akita relationship ranges from 0.268 to 0.378 cm, which is obviously less than 0.7 cm. Further, the overall UF for DF-A was determined as 8.82, which illustrates that the deviation between simulation and experimental results is within the acceptable range. Furthermore, for the three sets of aerosol particles, the predictions of DF of insoluble aerosol (MnO) were better than those of soluble aerosols of CsI, CsOH.
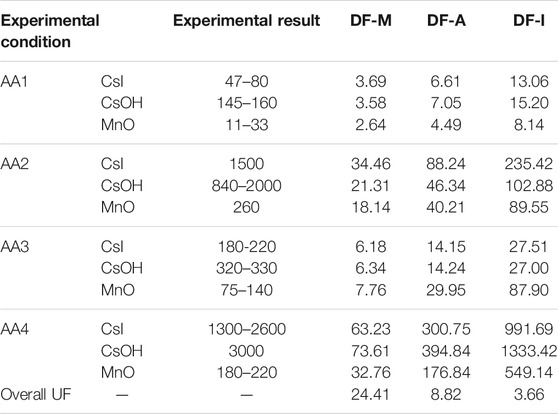
TABLE 3. DF comparisons between calculation results and experimental data of ACE test conditions.
Figure 3 shows the comparison between the simulated results of the code proposed in this article, MELCOR code (Humphries et al., 2015), COCOSYS code (Gao et al., 2017), and ACE experimental result. The diagonal line in the figure indicates that the calculated value of DF is exactly equal to the experimental value. Whereas the data point above this line indicates that the calculated DF is low, the data point below the diagonal line indicates that the DF is overestimated. It is evident from the figure that for the ACE experimental pool scrubbing conditions with multi-hole bubblers and high-speed airflow, the calculated DF exhibits an underestimation trend. The overall UF values of the ACE experimental simulation using the code established in this paper, MELCOR code (Humphries et al., 2015), and COCOSYS code (Gao et al., 2017) are 8.82, 10.53, and 34.38, respectively. The code proposed in this article has an equivalent predictive ability when compared with the MELCOR and COCOSYS codes.
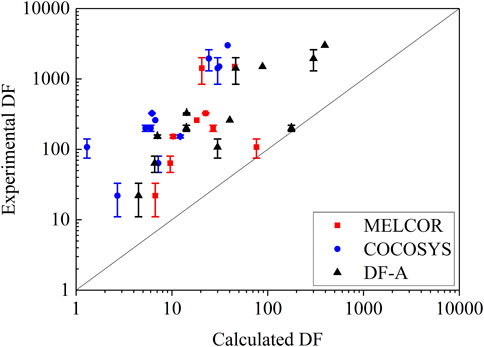
FIGURE 3. Different calculated DF comparisons between ACE test conditions.
Validations With LACE Tests
The LACE-Espana project (Marcos et al., 1994) was initiated in 1987. The Spanish Environmental Energy Technology Research Center conducted pool scrubbing experiments to study the detention effect of aerosol in the suppression pool under severe accidents. The experimental equipment primarily includes an aerosol generation system, mixing section, gas injection pipeline, pool container, and aerosol measurement and data acquisition control system. The height and diameter of the pool container are 5 and 1.5 m, respectively, and the volume of the pool is 5 m3. Further, the gas device is a single-hole horizontal pipe with a diameter of 1 cm, and its submerged depth is 2.5 m.
The experiment used a typical soluble aerosol CsI with a density of 4.5 g/cm3. The carrier gas was a mixture of non-condensable gas nitrogen and steam, and the temperature was approximately 150°C. The pool temperature was maintained at approximately 110°C, and the absolute pressure above the pool was 3 atm. The detailed parameters of the three groups of calculation conditions are shown in Table 4. The accuracies of measurement in the LACE experiment are particle size distribution (3%), nitrogen gas flow rate (2%), steam flow rate (2%), temperature (1°C), and pressure (5%) (Marcos et al., 1994). The experimental design focused on the impact of aerosol particle size, vapor fraction, and other key factors on DF and the primary difference among the conditions was the steam fraction.
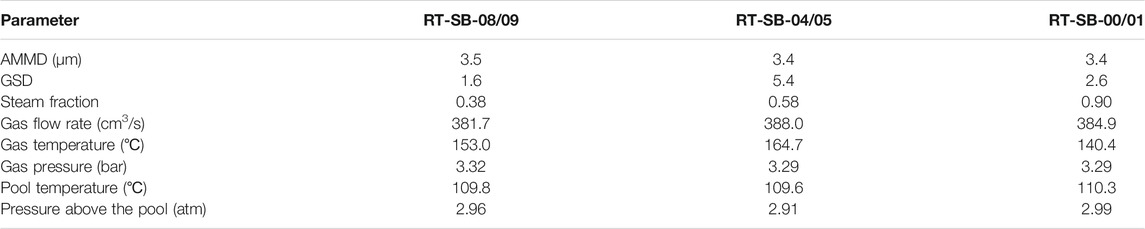
TABLE 4. Main parameters about conditions of LACE-Espana experiment.
The temperature, pressure of the pool, and the volumetric flow of the injected gas under three LACE-Espana experimental conditions were similar; the average bubble diameter estimated by the Akita relational equation was approximately 0.482 cm (dB-A), which was less than the recommended value of MELCOR (0.7 cm, dB-M). The results of their application to pool scrubbing calculation correspond to DF-A and DF-M, respectively. For DFs measurement during the LACE experiment, six datasets were obtained simultaneously to reduce the uncertainty of measurements (Marcos et al., 1994). The comparison between the calculated value of DF and the experimental value is shown in Table 5. Although the simulation result using the Akita relationship overestimates the experimental aerosol pool scrubbing removal under RT-SB-00/01 condition, considering all conditions, the simulation results using the Akita bubble size relationship are more consistent with the experiment than those based on the MELCOR's default bubble diameter value.
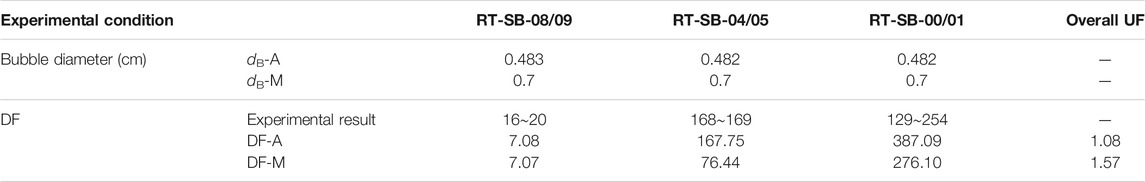
TABLE 5. DF comparisons between calculation results and experimental data of LACE-Espana test conditions.
Considering the average value of the experimental DF under each condition as a reference, it was found that the UF under each working condition satisfied the range of 0.1–10. Furthermore, the overall UF can be calculated through the data of all conditions: overall UF for DF-M is 1.57; overall UF for DF-A is 1.08.
Sensitivity Analysis on Bubble Size
To clarify the influence of bubble diameter on aerosol pool scrubbing, the bubble size sensitivity analysis was carried out based on the AA4 condition of the ACE experiment. Figure 4 shows the change of DF with the bubble equivalent spherical diameter dB. The DF of the three aerosols all decreased with the increase of bubble diameter, and the decrease was exponential in nature within a certain diameter range. The bubble size has a significant impact on the aerosol washing effect.
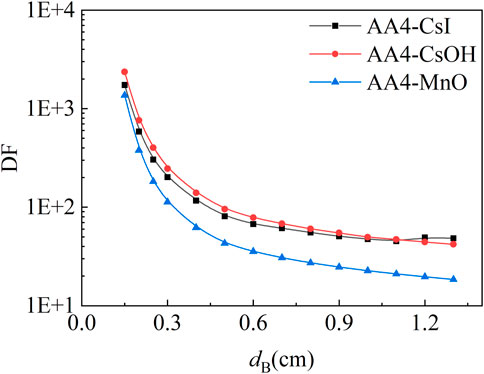
FIGURE 4. Variation of DF with an equivalent spherical diameter of stable bubble.
Influence Analysis of Different Mechanisms
Considering the ACE experiment AA4 condition as an example, the contribution of each mechanism to pool scrubbing was analyzed. The specific contribution of each mechanism is obtained according to equations described in Aerosol Pool Scrubbing Model and shown in Table 6. For CsI, in the injection zone, diffusional deposition was the main decontamination mechanism for small-sized particles, while gravitational and centrifugal deposition were the main decontamination mechanism for larger particles.
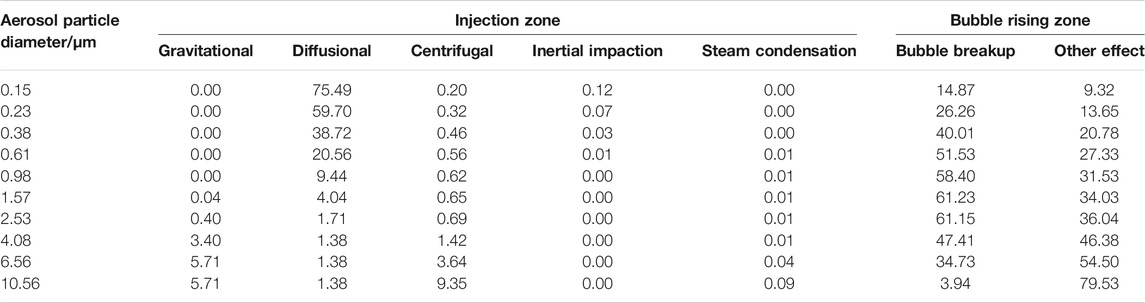
TABLE 6. The contribution of different mechanisms to pool scrubbing DF.
In the bubble rising zone, bubble breakup was an important decontamination mechanism, and the contribution of other mechanisms to pool scrubbing increased with the increase of particle size, as shown in Table 6. In addition to bubble breakup, the gravitational deposition and centrifugal capture, Brownian diffusion acting on the aerosol particles, and vapor flow at the bubble gas–liquid interface caused the aerosols to produce velocity vectors. Moreover, the relative motion between the aerosol and the bubble obtained by the superposition of multiple velocity vectors was the primary reason for the aerosol decontamination; thus, calculating the specific contribution of a certain mechanism to DF in the bubble rising zone separately was difficult, but the magnitude of the velocity vector caused by each mechanism can qualitatively reflect their contribution to DF. The velocity of each mechanism is shown in Table 7. It can be concluded that the effect of gravitational deposition in the bubble rising zone is relatively small; for small aerosols, the effect of vapor flow at the gas–liquid interface and centrifugal capture is obvious, while centrifugal deposition is the main influencing factor for larger aerosols.
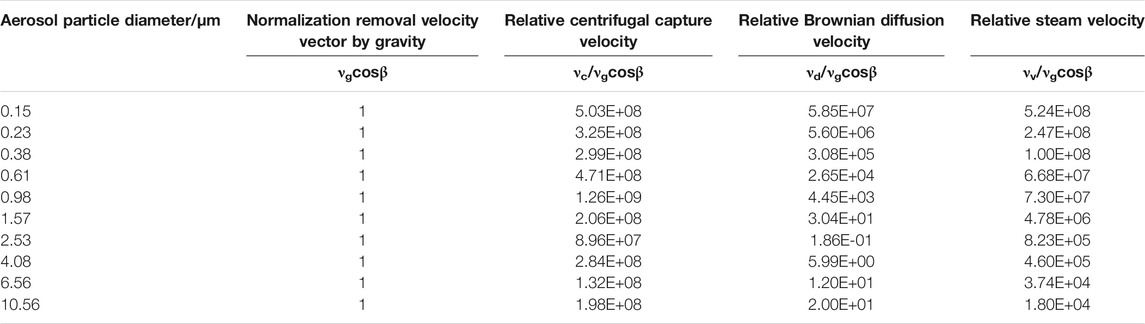
TABLE 7. Correlation velocity of each sedimentation mechanism in the bubble rising zone.
By simulating the insoluble aerosol MnO under AA4 condition of the ACE experiment, it was found that compared with the soluble aerosol CsI, the bubble breakup has a greater impact, and the contributions of other mechanisms are moderately consistent.
Modification of Bubble Breakup Equation
Bubble breakup is an important mechanism for aerosol pool scrubbing removal with multi-hole bubbler. The bubble breakup equation in the code is an empirical relationship that only considers surface tension, liquid viscosity, bubble size, and gas volume flow. By investigating the mechanism of the bubble breakup, the breakup mechanism can be expressed as the balance of external viscous stress and surface tension in the viscous case (Liao and Lucas, 2009; Zablackaite et al., 2020). Moreover, the viscosity ratio of gas and liquid is a key factor affecting bubble breakup (Elemans and Bos, 1993; Lo and Zhang, 2009). Therefore, the equation about bubble breakup is revised by introducing the viscosity ratio term
where
The modified bubble breakup equation is applied to the code, and simulation for the ACE experiment is carried out. The comparison between calculation results with modified bubble breakup equation DF-I and experimental data is presented in Table 3. Compared with the simulation results of the original code, the overall UF for the ACE experiment simulation is reduced to 3.66, which means that the deviation between simulation results and experiment is reduced.
For further verification, a simulation for LACE-Espana multi-hole bubbler condition RT-MB-01/02 (Marcos et al., 1994) is carried out with the code that applied the modified bubble breakup equation. There were nine little holes with a diameter of 10.00 mm on the bubbler, and its submerged depth is 2.5 m. The experiment used a typical soluble aerosol CsI with a density of 4.5 g/cm3. The carrier gas was a mixture of non-condensable gas nitrogen and steam, and the temperature was approximately 171.3°C. The pool temperature was maintained at 109.3°C, and the absolute pressure above the pool was 2.82 atm. The detailed parameters about this condition are shown in Table 8. The experimental measurement DF of this condition is 1,273–2,913, and the result calculated by the original code is 310.02, which underestimates the experimental value. The predicted result with the bubble breakup equation is 2,619.07, which is in great agreement with the experimental result. It proves that the modification of the bubble breakup equation is beneficial to improve the simulation precision about the aerosol pool scrubbing decontamination factor in the case of the multi-hole bubbler.
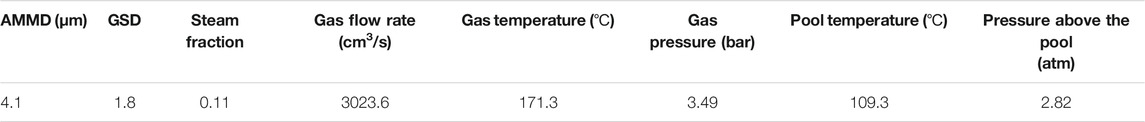
TABLE 8. Main parameters about RT-MB-01/02 condition of LACE-Espana experiment.
Conclusion
In this article, the main thermal-hydraulic characteristics of aerosol pool scrubbing have been theoretically modeled in detail, including steam condensation, inertial impaction, gravitational, centrifugal, and diffusional deposition within the injection zone, gravitational deposition, centrifugal capture, Brownian diffusion, bubble breakup and resistance due to the steam flow within the rise zone, and bubble size in the rising zone. Further, a code to evaluate the DF of aerosol pool scrubbing was proposed. In particular, for the bubble size, the empirical relationship of the Akita bubble size that considers the surface tension of the liquid, viscosity, and injection air velocity was introduced.
The ACE and LACE experiments were simulated with the code, considering different bubble size values of the Akita bubble size model and MELCOR default bubble diameter value. Compared with the simulation results using the specified bubble diameter value, the overall UF of ACE experimental simulation decreased from 24.41 to 8.82, while the overall UF of LACE experimental simulation decreased from 1.57 to 1.08 after the Akita model was adopted. It was verified that the Akita bubble size relationship is suitable for simulating aerosol pool scrubbing. In addition, the simulation results were compared with those of the MELCOR code and COCOSYS code from literature; it showed that the code proposed in this article has an equivalent predictive ability. Sensitivity analysis on bubble size is conducted, and the contribution of different behavior and mechanism was discussed. Finally, the bubble breakup equation was revised by introducing the viscosity ratio of gas and liquid and verified with the conditions of the multi-hole bubbler in ACE and LACE experiments, which can be used in simulating aerosol pool scrubbing during severe accidents.
However, considering the mechanism model of jet flow, the proposed code still needs improvement under conditions of the new type reactor designed in China, which will be the focus of our next in-depth study.
Data Availability Statement
The original contributions presented in the study are included in the article further inquiries can be directed to the corresponding author.
Author Contributions
LH conducted the model research, simulation work, and analysis and contributed to the writing of the manuscript. YL contributed to model research and analysis. YZ was responsible for the simulation work and the writing. SC contributed to the analysis and methodology. LT was responsible for the conceptualization, methodology, and supervision. XC conducted the methodology and analysis.
Funding
This work was supported by the National Science and Technology Major Project in China (2019ZX06004013 and 2017ZX06002003-001-002).
Conflict of Interest
YZ and SC were employed by the company Shanghai Nuclear Engineering Research and Design Institute Co., Ltd.
The remaining authors declare that the research was conducted in the absence of any commercial or financial relationships that could be construed as a potential conflict of interest.
Publisher’s Note
All claims expressed in this article are solely those of the authors and do not necessarily represent those of their affiliated organizations, or those of the publisher, the editors and the reviewers. Any product that may be evaluated in this article, or claim that may be made by its manufacturer, is not guaranteed or endorsed by the publisher.
References
Akita, K., and Yoshida, F. (1974). Bubble Size, Interfacial Area, and Liquid-phase Mass Transfer Coefficient in Bubble Columns. Ind. Eng. Chem. Proc. Des. Dev. 13, 84–91. doi:10.1021/i260049a016
Berzal, M. E., Crespo, M. J., Kowalczyk, M. S., Espigares, M. M., and Jimenez, J. L. (1995). State-of-the-art Review on Fission Products Aerosol Pool Scrubbing under Severe Accident Conditions. Luxembourg: European Commission.
Dong, S., and Yang, J. (2019). Overview of the Experimental Studies and Numerical Simulations on the Filtered Containment Venting Systems with Wet Scrubbers. Ann. Nucl. Energ. 132, 461–485. doi:10.1016/j.anucene.2019.04.042
Elemans, P. H. M., Bos, H. L., Janssen, J. M. H., and Meijer, H. E. H. (1993). Transient Phenomena in Dispersive Mixing. Chem. Eng. Sci. 48 (2), 267–276. doi:10.1016/0009-2509(93)80014-H
Gao, S., Fu, Y., Sun, D., Mei, Q., Pan, N., Zhang, S., et al. (2017). “Comparison Research on Different Aerosol Pool Scrubbing Models,” in Proceedings of the 2017 25th international conference on Nuclear Engineering, Shanghai, China, July 2–6, 2017.
Gauntt, R. O., Cole, R. K., Erickson, C. M., Gido, R. G., Gasseret, R. D., Rodriguez, S. B., et al. (2000). MELCOR Computer Code Manuals Vol. 2: Reference Manuals. USA: Sandia National Laboratories).
Humphries, L. L., Figueroa, V. G., Young, F. M., Louie, D. L., and Thomas, J. (2015). MELCOR Computer Code Manuals Vol. 3. MELCOR Assessment Problems. USA: Sandia National Laboratories.
Jo, H. J., Ha, K. S., and Jang, D. S. (2016). “Evaluation of Decontamination Factor of Aerosol in Pool Scrubber According to Bubble Shape and Size,” in Proceedings of the Therapeutic Korean Nuclear Society spring Meeting, Jeju, Korea, May 11–13, 2016.
Jokiniemi, J. (1990). Effect of Selected Binary and Mixed Solutions on Steam Condensation and Aerosol Behavior in Containment. Aerosol Sci. Tech. 12, 891–902. doi:10.1080/02786829008959401
Kanai, T., Furuya, M., Arai, T., and Nishi, Y. (2016). Development of an Aerosol Decontamination Factor Evaluation Method Using an Aerosol Spectrometer. Nucl. Eng. Des. 303, 58–67. doi:10.1016/j.nucengdes.2016.04.011
Knudsen, J. G. (1970). Properties of Air-Steam Mixtures Containing Small Amounts of Iodine. USA: Pacific Northwest Laboratory.
Li, Y. B., and Cao, X. W. (2015). Strategy Evaluation for Fire spray System on Advanced Passive PWR Severe Accident Management Guideline. Prog. Nucl. Energ. 85, 319–324. doi:10.1016/j.pnucene.2015.07.001
Li, Y., Tong, L., and Cao, X. (2021). Experimental Study on Influencing Factors of Aerosol Retention by Pool Scrubbing. Front. Energ. Res. 9, 675841-1–675841-9. doi:10.3389/fenrg.2021.675841
Liao, Y., and Lucas, D. (2009). A Literature Review of Theoretical Models for Drop and Bubble Breakup in Turbulent Dispersions. Chem. Eng. Sci. 64 (15), 3389–3406. doi:10.1016/j.ces.2009.04.026
Lo, S., and Zhang, D. (2009). Modelling of Break-Up and Coalescence in Bubbly Two-phase Flows. The J. Comput. Multiphase Flows 1 (1), 23–38. doi:10.1260/175748209787387106
Marcos, C., Gomez, M., Melches, S., Martin, J., and López, J. J. (1994). Lace-Espana Experimental Programme on the Retention of Aerosols in Water Pools. Spain: CIEMAT.
Owczarski, P. C., and Burk, K. W. (1991). SPARC-90: A Code for Calculating Fission Product Capture in Suppression Pools. USA: Pacific Northwest Laboratory.
Powers, D. A., and Sprung, J. L. (1993). A Simplified Model of Aerosol Scrubbing by a Water Pool Overlying Core Debris Interacting with concrete. USA: Nuclear Regulatory Commission.
Ramsdale, S. A., Bamford, G. J., Fishwick, S., and Starkie, H. C. (1992). Status of Research and Modelling of Water-Pool Scrubbing. Luxembourg: Commission of the European Communities. [Final report].
Ramsdale, S. A., Guentay, S., and Friederichs, H. G. (1995). BUSCA-JUN91 Reference Manual. Switzerland: PSI.
Rýdl, A., Lind, T., and Birchley, J. (2016). Integral Analyses of Fission Product Retention at Mitigated Thermally-Induced SGTR Using ARTIST Experimental Data. Nucl. Eng. Des. 297, 175–187. doi:10.1016/j.nucengdes.2015.11.014
Washington, K. E., Murata, K. K., Gido, R. G., Gelbard, F., Russell, N. A., Billups, S. C., et al. (1991). Reference Manual for the CONTAIN 1.1 Code for Containment Severe Accident Analysis. USA: Sandia National Laboratories.
Wassel, A. T., Mills, A. F., Bugby, D. C., and Oehlberg, R. N. (1985). Analysis of Radionuclide Retention in Water Pools. Nucl. Eng. Des. 90, 87–104. doi:10.1016/0029-5493(85)90033-0
William, C. H. (1989). Aerosol Technology. Sun, Y. F., translated. Harbin: Heilongjiang Science and Technology Press.
Keywords: aerosol pool scrubbing, decontamination factor, injection zone, bubble rise zone, severe accident
Citation: He LW, Li YX, Zhou Y, Chen S, Tong LL and Cao XW (2021) Investigation on Aerosol Pool Scrubbing Model During Severe Accidents. Front. Energy Res. 9:691419. doi: 10.3389/fenrg.2021.691419
Received: 06 April 2021; Accepted: 17 August 2021;
Published: 15 September 2021.
Edited by:
Ivan Vrbanic, APOSS d.o.o., CroatiaReviewed by:
Jiankai Yu, Massachusetts Institute of Technology, United StatesIvica Basic, APOSS d.o.o., Croatia
Copyright © 2021 He, Li, Zhou, Chen, Tong and Cao. This is an open-access article distributed under the terms of the Creative Commons Attribution License (CC BY). The use, distribution or reproduction in other forums is permitted, provided the original author(s) and the copyright owner(s) are credited and that the original publication in this journal is cited, in accordance with accepted academic practice. No use, distribution or reproduction is permitted which does not comply with these terms.
*Correspondence: L. L. Tong, bGx0b25nQHNqdHUuZWR1LmNu