 Rubén M. Montañés
 Geir Skaugen
 Brede Hagen1,2
- 1SINTEF Energy Research, Trondheim, Norway
- 2Department of Energy and Process Engineering, Norwegian University of Science and Technology—NTNU, Trondheim, Norway
Compactness and weight minimization are key aspects for successful and widespread implementation of waste heat recovery steam cycles in off-shore oil and gas platforms due to the site weight and volume footprint constraints. The power plant off-shore must be designed for flexibility in its operations to provide varying power demands across multiple time scales. Reliability of the heat and power production units is crucial. Within a case study in an off-shore platform in the Norwegian Continental Shelf, this article conducts design optimization of compact and low-weight steam cycles for power production from gas turbine exhaust and transient analysis of the core of heat recovery steam generators (HRSGs) via dynamic modeling and simulation, considering once-through steam generators (OTSGs) for the HRSGs. A method for simultaneous thermodynamic and heat exchanger geometry optimization design for bottoming cycles is applied, with the main objective being weight minimization and compactness of the cycle heat exchangers. Ten different optimal minimum weight bottoming cycle designs are provided by selecting ten different manufacturable tubes. The resulting bottoming cycle designs are compared in terms of weight, OTSG core weight distribution, heat transfer area, and footprint. The resulting bottoming cycle weight varies from 48.4 to ca. 87.10 ton for designs sensible for off-shore applications, and from 95.8 to 178.9 ton when selecting outer tube diameters typical of onshore applications. Smaller outer tube diameter selection in OTSG bundles is a key driver for low-weight and compact steam cycle designs. Three different designs representing light, normal, and heavy OTSG designs are compared by dynamic trajectory and response time analysis under transient scenarios by means of dynamic modeling and simulation. More compact and lighter designs respond faster to changes in the gas turbine (GT) operation upstream the OTSG. The results in this analysis indicate the need for feedforward control. Feedback control alone is probably not a good option due to the high OTSG open loop stabilization time and large sensitivity to GT exhaust gas variations. More compact and low-weight designs based on the OTSG can reduce potential challenges in controlling and stabilizing bottoming cycles for power production.
Introduction
The Norwegian oil and gas (O&G) industry is highly energy intensive, and CO2 emissions from off-shore installations constitute 27% of the greenhouse gas emissions from the Norwegian territory, being the largest emitting industry in Norway [Norsk Olje Og Gass, Environmental Report, (2018), n.d.]. Since the Norwegian electric power system is mostly based on hydropower generators, decarbonization solutions are required in other areas of the Norwegian economy. Previous research has indicated that installation of off-shore bottoming cycles can reduce up to 25% of CO2 emissions from an off-shore platform (Nord and Bolland 2012; Mazzetti et al., 2014a). This solution could contribute to Norway’s goal of 40% reduction in CO2 emissions from 1990 to 2030 and also toward the goal of net zero emissions by 2050.
Combined cycles based on steam and gas turbine technology are conventional systems for power production onshore. A bottoming cycle recovers available excess heat from the GT exhaust and converts it into power and/or heat. Several case studies have been conducted to address the potential challenges of steam bottoming cycle installations in off-shore oil and gas platforms for efficiency enhancement and CO2 emissions reductions. Nord and Boland evaluated the design of combined cycles for off-shore oil and gas installations, concluding that the efficiency could be increased by 10–13% and significant CO2 emissions can be reduced (20–25%), but the main disadvantage is the heavy designs, which result in 60–70% weight to power ratio increase in comparison with simple cycle power plants (Nord and Olav, 2013). Vidoza et al. (2019) proposed a floating off-shore platform for lower fuel consumption and CO2 emissions, in a configuration with several gas turbines in parallel connected each to a heat recovery steam generator (HRSG) and feeding a common steam bottoming cycle. Other nonconventional working fluids have been evaluated for bottoming cycles, namely air bottoming cycles (Pierobon and Haglind, 2014), CO2 cycles (Walnum et al., 2013; Zhang et al., 2018), and organic Rankine cycles (Tchanche et al., 2011; Pierobon et al., 2013; Lecompte et al., 2015; Nami et al., 2018). Pierobon et al. concluded that the organic Rankine cycle technology provides improved performances compared to steam Rankine cycle units, while the implementation of air bottoming cycles was concluded to be not so advantageous due to cost and environmental perspectives (Pierobon et al., 2014a). However, to date only steam bottoming cycles have been installed on the Norwegian Continental Shelf (NCS), making the technology closer to widespread implementation in the short term.
Nord and Boland emphasized that the main challenges for off-shore steam bottoming cycle implementation are the limitation on space and weight, the harsh external conditions, and the need for fresh demineralized water for the steam cycle. The work suggested selecting once-trough technology as it avoids the installation of bulkier and heavier drum systems, using once-through technology and one-pressure level system with advanced tube materials to avoid bypass stack (Nord and Bolland 2012). Other additional challenges include long-term operational and reliability challenges related to maintenance, flow-induced vibrations (Païdoussis 2006), and cycling operation that might cause failure of components possibly due to thermal and mechanical stress-induced failures (Gülen Can and Kim, 2014; Brady 2001). Once-through steam generator (OTSG)/HRSG design optimization with respect to minimum weight, taking effects from flow-induced vibration into account, was addressed by Deng et al. (2021).
Multiobjective optimization approach enables including practical feasibility of the steam bottoming cycle in the design and optimization of the thermodynamic cycle (Pierobon and Haglind, 2014). Several works in the literature have proposed methodologies for multiobjective optimization and design of bottoming cycles and OTSG/HRSG for off-shore oil and gas platforms. Emphasis is put on the key challenging factor that is the weight-to-power ratio (Nord et al., 2014). Other authors evaluate optimal designs based on techno-economic optimization (Pierobon et al., 2013; Nguyen et al., 2014a; Nguyen et al., 2014b; Pierobon et al., 2014a; Pierobon et al., 2014b; Zhang et al., 2018), albeit cost is highly uncertain in off-shore oil and gas applications. Skaugen et al. (2014) developed a methodology for optimizing total minimum weight of an off-shore waste heat recovery unit by including both the finned tube bundle and the casing and structures. The result showed a close to quadratic exhaust gas flow area to keep the total weight low.
The power plant off-shore needs to be flexible in its operations to provide the varying power and possibly also heat demands. Heat and power demand can vary both due to daily operations and also along the lifetime of the field development (Riboldi and Nord, 2017a), meaning that the typical operating point of the plant changes over time so the system must be designed for high flexibility in terms of steady-state performance (Nord and Olav, 2013; Walnum et al., 2013; Mazzetti et al., 2014b). In addition, several works emphasize the possibility of cutting carbon dioxide emissions simply by optimizing the operating strategy (Riboldi and Nord, 2017b). Several measures can be taken to increase load flexibility in heat and power, albeit some increase the weight of the bottoming cycle. Such measures can be flue gas bypass system, steam turbine steam bypass, and supplementary firing (Encabo et al., 2018). A key aspect of operational flexibility is the system dynamics; this is the dynamic response of the system in the presence of intended or unintended operational changes and the implemented system controls. These aspects might become even more relevant in future integrated off-shore energy systems including variable renewables such as off-shore wind for power supply, where the gas turbine-based power unit with bottoming cycle is key for balancing fluctuations in power demand (Pierobon, 2015). Alobaid et al. presented an extensive literature review on the topic of dynamic simulations of thermal power plants (Alobaid et al., 2017). Alobaid et al. also suggests that dynamic simulation models are capable of reliably predicting the system response to failure malfunctions and to modifications in design and control structures (Alobaid et al., 2015). Temraz et al. highlighted that the triggers and effects of fluid dynamic instabilities are of great importance in the design and operation of steam generators and provided preliminary results to showcase some functionalities and the capability of a test rig to characterize the existing flow pattern through the evaporator and investigate the internal characteristic curve of the evaporators in HRSGs (Temraz et al., 2020). Dynamic simulations and controls have been studied for bottoming steam cycles off-shore (Nord and Montañés, 2018) and for alternative working fluid bottoming cycles including air bottoming cycles (Benato et al., 2014) and organic Rankine cycles (Wei et al., 2008; Quoilin et al., 2011).
Brady (2001) mentioned the several potential advantages of OTSG designs with respect to drum-based, including faster load following ramp-rate and start-up, capability to operate under dry running conditions (hot dry tubes) and reduced feedwater and maintenance demands (Kim et al., 2000). During load following scenarios, the OTSG is the main component adding thermal inertia to the transient response of the system. In addition, OTSGs allow for off-design operation because the water level can be, in principle, anywhere between the first tube rows to the last one in the water direction (Brady, 2001). Nord and Montañés evaluated control structures for steam bottoming cycle by means of dynamic modeling and simulation (Nord and Montañés, 2018). The results from the evaluation of control strategies showed the benefits in utilizing feedforward control on the feedwater mass flow rate supply to the OTSG for the operation of the HRSG under fast load changes in GT (ramp rates of ca. 5%/min GT load), and the effectiveness of active attemperator control with OTSG bypass valve to avoid excessive excursions of live steam temperature during transients.
The design criteria and their implications of steam cycles for conventional power plants are well known; however, unconventional plants such as compact steam bottoming cycles off-shore for waste heat recovery are still an object of research. The development of systematic optimization techniques and dynamic simulation tools and analyses are required. In this work, a case study on an off-shore oil and gas platform in the Norwegian Continental Shelf was conducted. The aim was to design a compact steam bottoming cycle tailored to the case study platform. By installing such a bottoming cycle, one gas turbine could be shut down, thereby saving fuel and reducing CO2 emissions in off-shore oil and gas production. The resulting designs based on weight minimization were analyzed. For three different optimal OTSG designs, dynamic modeling and simulation was used to simulate the dynamic response of the different designs of one of the OTSGs. The dynamic response of the OTSG systems was analyzed for realistic scenarios derived from historical GT operation data. The scenarios represent GT load changes of various magnitudes and at several ramp rates of GT load change.
Methodology
The methodology in this work included steam bottoming cycle design optimization and dynamic modeling and simulations of OTSGs. Figure 1 presents a method overview with the four main building blocks for the methodology in this article and the two main results. In Reference Off-Shore Platform, the reference off-shore O&G platform system and the proposed retrofits to remove one GT from continuous operation are described, together with the GT boundary conditions for bottoming cycle design. In Bottoming Cycle Design Optimization, the reference bottoming cycle configuration and design optimization method for steam bottoming cycle systems are described. Several designs are obtained by selecting different tube outer diameters and wall thickness in OTSG tube bundles as a key design parameter. The selected diameters include five ASME boiler tubes design, typically of onshore boilers (STEELTUBE, 2021), and used previously by other authors in literature for off-shore applications (Pierobon et al., 2014a), and five more suitable for compact and reduced weight designs probably required in off-shore platforms. The optimization method combines thermodynamic optimization and heat exchangers geometry design optimization. Three selected OTSG heat exchangers resulting from bottoming cycle design optimization are then further analyzed by means of dynamic modeling and simulation. These OTSGs represent light, normal, and heavy OTSG designs. In Dynamic Process Modeling of Once-Through Steam Generator, the dynamic models of the OTSG heat exchanger are described. In Simulation Scenarios and Dynamic Analysis of OTSG Designs, the scenarios for evaluating the OTSG dynamic response under typical upstream GT operations for different OTSG designs are presented.
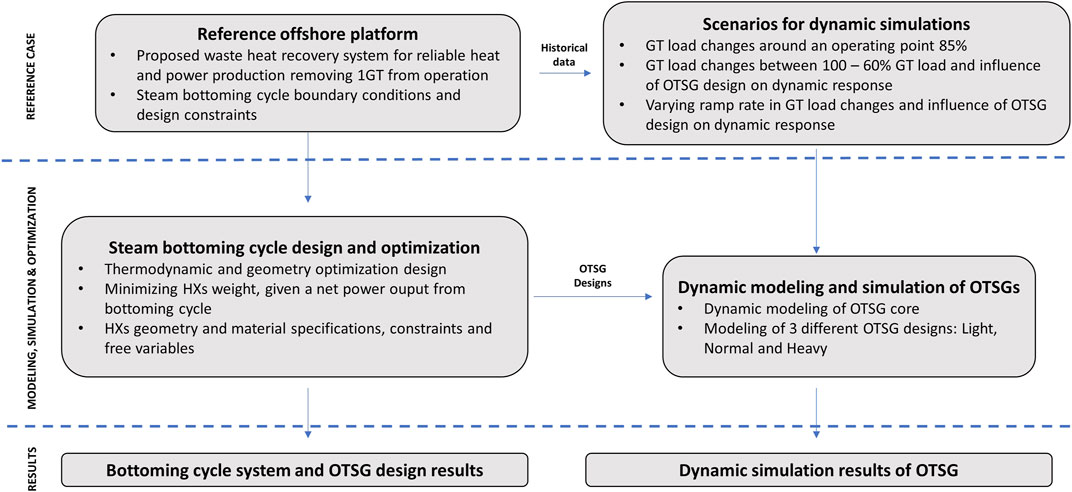
FIGURE 1. Method overview of reference off-shore platform, steam bottoming cycle design optimization, dynamic modeling of OTSG, and selection of scenarios.
Reference Off-Shore Platform
The case study considers an off-shore platform heat and power generation unit as a reference case; refer to Figure 2. The platform is situated in a field in the Norwegian sector in the North Sea. The platform currently uses six gas turbines for gas compression and electric power production. All gas turbines consist of General Electric’s GE LM2500 22 MW gas turbines electric power generator drive and mechanical drives implemented with the following configuration and loads:
• Two gas turbines for low pressure (LP)/high pressure (HP) compression normally operated at around 85–100% load (GT1 and GT2).
• Two gas turbines for running pipeline export compressors normally operated at 85% load (GT3 and GT4).
• Two gas turbines for electric power generation normally operated at 60% of nominal load (GT5 and GT6). Connected to existing hot-oil waste heat recovery (WHR) 7.5 MWth.
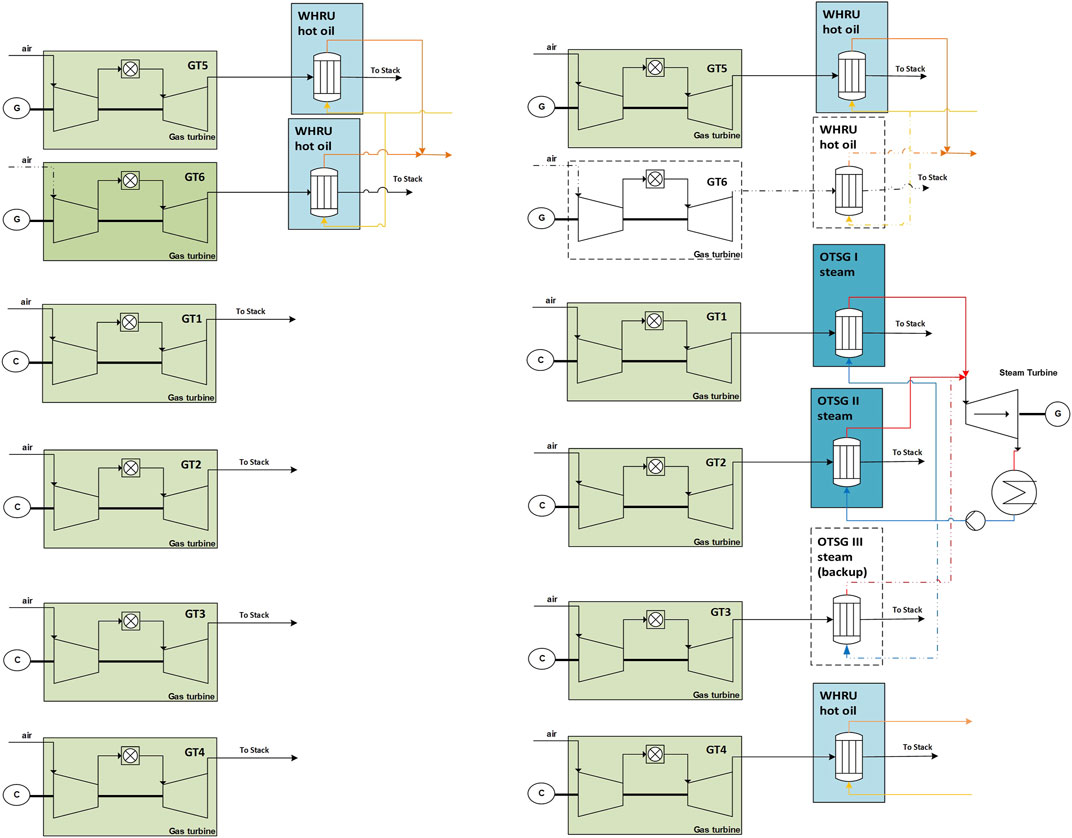
FIGURE 2. Reference system (A) and proposed retrofitted system (B) for heat and power (mechanical and electric) generation system based on GTs at the off-shore platform.
In addition, the platform supplies heat in a hot oil loop of 14.36 MWth, being the heat supplied by recovering heat from the exhaust of the electric power GTs, GT5, and GT6. A figure on the reference configuration at the platform is shown in Figure 2A.
This case focuses on waste heat recovery from the exhaust gas of two gas turbines for LP/HP compression normally operated at around 85–100% load. The system is designed in such a way that one OTSG is on back-up mode under normal operation. By that means the installation of four waste heat recovery units (WHRUs) can potentially achieve reliable heat production (hot oil) and electric power supply from the WHRUs and bottoming cycle. This would allow the shutdown of one 22 MWel GE LM2500 gas turbine (GT6 in Figure 2A) that currently generates electricity with 60% load at the platform (total power of app. 26.4 MW). In the proposed modification (Figure 2B), four WHRUs are installed downstream of the mechanical drive turbines:
• Two gas turbines (GT1 and GT2) produce steam for the bottoming cycle (OTSG type).
• One gas turbine (GT3) is used as backup (normally out of operation) for steam production (OTSG type).
• One gas turbine (GT4) heats the hot oil loop.
In this article, the focus was set on the design and optimization of the steam bottoming cycle and the dynamic analysis of OTSGs installed downstream GT1 and GT2 in Figure 2B. To replace GT6 from operation, 13.2 MWel should be covered by the steam bottoming cycle when running with only two GTs, GT1 and GT2. Seawater is available at 11°C as heat sink for the steam bottoming cycle. The return temperature is set to 30°C. An existing seawater supply system can provide up to 1300 m3/h of cooling water. A dedicated seawater supply system to the bottoming cycle must be provided for larger capacities.
Bottoming Cycle Design Optimization
This work focuses on the design of the steam bottoming cycle with the once-through steam generation approach for heat recovery steam generation. Once-through heat recovery steam generation technology can be an effective option when designing a steam bottoming cycle for off-shore applications. The main advantages of OTSG include the avoidance of steam drums, and the possibility of avoiding the bypass stack while allowing for dry HRSG operation with the selection of the right materials (Nord and Olav, 2013). The bottoming cycle designed in this work is installed downstream the mechanical drive GTs running on full load (GT1 and GT2 in Figure 2), with the objective of minimizing the system weight for providing a given design net power output.
Heat is recovered from the exhaust of two gas turbines in two parallel finned tube once-through steam generator heat recovery heat exchangers (OTSG 1 and OTSG 2). High-pressure feedwater enters each OTSG and is heated, evaporated, and superheated before being sent to a common pipe and to the steam turbine. The superheated steam from the two OTSGs is expanded through the turbine and condensed in a plate heat exchanger using seawater as the cooling fluid. The condensed (and slightly subcooled feedwater) is pumped to the feedwater inlet pressure and split between the two OTSGs. The heat source for design was exhaust from two LM2500 PJ gas turbines running at 100% load (see Table 1. The GT inlet air temperature is set to 15°C and 60% relative humidity. A standard natural gas fuel without H2S is assumed. The main fixed parameters for the bottoming cycle design optimization are presented. A complete list of bottoming cycle process design input specifications including GT data, steam bottoming cycle parameters, and OTSG material selection are presented in Supplementary Table S1.
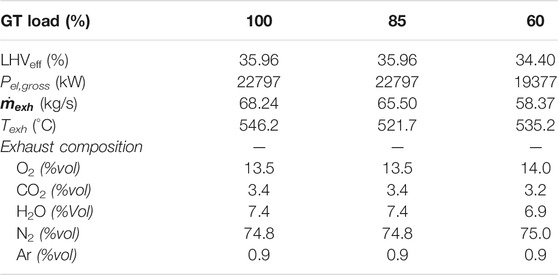
TABLE 1. Reference GT data for the LM2500 PJ model in the reference platform at full load and three off-design part load operating conditions.
The bottoming cycle design optimization was carried out using a bottoming cycle model integrated with a gradient-based optimization algorithm (Schittkowski 1986). The bottoming cycle model applies geometry-based models for the heat exchanger and constant efficiency models for the turbomachinery and uses provided heat exchanger geometry information and cycle state points to compute the bottoming cycle net power and the size and weight of heat exchangers. The purpose of the optimization algorithm is to find the optimal heat exchanger geometry and process state points that minimize the objective function and satisfy a set of constraints. In this work the objective function is the total weight of the two OTSGs including the fins, tube, and structural components and the weight of a plate condenser.
Equality constraints are imposed to ensure a consistent design. An equality constraint is imposed to predefine net produced power which is the difference between the power produced by the steam turbine
The inequality constraints are imposed to ensure a feasible bottoming cycle process and a manufacturable OTSG design. The process inequality constraints are, for example, imposed to limit the exhaust pressure drop over the OTSGs and the amount of water droplets at the steam turbine outlet (see Table 2). The full list of process constraints used for design optimization can be found in Supplementary Table S2. The OTSG geometry constraints are imposed to ensure feasible fin tip clearances and manufacturable tube bend diameters. The full list of OTSG geometry constraints is found in Supplementary Table S5. The independent variables govern both process variables like steam turbine inlet temperature and pressure, feedwater flow, sea water flow rate, and heat exchanger geometry parameters. The complete list of free process variables and their allowable ranges can be found in Supplementary Table S3. The OTSG geometry variables govern the fins, tubes, and the tube bundle layout, and for the condenser, the number of plates and plate geometry. The full list of free geometry variables used for the OTSG used for design optimization is found in Supplementary Table S4. The optimization problem consists of 14 variables, three equality constraints with additional seven inequality constraints and will have a degree of freedom of 11.
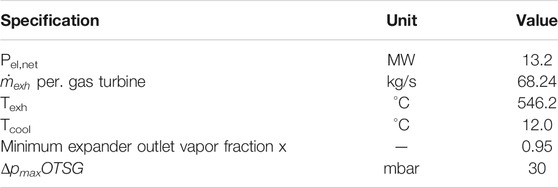
TABLE 2. Input specifications used for process design optimization.
In this work the “best practice” models from ESCOA were used as described by Ganapathy (Ganapathy, 2003) for the estimation of the exhaust side heat transfer and pressure loss. Heat transfer correlations for estimating the heat transfer coefficient
In this work, ten different designs are calculated for different tubes in Table 3, which are based on dimensions and weights for seamless tubes according to the American Society of Mechanical Engineers (ASME) standard (STEELTUBE, 2021). The ESCOA correlation also included data for 1” tubes and provided additional confidence in the chosen method. Three distinct ranges of boiler tube diameters are shown: the “very-light”; the range considered a sensible range for off-shore boiler systems for our case and will result in systems from “light” to “heavy” to be analyzed with dynamic simulations; and range typical boiler tubes found in onshore steam power plants. These terms are used in the manuscript only to distinguish between the selected cases and are linked to the selected tube diameters. The outer tube diameters are from the ASME boiler tube standards, and the wall thickness is calculated from design equations where the nearest available, larger than calculated, are selected from tube standards (ASME).
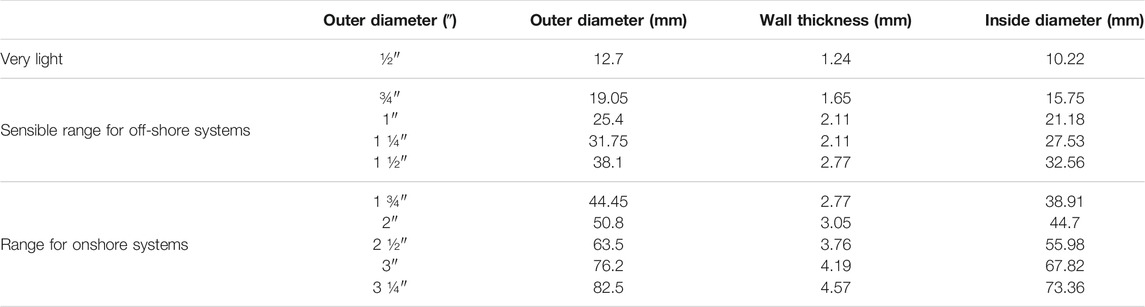
TABLE 3. A selection of boiler tube diameters and wall thicknesses: seamless tubes according to the ASME standard (STEELTUBE 2021).
For each of these tubes a design optimization can be carried out. While only the tube diameters are constant (and the fin thickness), all other OTSG and plate condenser geometry parameters are calculated along with the free process variables: outlet exhaust temperature (or recovered heat), the boiler pressure, and the inlet steam turbine temperature are varied to find the minimum total weight for 13.2 MWel net power and with a maximum exhaust pressure loss of 30 mbar. Table 2 shows the main specifications for design optimization. Figure 3 shows the OTSG and the tube bundle with the structural elements. The design optimization results are presented in Design Results: Optimization for Minimum Weight.
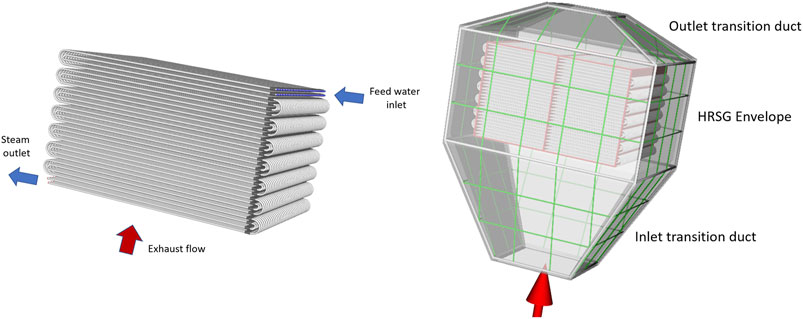
FIGURE 3. Geometry visualization of a 3D tube bundle for the OTSG core and how the tube bundle is situated inside a casing. To the right, the structural elements are shown in a schematic way including duct plates (three layers with an inner lining of 2 mm steel plates, an insulation layer, and the outer duct of 10 mm steel plates), beams (green lines), heat exchanger frame, and the support plate(s) (in red).
Dynamic Process Modeling of Once-Through Steam Generator
To ensure stable operation of the installation, it is important to understand the dynamic response of the OTSG to changes in GT load. The dynamic models of the OTSG core have been implemented in the open Modelica language, in DYMOLA modeling environment (Systèmes, 2019). A dynamic process model of the OTSG was developed by the heat exchanger recuperator models in Modelica (Modelon, 2020). Internal and external heat transfer and total heat exchanger (HX) mass can be calculated from the input geometry (Dechamps, 1995). Input geometry needed includes outer dimensions, passes, shell geometry, and fin geometry. In addition, the wall material properties for tubes and fins need to be introduced as inputs to the dynamic model. In this work, different input geometries to the dynamic model are implemented considering three different minimum weight designs obtained from design optimization in Bottoming Cycle Design Optimization. The dynamic responses of different designs are analyzed and compared in this article. The three selected designs for dynamic simulations represent a light (¾” outer diameter), normal (1” outer diameter), and heavy (1 ½” outer diameter) within the range sensible for off-shore applications.
A one-dimensional (1D) dynamic model was implemented, being a counterflow heat exchanger (Dechamps, 1995; Gülen Can and Kim, 2014). This assumption neglects the cross-flow orientation in the OTSG, but is a common assumption in dynamic process models, for computationally robust simulations. For an OTSG, these assumptions neglect that each pass of an individual tube is a cross-flow heat exchanger (Tummescheidt, n.d.; Dechamps, 1995). The fluid media thermo-physical properties change in a nonlinear fashion within a heat exchanger tube; therefore, the 1D cross-flow heat exchanger is discretized in the exhaust flow direction in a number n of control volumes (refer to Figure 4).
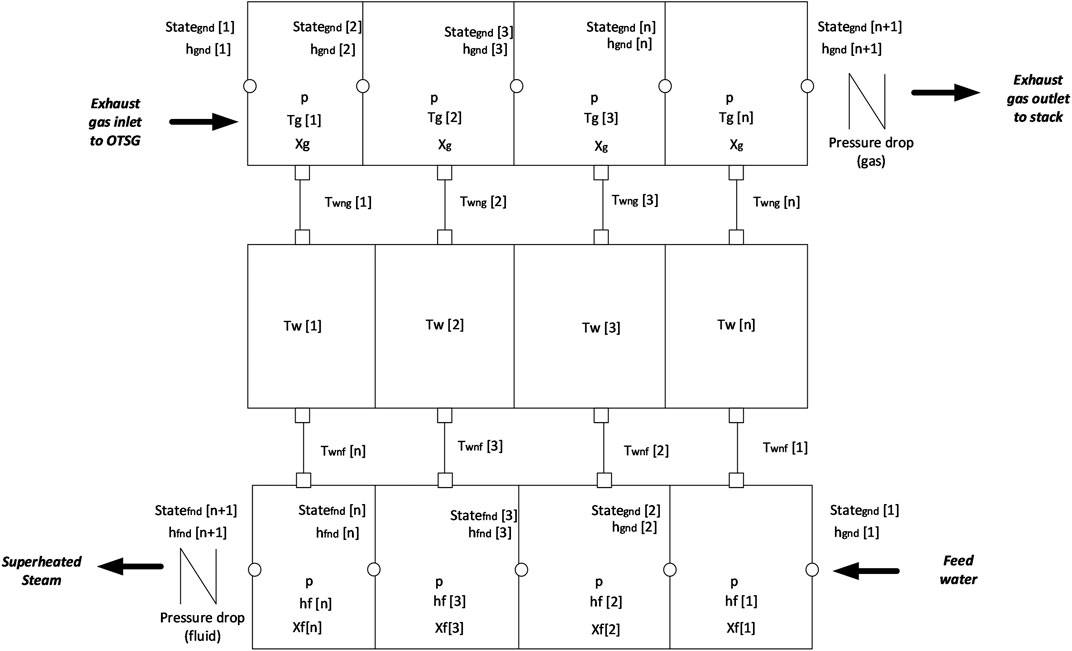
FIGURE 4. Discretized dynamic OTSG model with lumped pressure in fluids and pressure drop at the outlet. Gas pipe: Mass-fraction, and energy balance equations are discretized with the finite volume method. State variables are one lumped pressure p, n temperatures Tg, mass fractions and trace concentrations in flue gas (Xg). Water pipe: Mass-fraction, and energy balance equations are discretized with the finite volume method. State variables are one lumped pressure p, n enthalpies hfn, mass fractions and trace concentrations in flue gas (Xf,j). Wall model: 1-dimension model of a metal wall where the heat capacity is lumped at the center of the wall. The figure here is an example with n = 4.
The gas or hot side flow model consists of a discretized dynamic pipe model for a gas medium with a lumped pressure. Mass-fraction, and energy balance equations are discretized with the finite volume method in n control volumes. State variables are one lumped pressure, n temperatures, and mass fractions. In this work the number of volumes n was set equal to the number of passes.
The dynamic mass balance for a given volume j is represented in Eqs 1, 2, where Mj is the mass of fluid in the volume j and
The energy balance in a volume j is described in Eq. 4, where
The pressure loss is calculated at the outlet of the flow, since a lumped pressure model is assumed for heat transfer calculations. This model is considered valid for a single-phase operating region at a flow where convective effects are larger than diffusive ones, which is a reasonable assumption in flue gas waste heat recovery in off-shore applications. The heat transfer coefficient
Solid wall models are relevant when it comes to transient modeling since the wall heat accumulation adds thermal inertia to changes in stream conditions. The key phenomena to the model are the wall capacitance and its resistance to transfer heat (between hot gas and cold fluid). There are different common models of wall as reviewed by Tummescheidt (n.d.). The typical approach to modeling the wall is a flat wall model in which the heat capacitance is lumped at the center of the wall. The wall is discretized in a sequence of heat capacities and resistances in the longitudinal direction (discretization in the perpendicular direction to the dominant heat flow direction (Tummescheidt, n.d.)). The model in this article assumes negligible longitudinal heat conduction, heat capacity is lumped at the center of the wall, and it is assumed equidistant discretization. Note that Twng refers to wall temperature on the gas side node, Tw refers to the average temperature in the center of the wall. Twnf is the wall temperature on the fluid side of the wall.
The energy balance in Eqs. 6–9 describes the heat transfer in the wall, including energy balance and lumped heat transfer resistance, which is divided into two. The heat capacity cp and conductivity
The water/steam model employed is a model of a discretized dynamic pipe for a two-phase medium, which utilizes an integrated mean density and lumped pressure approach. Mass and energy dynamic balances are considered for the two-phase fluid side. The fluid inside the pipe (in the boiler section of the OTSG) has a uniform temperature over a cross-sectional area. Inside the pipes in the discretized OTSG the fluid can be liquid, two-phase, or super-heated vapor where the regime is determined by the vapor quality (mass fraction). From the quality and liquid/vapor density ratio, a two-phase volume fraction is calculated and will determine the mean bulk density that takes into account slip between the vapor and liquid phase in a control volume. For details on the different model formulation for two-phase flow models, moving boundary models, moving boundary equations and void distribution, the reader is referred to the work by Tummescheidt (Tummescheidt, n.d.) and a detailed formulation for the models implemented in the Modelica language can be found in the work by Jensen and Tummescheidt (2002). Owing to the nature of the modeling paradigm, several formulations are possible and are up to the modeler to choose depending on the purpose of modeling and simulation. The work (Jensen and Tummescheit, 2002) presents the governing equations of a moving boundary model in its more general formulation (which is also found in OTSG operation off-shore), considering subcooled liquid at the inlet, and superheated fluid at the outlet.
The OTSG dynamic models presented in this section were validated in the work by Nord and Montañés (Nord and Montañés, 2018), which showed that the dynamic process models can properly predict the transient output trajectory of the selected main process variables, including live steam pressure and temperature. In that work, a dynamic process model based on a simplified process layout was developed in the open physical modeling language Modelica and validated with reference steady-state and transient software data. Note that in the work by Nord and Montañes (Nord and Montañés, 2018), no optimal compact designs were considered in the evaluation, since the focus and the purpose was on control structure design and system level control analyses.
Simulation Scenarios and Dynamic Analysis of Once-Through Steam Generation Designs
The dynamic model presented in Dynamic Process Modeling of Once-Through Steam Generator was applied for dynamic analyses of optimized OTSGs. The dynamic analyses study the transient OTSG performance subject to GT load changes with and without feedwater control. The transient performance is defined as the response output trajectories of the OTSG, namely, the mass flow rate
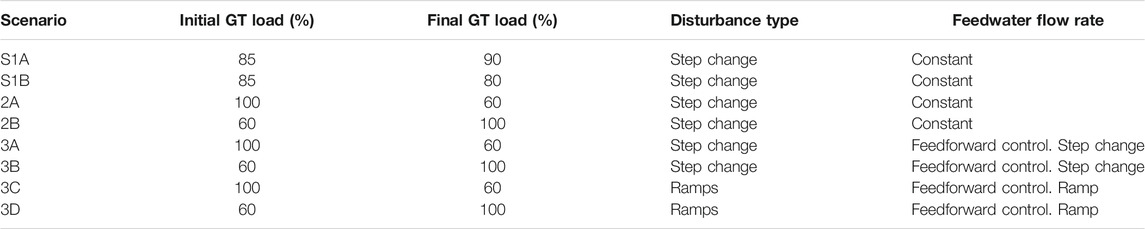
TABLE 4. Summary description of scenarios for dynamic analysis of OTSGs driven by GT load change.
Scenario 1: Gas Turbine Load Changes Around Typical Operating Point
Historical operational data for the mechanical drive GTs in Figure 2 (GT1, GT2, GT3, and GT4) during a year were analyzed for the reference off-shore platform. The analysis indicated that the GTs are operated in parallel mode, sharing a similar amount of the total load under normal operation. GT1 and GT2 are normally operated around 85–90% of the load and oscillate around that operating point in a regular basis within 80–100% of the load. Therefore Scenario 1 deals with normal operation of the gas turbines, and disturbances in GT in +/−5% GT load, defined with step changes that represent fast GT load variations around the normal operational point range. In Scenario 1 (S1), the gas turbine initial operating point is 85% GT load (refer to Table 4 for steady-state values), and load changes are implemented as simultaneous +/−5% of exhaust gas mass flow rate and exhaust gas temperature. Scenario 1A (S1A) represents GT load decrease and Scenario 1B represents load increase (S1B). Both Scenarios S1A and S1B assume that the feedwater flow rate is kept constant, and pressure of live steam is tightly controlled to the nominal value as a set point, this is assuming that the steam cycle is controlled under live steam valve throttling controls. From a practical perspective, knowing how the OTSG responds to a sudden input is important. This scenario helps to identify how variations in GT operation affect steam generation, which in turn will affect net power output production when considering the whole steam bottoming cycle.
Scenario 2: Large Gas Turbine Load Changes and Influence of Once-Through Steam Generation Size on Dynamic Response
While typical operation seems to be around nominal point for GT1 and GT2, the gas turbines GT3 and GT4 present larger changes in load, oscillating from ca. 70–95% load. In addition, due to GT sudden shutdown, the GT operating in parallel mode should rapidly ramp up its load. Therefore, it is relevant to study the dynamic response of the OTSGs to larger magnitude changes in GT load. Scenario 2 deals with sudden gas turbine load changes from 100 to 60% (S2A) and from 60 to 100% (S2B). Scenarios S2A and S2B assume that the feedwater flow rate is kept constant. Moreover, three different OTSG designs are considered in Scenario 2 to analyze the effect of tube diameter on the dynamic response of the OTSG.
Scenario 3: Feedforward Control of Feedwater Flow Rate and Varying Load Ramp Rates
In OTSGs, varying the feedwater flow rates controls the live-steam temperature (Brady, 2001). Increasing feedwater flow rate will decrease live-steam temperature and vice versa. Scenario 3 considers feedforward control of the OTSG with perfect foresight. This is a control strategy in which the set point of the feedwater flow rate aims at having a constant steady-state live steam temperature. This means that the live steam temperature at some point in time after a GT load change will stabilize at its original value. Scenarios S3A and S3B consider step changes in feedwater mass flow rate to control the live steam temperature. Scenarios S3C and S3D analyze the effect of ramp-rate on dynamic behavior of the OTSG, for GT load change with ramp rates 2, 10, and 20%/min.
Results and Discussion
Design Results: Optimization for Minimum Weight
The results of design optimization for minimum weight are shown in Figure 5. All optimizations applied the boundary conditions and constraints from Table 2. The input to the design optimizations differs only by the cross-sectional geometry of the OTSG tubes (see Table 3).
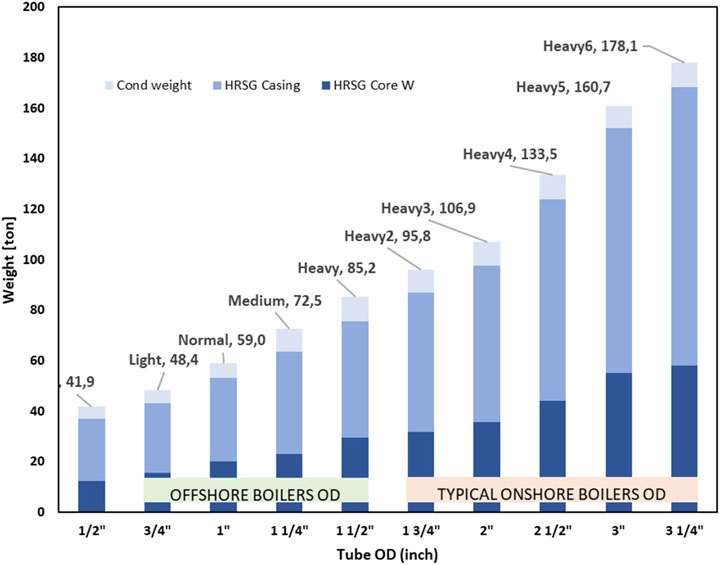
FIGURE 5. Weight of heat exchangers (OTSG 1 + OTSG 2) and condenser (cond) for optimal minimum weight designs based the tubes in Table 3. The results show 10 designs from “very-light” design; four designs sensible for off-shore boilers and five designs with OD for onshore boilers, and weight distribution between condenser weight, and OTSG casings and cores.
Figure 5 shows the minimized weight of heat exchangers in bottoming cycle with the configuration of two HRSGs with OTSG configuration feeding a common steam turbine with a condenser. Therefore, the total weight presented in Figure 5 includes two OTSGs and one condenser. Larger tubes result in heavier designs. The overall system weight varies from 48.4 to ca. 87.10 ton for off-shore OTSG applications, and from 95.8 to 178.9 when selecting outer tube diameters typical of onshore applications. The OTSG casings are the main weight component in the OTSGs, spanning from ca. 9.5 to ca. 19 ton for off-shore OTSGs. The OTSG casing represents ca. 63–66% of the total OTSG weight. The condenser weight spans from 5.36 to 9.7 tons. The results indicate that utilizing onshore tubes results in excessively heavy waste heat recovery bottoming cycles, which can potentially prevent their implementation off-shore.
The results in Figure 6 show the resulting weight of one OTSG core using tubes sensible for off-shore boilers, distributed to tubes, fins, and bends. The core weight varies from 7.73 ton for the light design to ca. 15.6 ton, being the fins metal mass the main contributor to the weight of the OTSG core from 4.6 to 8,12 ton (ca. 52–60% of core weight). The tubes metal mass is the second significant weight component of the OTSG core, spanning from ca. 2.8 to 6.5 ton depending on the tube geometry. The heavy OTSG design has a core around twice as heavy than the lighter design, showing that the tube diameter is a key parameter adding total weight to the OTSG core.
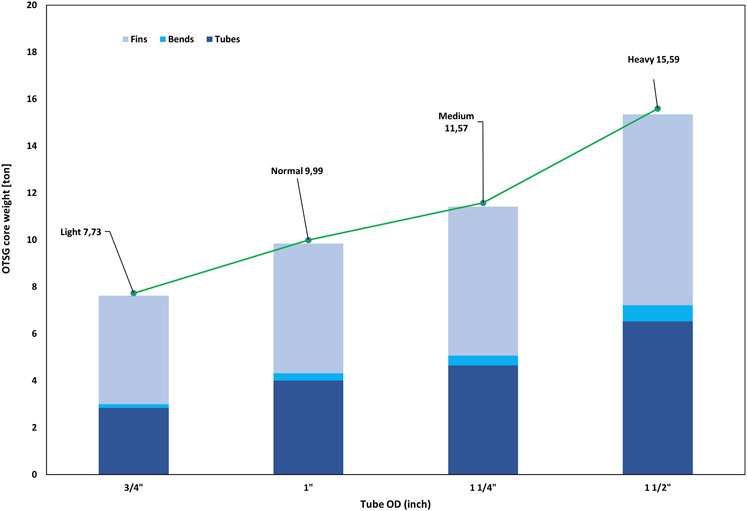
FIGURE 6. Total OTSG core weight for each OTSG, for boiler tubes OD within the range relevant for off-shore applications as presented in Table 3.
The results in Figure 7A show the resulting heat transfer surface area (total active surface area, bare tube surface area, and fins surface area) of the OTSG cores, as well as the pinch point for the different OTSG designs within the sensible range for off-shore systems. The core total area varies from 1450 m2 for the light design to ca. 2525 m2, being the fins the main contributor to the gas side heat transfer surface of the OTSG core. The pinch point decreases as more metal mass and heat surface area are included, at the expense of larger core weight. Pinch point is a good indication of efficient heat transfer. It is generally understood that the smaller the pinch point the more efficient heat transfer (less exergy destruction in the heat transfer process) occurring in the OTSG, but at the expense of more heat transfer area required (and metal, meaning more cost as well in terms of weight and capital investment). Note that the designs provide the same total system steam turbine power output of 13.20 MWel.
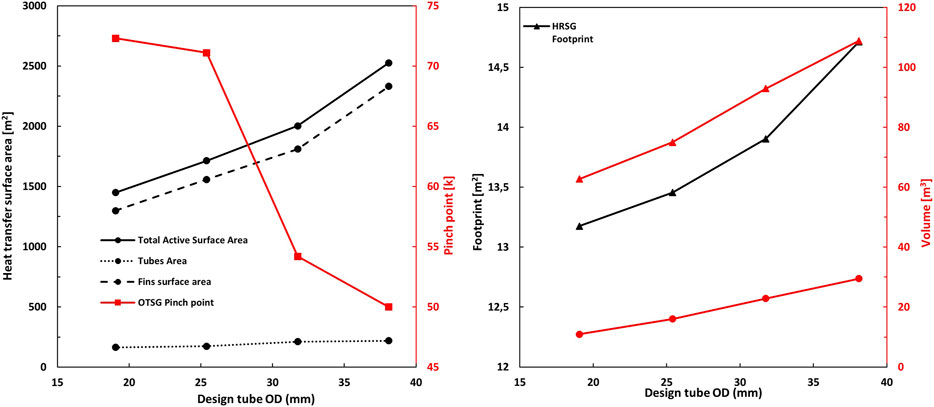
FIGURE 7. Results of design optimization for minimum weight. More detailed results are found in Supplementary Table S8. All the designs have a cycle net power output of 13.2 MW. (A) Heat transfer surface area distribution (total, tubes and fins) and pinch point; and (B) surface footprint and volume footprint.
The results in Figure 7B show the OTSG surface footprint and volume of the OTSGs. The OTSG total footprint area varies from 13.2 m2 for the light design to ca. 14.6 m2 for the heavier design. The core volume ranges from 10.29 m3 (light) to 29.47 m3 (heavy) while the frame of the OTSG ranges from ca. 62 to 108 m3. Larger tubes result in bulkier designs with larger volume and surface footprint.
Dynamic Simulation Results
Three different OTSG designs are chosen for further analysis via dynamic simulations: light OTSG 19.05 mm or ¾″ (LD), normal design 25.4 mm or 1″ (ND), and heavy design 38.1 mm or 1 + 1/2″ (HD). More detailed results of thermodynamic optimization for the steam cycle and heat exchangers geometry for these three designs are shown in Supplementary Table S8.
Scenario 1 Results: Gas Turbine Load Changes Around Typical Operating Point
Figure 8 shows the dynamic simulation results for Scenario 1, consisting of a sudden +/−5% change in GT exhaust mass flow rate and gas temperature around 85% GT load. Scenario 1A (S1A) inputs and dynamic response are presented in Figure 8 as black colored lines, whereas the Scenario 1B (S1B) data are presented in Figure 8 as red colored lines. The process variables shown are a) GT exhaust gas flow rate and temperature; b) feedwater mass flow rate and live steam mass flow rate; and c) live steam temperature and heat transfer in OTSG. The GT load change is applied at time t = 0, using the optimized OTSG geometry with 1″ tubes (refer to Figure 6 and Supplementary Table S8).
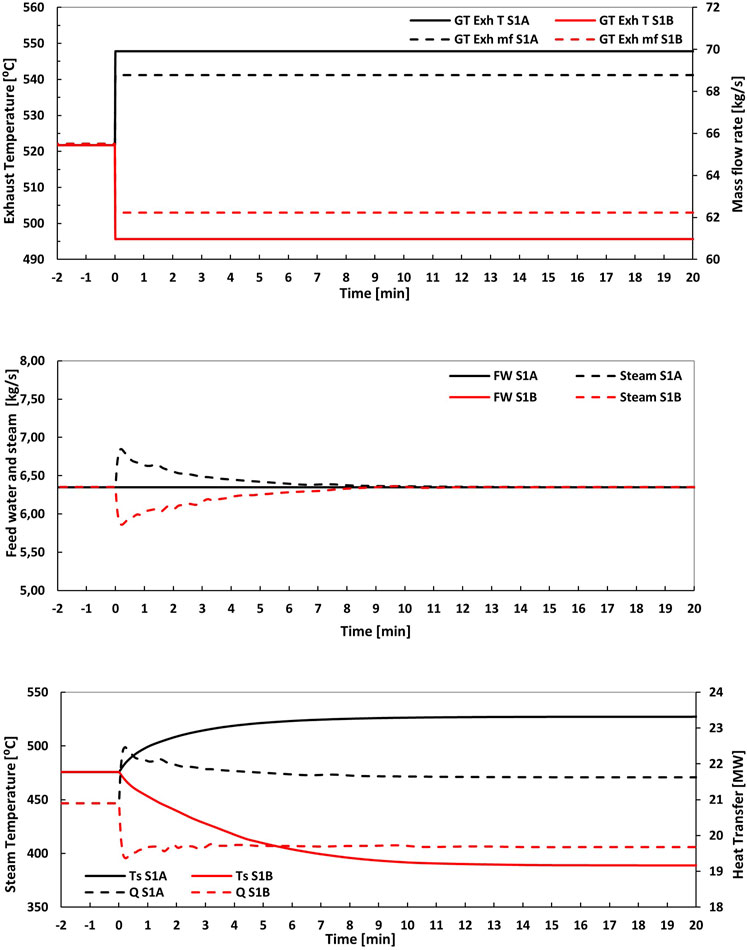
FIGURE 8. Dynamic simulation results for Scenario 1. The process variables shown are (A) exhaust gas mass flow rate and temperature; (B) feedwater mass flow rate FW and live steam mass flow rate Steam; and (C) live steam temperature Ts and total heat transfer Q in OTSG.
The results in Figure 8B show that when increasing GT exhaust mass flow rate and temperature simultaneously (S1A), an overgeneration of steam is observed during transient conditions. The amount of steam generated is larger than the feedwater being fed to the OTSG, and stabilizes under the new steady-state condition after around 8 min. Figure 8B shows the feedwater and live steam when decreasing exhaust mass flow rate and temperature simultaneously (S1B), with a similar trajectory but with an underproduction of steam with respect to water fed to the OTSG during the load change. In S1B the fluid side of the steam mass flow rate reaches steady state as well after around 8 min. Temperature and heat transfer are shown in Figure 8C. The results in Figure 8C show that heat transfer peak drives live steam temperature up. This is, when increasing exhaust mass flow rate and temperature simultaneously keeping feedwater mass flow rate constant, the live steam temperature increases. The stabilization time is ca. 9 min for live steam temperature for S1A and 11.5 min for S1B. Therefore, there is a difference in stabilization time observed when increasing GT load and when decreasing GT load. The live steam temperature at the outlet of the OTSG exhibits a nonlinear dynamic response under disturbance in GT load. This is, increasing load can result in faster transients (reach stabilization in a shorter elapsed time) than when decreasing GT load. Note that in real applications and depending on operating point and GT characteristics and controls, the exhaust mass flow rate could increase while the temperature decreases when increasing GT load and vice versa.
Scenario 2 Results: Load Changes and Influence of Once-Through Steam Generation Design on Dynamic Response
Figure 9 shows the dynamic simulation results for Scenario 2, consisting of GT load change in the operating window between 100% GT load and 60% GT load, according to the GT characteristics in Table 1. Scenario 2A (S2A) is presented in Figures 9A,C,E and consists of load change from 100% GT load to 60% GT load. Scenario 2B (S2B) is presented in Figures 9B, D, F and is based on GT load change from 60% GT load to 100% GT load. The process variables shown are a, b) exhaust gas flow rate and temperature; c, d) feedwater flow rate and live steam mass flow rate; e, f) live steam temperature out of OTSG. The results present the dynamic response of three different OTSG designs: light, normal, and heavy (refer to Supplementary Table S8 and Figure 6). The disturbance is applied at time t = 0.
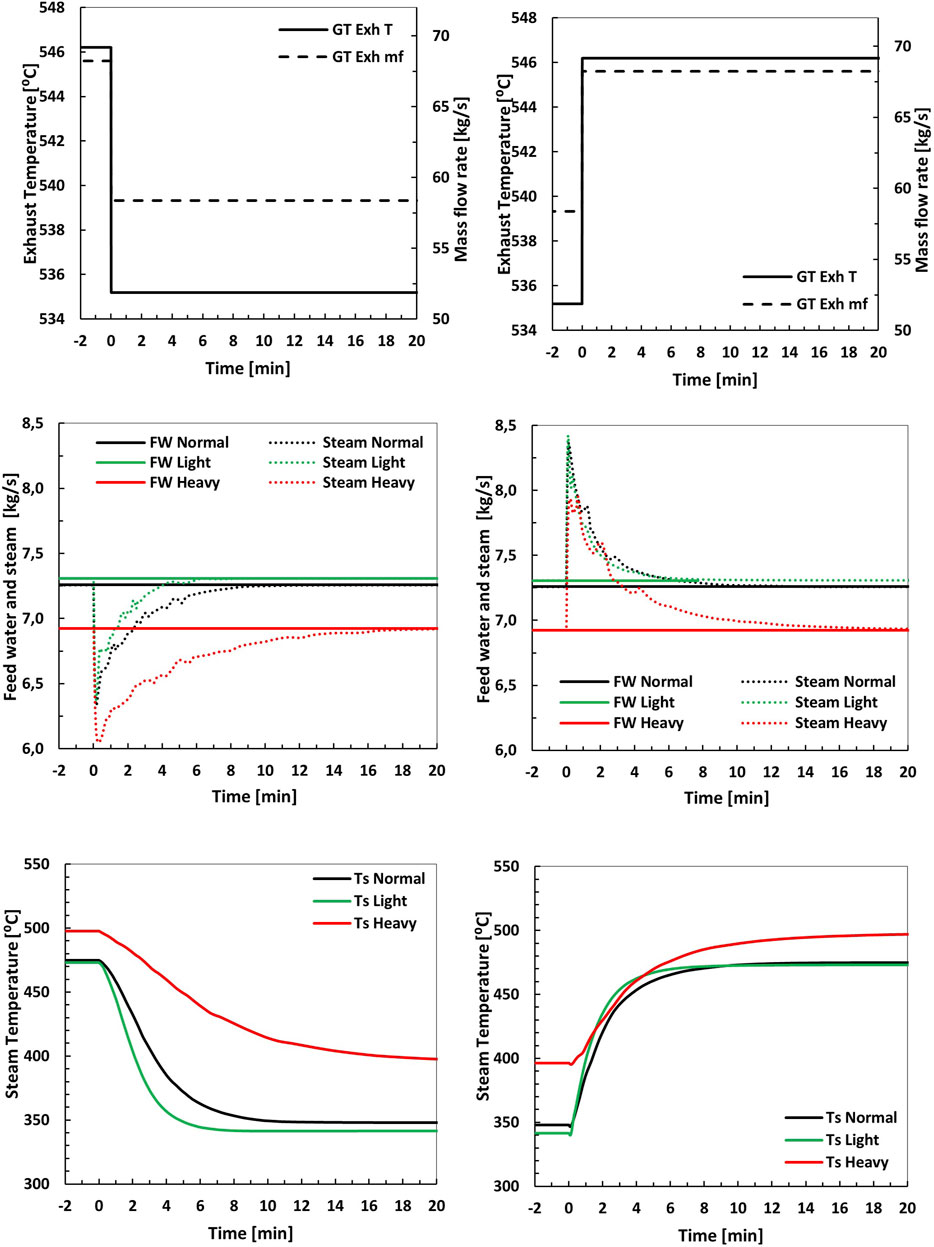
FIGURE 9. Dynamic simulation results for Scenario 2. The process variables shown are (A, B) exhaust gas flow rate and temperature; (C, D) feedwater flow rate and live steam mass flow rate; and (E, F) live steam temperature.
The results in Figure 9C show that when decreasing GT exhaust mass flow rate and temperature simultaneously (S2A), under-generation of steam is observed during transient conditions. This is consistent with the responses observed in Scenario 1. The amount of steam generated is smaller than the feedwater being fed to the OTSG, and stabilizes under the same steady-state condition after ca. 6–18 min depending on OTSG design (6 min for Light design, 10 min for Normal design, and ca. 18 min for Heavy design). Figure 9D also shows the feedwater and live steam mass flow rate when increasing GT exhaust mass flow rate and temperature simultaneously (S2B). The results show an overproduction of steam during transient conditions. The stabilization time of live steam flow rate in Scenario S2B varies from 6 to 18 min depending on OTSG design.
Figure 9E shows the live steam temperature trajectory when decreasing GT load in Scenario S2A. The results show that the stabilization time varies from ca. 6 to 18 min for live steam temperature, depending on OTSG design. In Scenario S2B, when increasing GT load the live steam temperature trajectory stabilizes in 6–18 min depending on OTSG design (6 min for Light design, 10 min for Normal design, and ca. 18 min for Heavy design). Smaller size or tube diameter and smaller water inventory contributes to faster response for the same GT load change. More compact and lighter designs respond faster to changes in the GT load. This has significant implications on control and stability of the power generation from waste heat recovery since live steam temperature and steam flow rate is a key variable affecting power output from the turbine.
Scenario 3 Results: Feedforward Control of Feedwater Flow Rate and Varying Load Ramp Rates
Figure 10 presents the dynamic simulation results for Scenarios S3A, S3B, S3C, and S3D. These scenarios simulate a control structure in which transients are dealt with by changing the feedwater flow rate set point to a predicted value based on the GT exhaust temperature and flow rate. Scenarios S3A and S3B study the dynamic effect of a step change in GT load and feedwater flow rate. Scenarios 3C (load decrease 100–60%) and S3D (load increase 60–100%) analyze the effect of ramp-rate on dynamic behavior of the OTSG, for GT load change with ramp rates 2%/min and 20%/min, when the feedwater mass flow rate is changed at the same rate as the GT load. The process variables shown are a, b) exhaust gas flow rate and temperature; c, d) feedwater mass flow rate and live steam mass flow rate; and e, f) live steam temperature out of OTSG. The simulation results shown in Figure 10 are run with the Normal OTSG design.
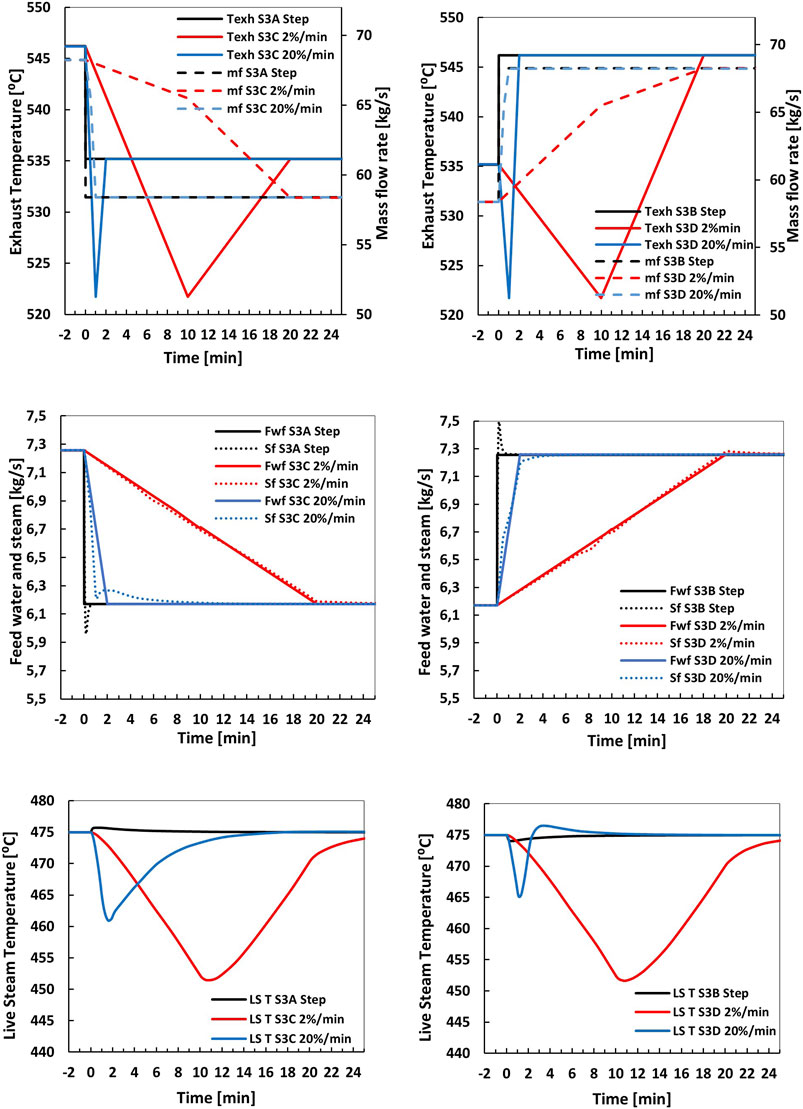
FIGURE 10. Dynamic simulation results for Scenario 3. The process variables shown are (A, B) exhaust gas flow rate and temperature; (C, D) feedwater flow rate and live steam mass flow rate; and (E, F) live steam temperature. The simulation results shown for the “Normal” OTSG design.
The results in Figure 10C show the feedwater flow rate and the transient response of steam mass flow rate to GT load changes described in Scenario 3. An under-shoot of steam is observed during transient conditions for Scenario S3A. The steam generated stabilizes in 1.5 min for S3A, which is faster than when the feedwater flow rate is kept constant (ca. 10 min in S2A). Even if in practice step change in feedwater flow rate cannot be applied, this shows the potential of applying feedforward to reach faster stabilization of OTSG operation and live steam temperature. Figure 10C shows how slower ramp rate leads to larger stabilization of steam flow rate. At a rate of change of 2%/min GT load, the response time of the steam flow rate becomes quasy-static and follows the feedwater flow rate (input) tightly. Figure 10D also shows the feedwater and live steam mass flow rate when increasing GT exhaust mass flow rate and temperature simultaneously (S3B). The results show an overproduction of steam during transient conditions when fast changes are applied (S3B) while the response time of the steam flow rate becomes quasy-static at 2%/min load change in S3D and follows the feedwater flow rate (input) tightly.
Figure 10E shows the live steam temperature trajectory when decreasing GT load in scenarios S3A and S3C. The results show that the slower the rate of change in load, the larger the undershoot in steam temperature. The results in Figure 10E show that if fast action is taken to manipulate feedwater flow rate the steam temperature at the outlet of the OTSG is tightly controlled and kept close to target outlet set point during transients. However, if the GT load change is slower (larger ramp rate) the live steam temperature follows tightly the GT exhaust temperature characteristic at the inlet of the OTSG (refer to Figure 10A), with a relatively larger undershoot (refer to steam temperature with 2%/min rate of change in S3C).
Figure 10F shows the live steam temperature trajectory when increasing GT load in scenarios S3B and S3D. The results show that the slower the rate of change in load, the larger the undershoot in steam temperature. The undershoot here is explained by the GT turbine temperature characteristics. As when decreasing load, the live steam temperature is very sensitive to changes in GT flow rate and temperature. The results in Figure 10F show that if fast action is taken to manipulate feedwater flow rate the steam temperature at the outlet of the OTSG is tightly controlled and kept close to target outlet set point during transients. However, if the GT load change is slower (larger ramp rate) the live steam temperature follows tightly the GT exhaust temperature characteristic at the inlet of the OTSG (refer to Figure 10A), with a larger undershoot. Figure 10F also shows the nonlinearity of the system, for S3D with 20%/min rate of change an oscillatory response around the final steady-state value is observed.
Figure 11 shows the simulation results of settling times of live steam temperature trajectory for Scenarios 2 and 3, in which GT load change is applied in the operating window between 100% GT load and 60% GT load. Settling times are defined here as the time required for the response curve to reach and stay within a range of +/−2.5°C of the final steady-state value. Focusing for example on S2A, it is clear that heavier designs lead to significantly larger settling time, 18 min for heavier OTSG design compared to ca. 6 min for the light OTSG design. This observation is valid for all the scenarios, where heavier designs driven by larger tube diameter lead to relatively larger settling time for live steam temperature, regardless of the disturbances applied.
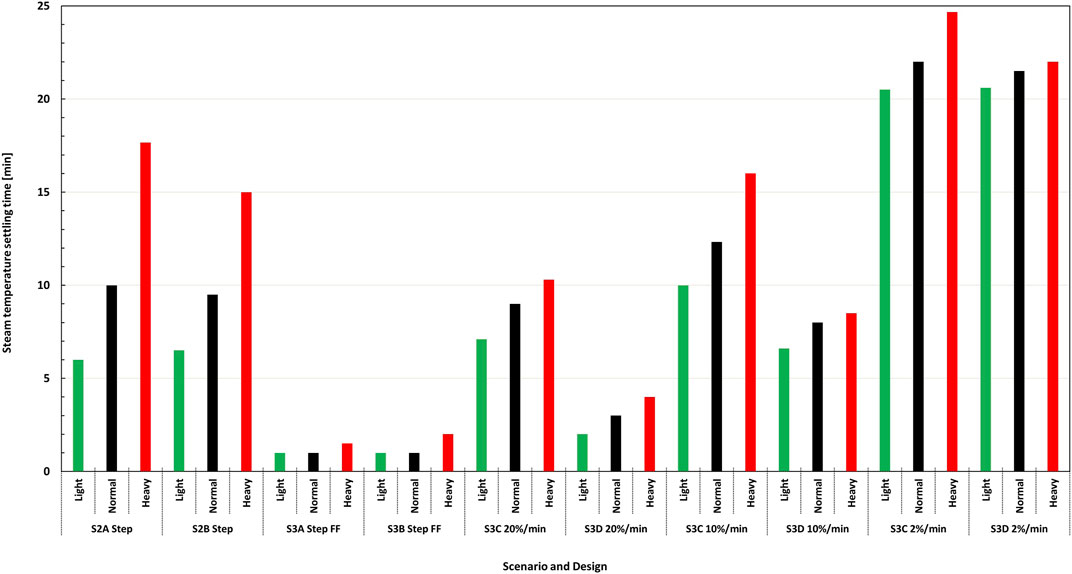
FIGURE 11. Steam outlet temperature settling times for Scenarios 2 and 3 defined in Table 4, representing changes in GT load between 100% GT load and 60% GT load. The results also include settling times for different OTSG designs (Light, Normal, and Heavy).
When comparing S2A with S3A, the results in Figure 11 show faster live steam stabilization when using feedforward action for changing feedwater mass flow rate for controlling live steam temperature (in S3A). It is also observed that, in general, for the same designs, the settling times of steam temperature are faster for increasing load change scenarios (S2B, S3B, and S3D) than for decreasing load change scenarios (S2A, S3A, and S3C). For example, the steam temperature settling time for the Normal design in S3C with GT ramp rate load decrease at a rate of 20%/min is 9 min, while in the similar S3D with 20%/min GT load increase the steam temperature settling time is ca. 3 min. In most cases, reaching stabilization when ramping up is ca. 2 or 3 times faster than ramping down. This means that stabilization can be potentially reached faster when increasing GT load than when decreasing GT load.
Figure 11 also shows the simulation results of settling times of live steam temperature trajectory for various GT load change ramp rates for scenarios S3C and S3D: 20, 10, and 2%/min. The results show that the faster the ramp rate in change of GT load and feedwater mass flow rate, the faster (smaller) the settling time for live steam temperature. For the Light OTSG design, the settling time in live steam temperature ranges from 7.1 to 20.5 min for S3C and from 2 to 20.5 for S3D; for the Normal OTSG design the settling time in live steam temperature ranges from 9 to 22 min for S3C and from 3 to 21 min for S3D; and for the Heavy OTSG design, the settling time in live steam temperature ranges from 10.3 to 24.6 min for S3C and from 4 to 22 min for S3D. The slower the ramp rate (2%/min) the less pronounced differences in settling times of life steam temperature settling time in different designs, as the disturbance applied is so slow in rate of change that the OTSG approaches quasy-static performance.
While this work focuses on transients and dynamic response as significant constraints for flexibility, spatial gradients in thick-walled components are as well relevant as they might lead to excessive thermal stresses that can reduce component lifetime and also limit ramp rates of thermal power plants during flexible operation. A key component limiting ramp rates in thermal power plants is, for example, the steam turbine rotor and its temperature spatial gradients during transients (Gülen Can and Kim, 2014). In addition, it is worth noting that while feedforward control will be required to reach fast stabilization, it might be challenging to obtain the optimal maps for implementing the feedforward algorithm in a real OTSG. If many tests on the real system are required, or advanced process simulations are needed in advance for practical implementation, it can pose a challenge for operators to implement this control strategy effectively.
Conclusion
This article presents a case study for gas turbine (GT) exhaust heat recovery on an off-shore platform in the Norwegian Continental Shelf. The methods applied consist of a bottoming cycle design optimization accounting for the cycle state points and the heat exchanger size and geometry, and transient analyses of optimized once-through steam generators (OTSGs). OTSGs are required for achieving compact and low-weight steam bottoming cycle systems. The main conclusions are:
• The results from the design optimizations indicate that the OTSG weight increases with increasing tube diameter. This means that small OTSG tubes are a key driver for designing steam bottoming cycles of sufficient low weight and compactness for off-shore applications.
• The transient analyses demonstrated a positive correlation between the live steam temperature settling time and the tube diameter. This means that a lightweight OTSG design with small tubes has a faster dynamic response than conventional OTSGs with larger tubes. If fast stabilization time is required, this means that more compact and lightweight OTSGs are easier to control than heavier and slower OTSG designs. However, the issue on faster stabilization being positive or required for controllability must be evaluated on a case-by-case basis considering the overall power unit system controls and requirements.
• The results show that the OTSG respond faster to GT load increase compared to a GT load decrease of similar magnitude, illustrating the nonlinear dynamic response of the OTSG with respect to GT-load changes.
• The simulation results with a feedforward control strategy demonstrated shorter live steam temperature settling times and less over/under shooting compared to corresponding simulations without feedwater control.
The transient simulations show that feedforward is required for OTSG live steam temperature controls, both to reach desired steady-state live steam temperature at different loads and for faster stabilization. However, it could be challenging for operators to implement feedforward algorithms in a real OTSG.
Data Availability Statement
The original contributions presented in the study are included in the article/Supplementary Material; further inquiries can be directed to the corresponding author.
Author Contributions
RM contributed to conceptualization, data curation, formal analysis, investigation, methodology and dynamic model development, data visualization and writing of original draft; GS contributed to conceptualization, data curation, investigation methodology and design optimization models development, software development and supplementary material preparation, validation and visualization, writing—review and editing; BH contributed to methodology model development and writing—review and editing; DR contributed to methodology and software development by linking output data from design models as the inputs to dynamic model parametrization, writing—review and editing, and project administration.
Funding
The funding source for this work is PETROMAKS2, Grant Number #280713.
Conflict of Interest
The authors declare that the research was conducted in the absence of any commercial or financial relationships that could be construed as a potential conflict of interest.
Acknowledgments
The authors would like to acknowledge Conocophillips Scandinavia AS, Equinor Energy AB, NTNU, SINTEF, and the Research Council of Norway, strategic Norwegian research program PETROMAKS2 (#280713), for their support. The authors acknowledge Goran Durakovic for his contribution to the case study definition in the off-shore platform and early design optimization model development.
Supplementary Material
The Supplementary Material for this article can be found online at: https://www.frontiersin.org/articles/10.3389/fenrg.2021.687248/full#supplementary-material
Footnotes
1Gas pipe: Mass-fraction, and energy balance equations are discretized with the finite volume method. State variables are one lumped pressure p, n temperatures Tg, mass fractions and trace concentrations in flue gas (Xg). Water pipe: Mass-fraction, and energy balance equations are discretized with the finite volume method. State variables are one lumped pressure p, n enthalpies hfn, mass fractions and trace concentrations in flue gas (Xf,j). Wall model: 1-dimension model of a metal wall where the heat capacity is lumped at the center of the wall. The figure here is an example with n = 4.
References
Alobaid, F., Mertens, N., Starkloff, R., Lanz, T., Heinze, C., and Epple, B. (2017). Progress in Dynamic Simulation of Thermal Power Plants. Prog. Energ. Combustion Sci. 59 (March), 79–162. doi:10.1016/J.PECS.2016.11.001
Alobaid, F., Starkloff, R., Pfeiffer, S., Karner, K., Epple, B., and Kim, H.-G. (2015). A Comparative Study of Different Dynamic Process Simulation Codes for Combined Cycle Power Plants - Part B: Start-Up Procedure. Fuel 153, 707–716. doi:10.1016/j.fuel.2015.02.011
Benato, A., Pierobon, L., Haglind, F., and Stoppato, A. (2014). “Dynamic Performance of a Combined Gas Turbine and Air Bottoming Cycle Plant for Off-Shore Applications,” in Volume 2: Dynamics, Vibration and Control; Energy; Fluids Engineering; Micro and Nano Manufacturing, ASME 2014 12th Biennial Conference on Engineering Systems Design and Analysis, July 25-27 (Copenhagen, DenmarkAmerican Society of Mechanical Engineers (ASME)). doi:10.1115/ESDA2014-20105
Bennett, D. L., Chen, J. C., Bennett, D. L., and Chen, J. C. (1980). Forced Convective Boiling in Vertical Tubes for Saturated Pure Components and Binary Mixtures. AIChe J. 26 (3), 451–461. doi:10.1002/aic.690260317
Brady, M. F. (2001). Design Aspects of once through Systems for Heat Recovery Steam Generators for Base Load and Cyclic Operation. Mater. High Temperatures 18 (4), 223–229. doi:10.1179/mht.2001.024
Briggs, D. E., and Young, E. H. (1963). Convection Heat Transfer and Pressure Drop of Air Flowing across Triangular Pitch Banks of Finned Tubes. Chem. Eng. Prog. Symp. Ser. 59 (41), 1–10.
Dechamps, P. J. (1995). Modelling the Transient Behaviour of Heat Recovery Steam Generators. Proc. Inst. Mech. Eng. A: J. Power Energ. 209 (4), 265–273. doi:10.1243/pime_proc_1995_209_005_01
Deng, H., Skaugen, G., Næss, E., Zhang, M., and Øiseth, O. (2021). A Novel Methodology for Design Optimization of Heat Recovery Steam Generators Withflow-Induced Vibration Analysis. Energy 226, 120325. doi:10.1016/j.energy.2021.120325
Dumont, M., and Heyen, G. (2004). Mathematical Modelling and Design of an Advanced Once-Through Heat Recovery Steam Generator. Comput. Chem. Eng. 28 (5), 651–660. doi:10.1016/j.compchemeng.2004.02.034
Encabo, I., Montañés, R. M., and Nord, L. O. (2018). Flexible Operation of Combined Cycle Gas Turbine Power Plants with Supplementary Firing. J. Power Tech. 98 (8), 188–197.
Ganapathy, V. (2003). Industrial Boilers and Heat Recovery Steam Generators. Design, Applications, and Calculations. New York, USAAG: Marcel Dekker.
Gnielinski, V. (1976). New Equations for Heat and Mass-Transfer in Turbulent Pipe and Channel Flow. Int. Chem. Eng. 16 (2), 359–368.
Gülen Can, S., and Kim, K. (2014). Gas Turbine Combined Cycle Dynamic Simulation: A Physics Based Simple Approach. ASME. J. Eng. Gas Turbines Power 136 (1), 011601. doi:10.1115/1.4025318
Jensen, J. M., and Tummescheit, H. (2002). “Moving Boundary Models for Dynamic Simulations of Two-phase Flow,” in 2nd International Modelica Conference, March 18-19, 2002, Germany, 235–244. Available at: https://modelica.org/events/Conference2002/papers/p31_Jensen.pdf.
Kim, T. S., Lee, D. K., and Ro, S. T. (2000). Dynamic Behaviour Analysis of a Heat Recovery Steam Generator during Start-Up. Int. J. Energ. Res. 24, 137–149. doi:10.1002/(sici)1099-114x(200002)24:2<137::aid-er568>3.0.co;2-0
Lecompte, S., Huisseune, H., van den Broek, M., Vanslambrouck, B., and De Paepe, M. (2015). Review of Organic Rankine Cycle (ORC) Architectures for Waste Heat Recovery. Renew. Sustain. Energ. Rev. 47 (July), 448–461. doi:10.1016/J.RSER.2015.03.089
Pierobon, P. (2015). Novel Design Methods and Control Strategies for Oil and Gas Offshore Power Systems. Technical University of Denmark. Available at: https://orbit.dtu.dk/en/publications/novel-design-methods-and-control-strategies-for-oil-and-gas-offsh (Accessed March 15, 2021).
Mazzetti, M. J., Nekså, P., Walnum, H. T., and Hemmingsen, A. K. T. (2014b). Energy-Efficiency Technologies for Reduction of Offshore CO2 Emissions. Oil Gas Facil. 3 (01), 89–96. doi:10.2118/169811-PA
Mazzetti, M. J., Ladam, Y., Walnum, H. T., Hagen, B. L., Skaugen, G., and Nekså, P. (2014a). “Flexible Combined Heat and Power Systems for Offshore Oil and Gas Facilities with CO2 Bottoming Cycles,” in American Society of Mechanical Engineers, ASME 2014 Power Conference, July 28-31, 2014 (Baltimore, MA: Power Division (Publication) POWER). doi:10.1115/POWER2014-321692
Modelon, A. (2020). Thermal Power Libray - Documentation. Available at: https://www.modelon.com/library/thermal-power-library/ (Accessed March 15, 2021).
Nami, H., Ertesvåg, I. S., Agromayor, R., Riboldi, L., and Nord, L. O. (2018). Gas Turbine Exhaust Gas Heat Recovery by Organic Rankine Cycles (ORC) for Offshore Combined Heat and Power Applications - Energy and Exergy Analysis. Energy 165 (December), 1060–1071. doi:10.1016/J.ENERGY.2018.10.034
Nguyen, T-V., Tock, L., Breuhaus, P., Maréchal, F., and Elmegaard, B. (2014b). Oil and Gas Platforms with Steam Bottoming Cycles: System Integration and Thermoenvironomic Evaluation. Appl. Energ. 131 (October), 222–237. doi:10.1016/J.APENERGY.2014.06.034
Nguyen, T.-V., Tock, L., Breuhaus, P., Maréchal, F., and Elmegaard, B. (2014a). Thermo-Economic Modelling and Process Integration of CO2-Mitigation Options on Oil and Gas Platforms. Chem. Eng. Trans. 39 (Special Is), 1081–1086. doi:10.3303/CET1439181
Nord, L., and Bolland, O. (2012). Steam Bottoming Cycles Offshore - Challenges and Possibilities. J. Power Tech. 92 (3), 201–207.
Nord, L. O., Martelli, E., and Olav, B. (2014). Weight and Power Optimization of Steam Bottoming Cycle for Offshore Oil and Gas Installations. Energy 76 (November), 891–898. doi:10.1016/J.ENERGY.2014.08.090
Nord, L. O., and Montañés, R. M. (2018). Compact Steam Bottoming Cycles: Model Validation with Plant Data and Evaluation of Control Strategies for Fast Load Changes. Appl. Therm. Eng. 142 (September), 334–345. doi:10.1016/j.applthermaleng.2018.07.012
Nord, L. O., and Olav, B. (2013). Design and Off-Design Simulations of Combined Cycles for Offshore Oil and Gas Installations. Appl. Therm. Eng. 54 (1), 85–91. doi:10.1016/j.applthermaleng.2013.01.022
Norsk Olje Og Gass, Environmental Report, (2018) (n.d.). Norsk Olje Og Gass, Environmental Report (2018). Available at: https://www.norskoljeoggass.no/globalassets/dokumenter/miljo/miljorapporter/environmental-report-2018.pdf (Accessed March 15, 2021).
Païdoussis, M. P. (2006). Real-Life Experiences with Flow-Induced Vibration. J. Fluids Structures 22 (6–7), 741–755. doi:10.1016/j.jfluidstructs.2006.04.002
Pierobon, L., Casati, E., Casella, F., Haglind, F., and Colonna, P. (2014b). Design Methodology for Flexible Energy Conversion Systems Accounting for Dynamic Performance. Energy 68 (April), 667–679. doi:10.1016/J.ENERGY.2014.03.010
Pierobon, L., and Haglind, F. (2014). Design and Optimization of Air Bottoming Cycles for Waste Heat Recovery in Off-Shore Platforms. Appl. Energ. 118 (0), 156–165. doi:10.1016/j.apenergy.2013.12.026
Pierobon, L., Nguyen, T-V. V., Larsen, U., Haglind, F., and Elmegaard, B. (2013). Multi-Objective Optimization of Organic Rankine Cycles for Waste Heat Recovery: Application in an Offshore Platform. Energy 58 (0), 538–549. doi:10.1016/j.energy.2013.05.039
Pierobon, L., Benato, A., Scolari, E., Haglind, F., and Stoppato, A. (2014a). Waste Heat Recovery Technologies for Offshore Platforms. Appl. Energ. 136 (December), 228–241. doi:10.1016/J.APENERGY.2014.08.109
Quoilin, S., Aumann, R., Grill, A., Schuster, A., Lemort, V., and Spliethoff, H. (2011). Dynamic Modeling and Optimal Control Strategy of Waste Heat Recovery Organic Rankine Cycles. Appl. Energ. 88 (6), 2183–2190. doi:10.1016/j.apenergy.2011.01.015
Riboldi, L., and Nord, L. O. (2017b). Concepts for Lifetime Efficient Supply of Power and Heat to Offshore Installations in the North Sea. Energ. Convers. Manage. 148 (September), 860–875. doi:10.1016/J.ENCONMAN.2017.06.048
Riboldi, L., and Nord, L. O. (2017a). Lifetime Assessment of Combined Cycles for Cogeneration of Power and Heat in Offshore Oil and Gas Installations. Energies 10 (6), 744. doi:10.3390/en10060744
Schittkowski, K. (1986). {NLPQL}: A Fortran Subroutine Solving Constrained Nonlinear Programming Problems. Ann. Operations Res. 5 (1), 485–500.
Skaugen, G., Walnum, H. T., Hagen, B. A. L., Clos, D. P., Mazzetti, M. J., and Nekså, P. (2014). “Design and Optimization of Waste Heat Recovery Unit Using Carbon Dioxide as Cooling Fluid,” in American Society of Mechanical Engineers, ASME 2014 Power Conference, July 28-31 (Baltimore, MA: Power Division (Publication) POWER), 1. doi:10.1115/POWER2014-32165
STEELTUBE (2021). “Dimensions and Weights of Seamless Tubes According to Standard ANSI/ASME B36.10M.” 2021 (West Midlands, UK: CMT Engineering Ltd).
Systèmes, D. (2019). DYMOLA Systems Engineering. Multi-Engineering Modeling and Simulation Based on Modelica and FMI. Available at: https://www.3ds.com/products-services/catia/products/dymola/ (Accessed March 15, 2021).
Tchanche, B. F., Lambrinos, G., Frangoudakis, A., and Papadakis, G. (2011). “Low-Grade Heat Conversion into Power Using Organic Rankine Cycles – A Review of Various Applications. Renew. Sustain. Energ. Rev. 15 (8), 3963–3979. doi:10.1016/J.RSER.2011.07.024
Temraz, A., Alobaid, F., Lanz, T., Ahmed, E., and Epple, B. (2020). Operational Flexibility of Two-phase Flow Test Rig for Investigating the Dynamic Instabilities in Tube Boiling Systems. Front. Energ. Res. 8, 517740. doi:10.3389/fenrg.2020.517740
Tummescheidt, H. (n.d.). Design and Implementation of Object-Oriented Model Libraries Using Modelica. Lund University. Available at: https://lup.lub.lu.se/search/publication/4abd7220-8f4b-48df-bb2d-77a2dda579f9 (Accessed March 15, 2021).
Vampola, K. (1966). Heat Transfer and Pressure Drop for Gas Flowing over Finned Tube Bundles. Strojienstv, 501–507.
Vidoza, J. A., Andreasen, J. G., Haglind, F., dos Reis, M. M. L., and Gallo, W. (2019). Design and Optimization of Power Hubs for Brazilian Off-Shore Oil Production Units. Energy 176 (June), 656–666. doi:10.1016/J.ENERGY.2019.04.022
Walnum, H. T., Nekså, P., Nord, L. O., and Andresen, T. (2013). Modelling and Simulation of CO2 (Carbon Dioxide) Bottoming Cycles for Offshore Oil and Gas Installations at Design and Off-Design Conditions. Energy 59 (September), 513–520. doi:10.1016/J.ENERGY.2013.06.071
Wei, D., Lu, X., Lu, Z., and Gu, J. (2008). Dynamic Modeling and Simulation of an Organic Rankine Cycle (ORC) System for Waste Heat Recovery. Appl. Therm. Eng. 28 (10), 1216–1224. doi:10.1016/J.APPLTHERMALENG.2007.07.019
Keywords: energy efficiency, waste heat recovery (WHR), process optimization, once-through steam generator, gas turbine (GT), offshore energy, flexibility, dynamics
Citation: Montañés RM, Skaugen G, Hagen B and Rohde D (2021) Compact Steam Bottoming Cycles: Minimum Weight Design Optimization and Transient Response of Once-Through Steam Generators. Front. Energy Res. 9:687248. doi: 10.3389/fenrg.2021.687248
Received: 29 March 2021; Accepted: 17 May 2021;
Published: 15 June 2021.
Edited by:
Emanuele Martelli, Politecnico di Milano, ItalyReviewed by:
Sergio Fabian Mussati, CONICET Santa Fe, ArgentinaXiaoya Li, University of Science and Technology of China, China
Alberto Traverso, University of Genoa, Italy
Copyright © 2021 Montañés, Skaugen, Hagen and Rohde. This is an open-access article distributed under the terms of the Creative Commons Attribution License (CC BY). The use, distribution or reproduction in other forums is permitted, provided the original author(s) and the copyright owner(s) are credited and that the original publication in this journal is cited, in accordance with accepted academic practice. No use, distribution or reproduction is permitted which does not comply with these terms.
*Correspondence: Rubén M. Montañés, cnViZW4ubW9jaG9saS5tb250YW5lc0BzaW50ZWYubm8=