 F. Mohammadhasani
 A. Pirouzmand
- 1Department of Nuclear Engineering, School of Mechanical Engineering, Shiraz University, Shiraz, Iran
- 2Safety Research Center, Shiraz University, Shiraz, Iran
The risk-based maintenance strategy has received special attention in the safe operation of nuclear power plants. Simultaneous quantification of the positive and negative effects of maintenance activities and components degradation effect makes it possible to accurately evaluate the risk criterion for safety systems of nuclear power plants. However, it is difficult to integrate the effects of maintenance and components degradation into the standard reliability approaches. A straightforward approach for considering components degradation and different maintenance policies is to make use of Markov maintenance models. In this article, the effectiveness of maintenance activities (including changes in the surveillance test intervals and alteration in the different maintenance policies) on the components unavailability with considering aging effects is quantified using Markov maintenance models and then by coupling these models and the fault tree method, the risk measure is upgraded from the component level to the system level. The proposed models are applied to evaluate the unavailability of two safety systems of VVER-1000/V446 nuclear power plants as case studies. The results show that the Markov method due to its multi-state nature is effective in the conservative evaluation of risk measures so that the unavailability computed by the coupling process is higher than the original unavailability (calculated by system fault tree using PSA data of nuclear power plants) for all maintenance policies. In addition, this study illustrates that the developed Markov maintenance models could be applied to the large-scale whole plant level and provides a proper transition from the classical PSA methods to new techniques. This approach integrates the effects of maintenance strategies and components degradation. Also, it provides a practical and a more accurate tool to determine the technical specification of a real nuclear power plant from the risk point of view.
Introduction
The unexpected failures, the downtime associated with such failures, the loss of production, and higher maintenance costs are among the major issues in the nuclear industry (Krishnasamy et al., 2005). Therefore, it is necessary to identify the failure as soon as possible to avoid inconvenience in the nuclear power plant (NPP) system (Maitloa et al., 2020). Fault diagnosis systems are widely applied to guarantee the safety of nuclear power plants (Ma and Jiang, 2011; Ayodeji and Liu, 2018; Ayodeji and Liu, 2018; Gong et al., 2018; Wu et al., 2018; Maitloa et al., 2020). The fault detection and diagnosis (FDD) methods are categorized into the fuzzy logic method (FLM), model-based methods (MBMs), data-driven methods (DDMs), and sensor fault detection and diagnosis method (SFDDM). While the practical applications of MBMs, DDMs, and SFDDM are extremely limited, the FLM is used for the operation key of the NPP (Maitloa et al., 2020). Indeed, practical applications of model-based FDD methods are very limited due to the requirement of an accurate model that is always hard to obtain in practice. Data-driven FDD methods also rely on relationships between correlated measurements within a system. In this regard, one needs to formulate the relationships using certain ways that require data obtained during normal operations of NPP (Ma and Jiang, 2011). Also, SFDDM does not give appropriate accuracy compared with other methods of FDD (Maitloa et al., 2020).
Along with the interest in using FDD methods to improve safety, reliability, and availability of NPPs (Ma and Jiang, 2011), over the recent decades, there has been a growing interest in NPPs to develop maintenance approaches to attain the highest level of availability and safety (Kancev and Cepin, 2011; Hellmich and Berg, 2014; Kim et al., 2015; Shin et al., 2015; Soares et al., 2015; Kolykhanov and Kozlov, 2018; Ngarayana et al., 2019; Zhang et al., 2019; Gohel et al., 2020; Mohammadhasani and Pirouzmand, 2020).
Nuclear power industries have increasing interest in using maintenance activities in the form of risk-based models. A risk-based maintenance (RBM) approach helps toward designing an alternative strategy for minimizing the risks emanating from breakdowns or failures (Krishnasamy et al., 2005). Over the recent decades, the deterministic test and maintenance (T and M) strategy models are increasingly supported, especially those based on risk measures (Kancev and Cepin, 2011). Adopting a risk-based T and M strategy is an essential step toward evaluating the effects of maintenance activities (MAs) on risk measures at both the component level and the system level. In this context, the question of quantifying the effects of maintenance strategies on risk measures has been discussed repeatedly in the literature (Vesely and Rezos, 1995; Baraldi et al., 2011; Kumar et al., 2012; Veeramany, 2012; Joel and Kumar, 2014; Zio and Compare, 2013; Kumar et al., 2018; Kumar and Joel, 2018). In this regard, both the positive and the negative aspects of MAs should be quantified (Vesely and Rezos, 1995), thereby optimizing the MAs to reduce the risks or increase the availability of safety systems.
Such standard probabilistic risk assessment (PRA) approaches as the fault tree (FT) method is by far the most popular approach in dealing with PRAs (Bucci et al., 2008). In developing an FT analysis, all potential causes of a specified system failure are investigated. As a result, the construction of a fault tree will provide the analyst with a better understanding of the potential causes of a system failure. Nevertheless, concerns have been raised in the literature with regard to the potential limitations of FTs (Andow, 1981; March-Leuba et al., 1984; Aldemir, 1989; Hassan and Aldemir, 1990; Aldemir and Siu, 1996; Bucci et al., 2008). Some of these limitations are related to modeling complex maintenance strategies. In fact, a static FT method, due to hidden failures, can either underestimate or overestimate the unavailability of a system, and when the system comprises many trains, the computational errors increase (Kancev and Cepin, 2011; Hellmich and Berg, 2014).
Furthermore, it is difficult to integrate the effects of maintenance strategy and components degradation into the FT model (Kancev and Cepin, 2011). In fact, the FT method assumes two states for each component, that is, a success state and a failure state. Owing to these assumptions, only the negative aspects of MAs can explicitly be quantified, that is, the effects of maintenance downtime and possible maintenance-related errors. The benefits of maintenance strategies cannot be explicitly quantified since a major yield of the maintenance is to prevent and correct degradations before the occurrence of a failure. Degraded component conditions are not taken into account in standard PRA modeling, and hence, the advantage of maintenance in correcting degraded conditions is not explicitly considered.
To assess multistate systems reliability, many approaches, including the Monte Carlo method, universal generating function approach, semi-Markov model, etc., have been proposed up to now (Jung and Cho, 1991; Tomasevicz and Asgarpoor, 2009; Li and Zio, 2012; Veeramany, 2012; Wang et al., 2017). These approaches are introduced to describe the random behavior of systems and the degradation/repair of the components. The Markov method has been widely applied to analyze the system reliability as well (Dugan et al., 1993; Vesely and Rezos, 1995; Chan and Asgarpoor, 2006; Li et al., 2012; Veeramany, 2012; Hellmich and Berg, 2014; Dawid et al., 2015; Kumar et al., 2020; Mohammadhasani and Pirouzmand, 2020).
In the Markov models, the transition rates between states are constant, which means that the failure and degradation processes are memoryless (Li et al., 2012), while in some realistic situations, the transition rates are time-dependent. In this case, one requires estimating the transition rates from field data. In practice, it can be difficult or even impossible to collect relevant data, especially for the highly reliable devices (e.g., nuclear components and aerospace devices) (Li et al., 2012).
In order to overcome the above bottleneck, some approaches have been proposed so far, in which the transition rates are described by physics functions rather than estimated from service data (Li et al., 2012). However, applying these approaches to real complex systems could be very time consuming and increases the computational costs significantly. This article seeks a multistate model that has the capability of modeling MAs and aging effects. It can be applied to NPPs where a huge number of components need to be analyzed. Despite the Markov model limitations, the literature shows that the Markov process is an affordable and a straightforward approach that can be easily applied to a large number of components with complicated maintenance policies with reasonable accuracy and computational costs (Alam, 1982; Sim and Endrenyi, 1993; Somani et al., 1993; Vesely and Rezos, 1995; Papazoglu, 2000; Bukowski, 2001; Chan and Asgarpoor, 2006; Tomasevicz and Asgarpoor, 2006; Cho and Jiang, 2008; Kumar et al., 2013; Matsuoka, 2014). Therefore, in this article the Markov process models are developed and applied to quantify basic events unavailability.
Indeed, in our present article, we have upgraded the Markov maintenance approach set forth in a previous work on evaluating the effect of maintenance policies on the components unavailability to the system level (Mohammadhasani and Pirouzmand, 2020). Three maintenance policies at the component level are first developed using the Markov approach. Then, by coupling Markov maintenance models (MMMs) with the FT model developed at the system level, the risk criterion (i.e., unavailability) is upgraded from the component level to the system level. It is worth mentioning that in this study, component degradation is also considered in the Markov model. Evaluation of variations in the unavailability calculated by coupling MMMs and FT at the system level due to variation in the components degradation rate and also a change in the surveillance test interval (STI) is another goal followed in the present article. This is carried out for three maintenance policies, and it is shown that using the Markov model due to its multistate nature and modeling the degradation state for components leads to the best estimate evaluation of unavailability computed at the system level. The developed model is applied to calculate the unavailability of two standby safety systems of a VVER-1000/V446 NPP.
The present article is structured as follows: Markov Maintenance Models provides a discussion of the MMMs developed in this research and introducing three different maintenance policies implemented in the Markov model. Description of Case Studies describes the coupling process of the Markov model and the FT method. Coupling Markov Model With Fault Tree Method introduces the NPP safety systems considered in this study. The results of coupling the MMMs and the FT developed for the safety systems are presented in Results.
Markov Maintenance Models
Component Markov Model
This section aims at describing the MMMs at the component level regarded as extensions of the standard Markov models exploited here to calculate the risk criterion at the component level, that is, the unavailability of components. It is assumed that the components are at standby mode being under periodic tests.
A standard PRA usually covers both the degraded state with the functioning state and does not model them separately. To quantify the maintenance effectiveness, it is necessary to discriminate the degraded state from the functioning state. Therefore, the present research study also considers a degraded state for the component assuming that in the degraded state, the component is still functional but in a degraded condition. Also, it is assumed that transition from a degraded state to a failure state occurs when a severe degradation drops the component performance below the expected design normal level.
Given that the components are under periodic testing, the test state is also taken into account. Another assumption is that testing of a component for inspection does not bring about the component unavailability. Also, in the models, a repair state is considered when the component is down. This state reflects the negative aspect of the maintenance process due to the component unavailability.
Finally, five states are considered for the components which are defined in Table 1. Given the five states (A, D, M, R, and F), it is required that a definition of the transition rates between the states is provided. The relevant transition rates are shown in the transition matrix of Table 2. The missing values are disallowed transitions and can be treated as having a transition rate value of zero. The nonzero transition rates are defined in Table 3.

TABLE 1. Definition of five states considered in the Markov models.
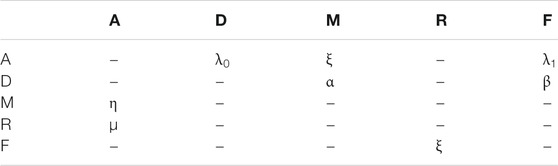
TABLE 2. Transition rates used in the Markov models.
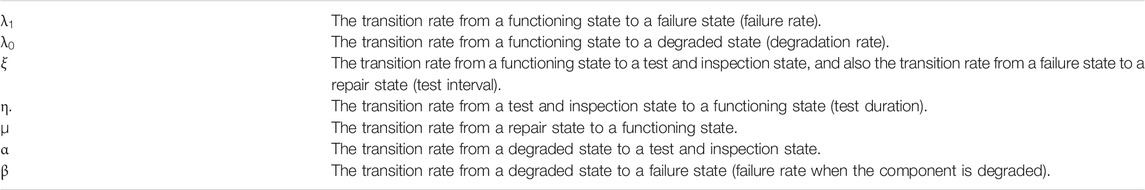
TABLE 3. Definition of transition rates used in Markov models.
It is notable that for 1oo4 redundant safety systems investigated in this study, a simultaneous failure of two-, three-, and four-components caused by the common cause failures (CCFs) are assumed and modeled by
The required data for the calculation of transition rates are taken from the reference plant PSA report, NUREG/CR-6002, and the TIRGALEX database (AEOI, 2003; NUREG/CR-6002, 1995; NUREG/CR-5587, 1992; and NUREG/CR-5248, 1988).
MMMs Assumptions
To develop the MMMs, the following assumptions are made:
1) It is assumed that the performed maintenance and repair are perfect so that to restore the component to as good as a new condition.
2) The transition rates between states are constant and the components unavailability is calculated in the steady state.
3) The failures are assumed to be hidden until the components are tested.
4) The components testing is assumed to be staggered and scheduled.
5) It is supposed that a component testing does not lead to system unavailability (AEOI, 2003).
6) It is assumed that the testing time is negligible compared to the repair time.
Maintenance Policies
According to Hellmich and Berg (2014), there are three different maintenance policies at the component level applicable to MMMs of redundant safety systems. The policies are as follows:
Policy 1: If a failure is detected in one component during the surveillance test, it is repaired promptly after the detection. No additional test is performed on other components. When the repair job is finished, the normal surveillance test schedule is resumed.
Policy 2: If a failure is detected in one component during the surveillance test, it is repaired promptly after the detection. Other components are subjected to a test as soon as the repair of the first component is finished, and if found defective, they are repaired immediately as well.
Policy 3: If a failure is detected in one component during the surveillance test, it is repaired promptly after the detection. Other components are subjected to simultaneous additional tests. If they are found defective as well, all four components are repaired simultaneously.
Figures 1–3 illustrate the implemented Markov models for maintenance policies 1–3, respectively. As was mentioned earlier, the model developed in the present article is considered for 1oo4 redundant components. And so, as can be seen in those figures, in each state of the Markov process, the first, second, third, and fourth letters represent the states of components 1, 2, 3, and 4 of the redundant system, respectively.
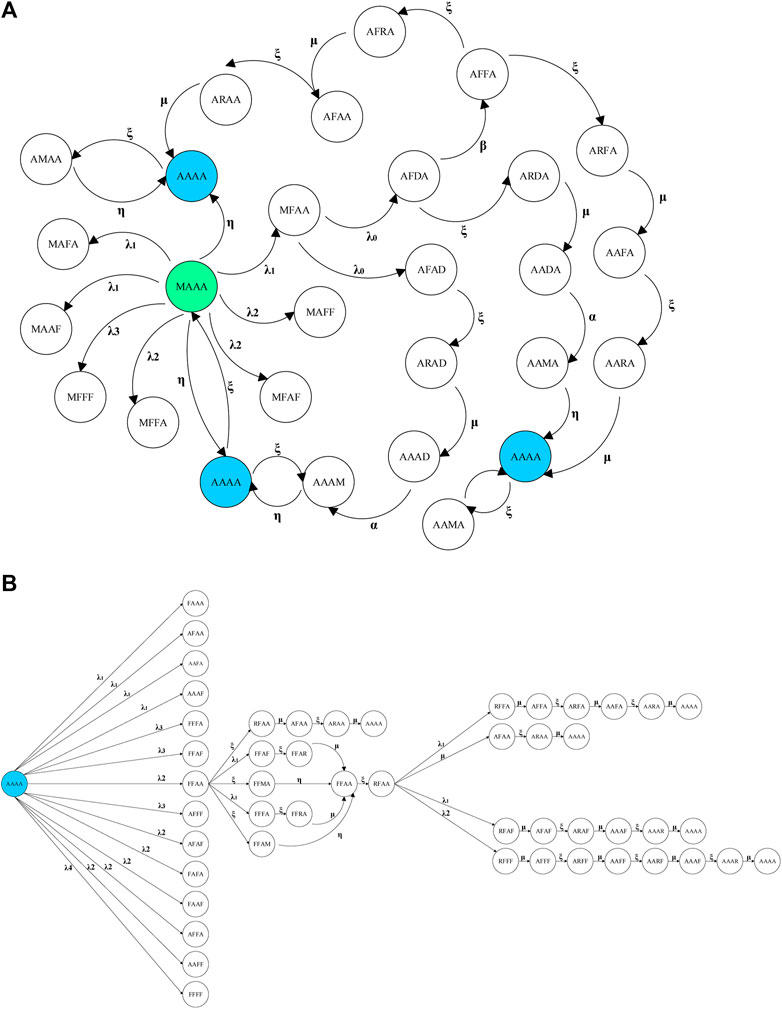
FIGURE 1. Sample transition diagrams for transition cycle of 1oo4 components in maintenance policy 1. (A) MAAA state and (B) AAAA state.
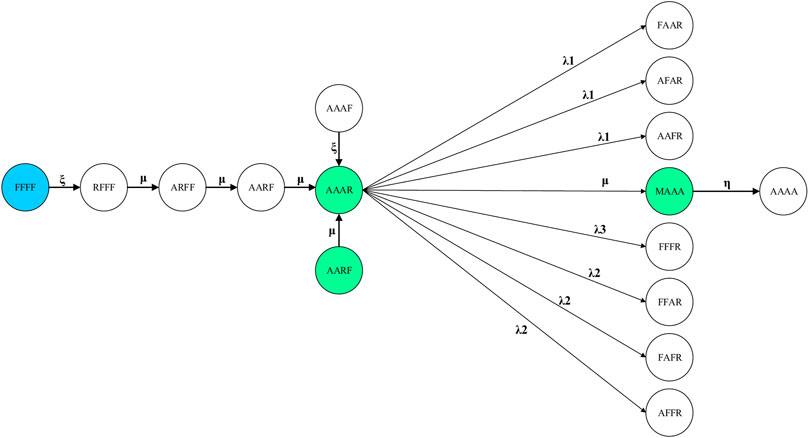
FIGURE 2. Sample transition diagram of policy 2.
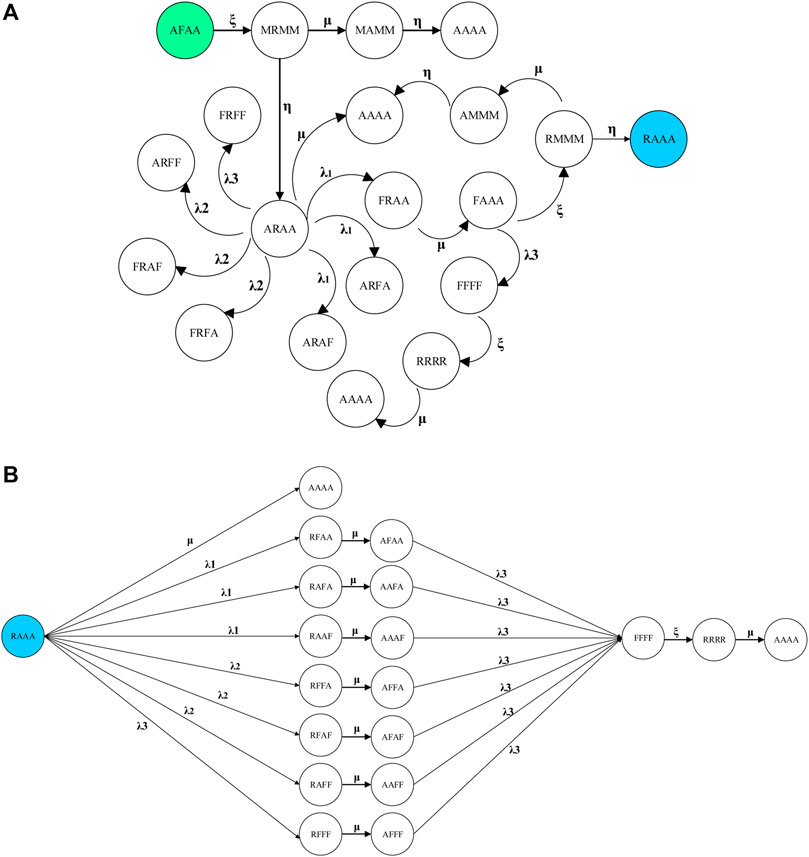
FIGURE 3. Sample transition diagrams of policy 3: (A) AFAA state and (B) RAAA state.
For example, Figure 1A illustrates the transition cycle of 1oo4 components for policy 1, assuming that the system is initially in the MAAA state (the state in question is indicated in green). Figure 1B shows the transitions also occurred for the AAAA states shown in Figure 1A.
All transitions of policy 1 are established for policies 2 and 3 as well. The transitions which distinguish policies 2 and 3 from policy 1 are represented in Figures 2, 3, respectively. Specifically, what discriminates policy 2 from policy 1 is the assumption that after the repair of a failed component (the failure detected by testing), the component of the next redundant train enters into a surveillance test state and so on (i.e., the states shown in green in Figure 2). Also, in policy 3, after identifying a failed component and its transition to the repair state, other redundant components are simultaneously subjected to surveillance testing. Therefore, it is possible to not only repair all components in parallel but also test and repair the redundant components simultaneously (see Figure 3). Figure 3 shows the transitions occurred in policy 3 assuming that the system is initially in the AFAA state.
It is worth mentioning that policy 3 is applicable to NPP equipment as it has been considered to be a reliable analysis of different systems of NPP in the literature (Jung and Cho, 1991; Hellmich and Berg, 2014). In this case, it should be noted that for many standby safety systems in NPPs additional restrictions are applied. For example, in a plant with a 1-out-of-4 safety system, technical specifications require that if the simultaneously failure of two trains is revealed, the plant must be switch to the cold shutdown condition. Also, the duration of downtime (due to repair) of failed trains must not exceed a specified allowed outage time (AOT). If the AOT is exceeded, it is mandatory to shut the plant down. Hence, a simultaneous repair of all redundant components is possible within the permissible time, provided the plant is shutdown.
In order to drive the various states and transitions rates, the following procedure is pursued:
The redundant 1oo4 components of VVER1000 NPP safety systems are considered to implement the Markov models developed in this study. The implementation of the Markov model taking into account five states (F, D, A, M, and R) for the components will produce 540 states for policies 1 and 2 and 716 states for policy 3. For each policy, the states are first divided into eight groups. Eight groups of states must be recognized since the process has to remember which component is tested next, in spite of the memoryless property of the Markov process. Four groups cover the test and repair process for the component and the other do not include any testing or repair. After that, for each policy, the states are formed in the MATLAB software by applying the assumption given in MMMs Assumptions and assume that only a clockwise permutation between states in eight groups is allowed (see Figure 4). At this time, the transition rate matrixes (a 540 × 540 matrix for policies 1 and 2 and a 716 × 716 matrix for policy 3) are constructed by programming in the MATLAB software. Finally, Markov equations are formed and solved to give each state probability and other components performance characteristics such as MVF (maintenance visit frequency), RVF (repair visit frequency), FVF (failure visit frequency), and MTBF (mean time between failure) (Høyland and Rausand, 2004; Modarres et al., 2016).
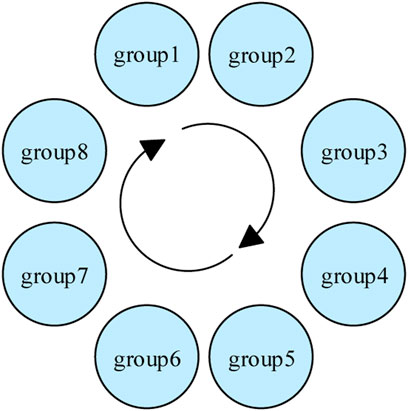
FIGURE 4. Permutation between states in eight groups is allowed in a clockwise.
To establish the transition rate matrixes, the following assumption are applied (see Table 2):
1) Transition from a degraded state directly to a standby state (D
2) The transition from a failed state directly to a maintenance state (F
3) It is assumed that the degradation is not critical and it does not need to be repaired; therefore, the transition from a degraded state to a repair state (D
4) The transition rates from a failed state to a standby state (F
After establishing the transition rate matrix for each policy, the governing linear equations are formed. Equation 1 presents the simplified matrix equation for policy 1 as a sample:
Here,
Description of Case Studies
This section is devoted to describe different functions of the two main safety systems of VVER-1000/V446 NPPs as case studies: the emergency core cooling safety system (ECCS) and the emergency cooling safety system.
These systems are 1oo4 redundant systems accommodating four identical trains normally in a standby mode.
Case I: Emergency Core Cooling System
ECCS is one of the most important NPP safety systems designed to remove the reactor core heat under accident conditions. The system is designed to mitigate the consequences of any break in the reactor coolant system (RCS) pressure boundary which might result in the loss of reactor coolant at a rate exceeding the capability of the reactor coolant makeup system. The system is also intended for the reactor core cooling after its shutdown in modes when heat removal via steam generators (SG) becomes ineffective and for removing heat from the fuel placed in the fuel pool as well (AEOI, 2008).
The ECCS comprises four independent trains. All system trains are physically and structurally separated one from the other. Each train performs safety function measures in all states of the unit including design basis accidents (AEOI, 2003).
As mentioned before, each safety system has a specific and different function; hence, the FT related to each function is developed separately and coupling of the MMMs with the FT method is performed for each separate function. Table 4 presents three main functions of an ECCS (AEOI, 2003).
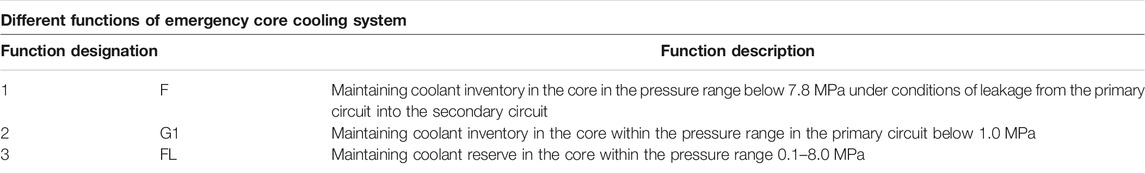
TABLE 4. Chart description of different functions in the emergency core cooling system (AEOI, 2003).
Case II: System for Emergency Cooling
The system is intended for emergency heat removal from the core through the secondary circuit under the following conditions: 1) maintaining pressure in the secondary circuit and 2) reactor cooling at the predetermined rate (AEOI, 2003).
Under the first mode, the system operates automatically. Specifying points for opening and closing fast-acting reducing stations for steam dump into the atmosphere (FASD-A) are performed according to the design pressure in steam generators and steam lines. In the case of FASD-A failure to open, pressure in the steam generator is maintained with the help of steam generator safety valves (AEOI, 2003).
Under the second mode in order to ensure that the preset cooling rate is equal to 30°С/h (slow cooling) or 60°С/h (fast cooling), the operator switches over the FASD-A to the corresponding cooling mode (AEOI, 2003).
The system functions are as follows:
Functions HO, HO″, R1: Residual Heat Removal Through the Secondary Circuit Over Opened Cycle
The function of the residual heat removal through the secondary circuit over the opened cycle is executed for all initiating events when it is impossible to perform the function of long-term heat removal from the core via turbine condenser through the closed cycle (AEOI, 2003). Functions HO, HO′′ and R1 are executed when SGs are connected to the main steam collector (MSC) (AEOI, 2003).
Functions R, RS: Reactor Plant Cooling Through the Secondary Circuit
The emergency cooling system performs the function of the reactor plant cooling through secondary circuit for all initiating events when the reactor plant cooling is required. Function R is executed when SGs are connected to MSC while function RS is executed when SGs are isolated from MSC (AEOI, 2003).
Further explanations on these functions are presented in Table 5 (AEOI, 2014).
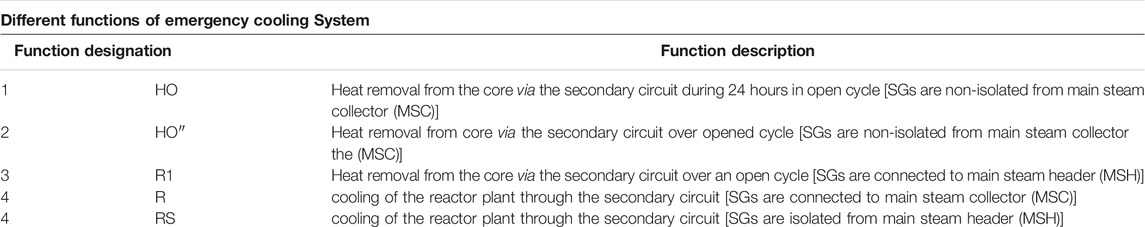
TABLE 5. Description of Different Functions of the Emergency Cooling System (AEOI, 2014).
Coupling Markov Model With Fault Tree Method
Figure 5 presents the chart related to the coupling process of MMMs with the FT method for calculating the system unavailability. To start the coupling process, for each safety function, the FT is developed in the SAPHIRE software. Then, the critical components are extracted using the FT analysis and cut sets generation for each function, by the classical PSA approach (i.e., two states for each basic event and no degradation). Herein, the importance measures related to the maintenance phase, that is, the risk reduction ratio (RRR) and risk increase ratio (RIR) are applied to prioritize the basic events (Nøkland, 2013). After determining the critical components, multistate unavailability models, developed in MATLAB software, are assigned to the prioritized basic events and the risk measure is upgraded from the components level to the system level using the FT analysis in the SAPHIRE software.
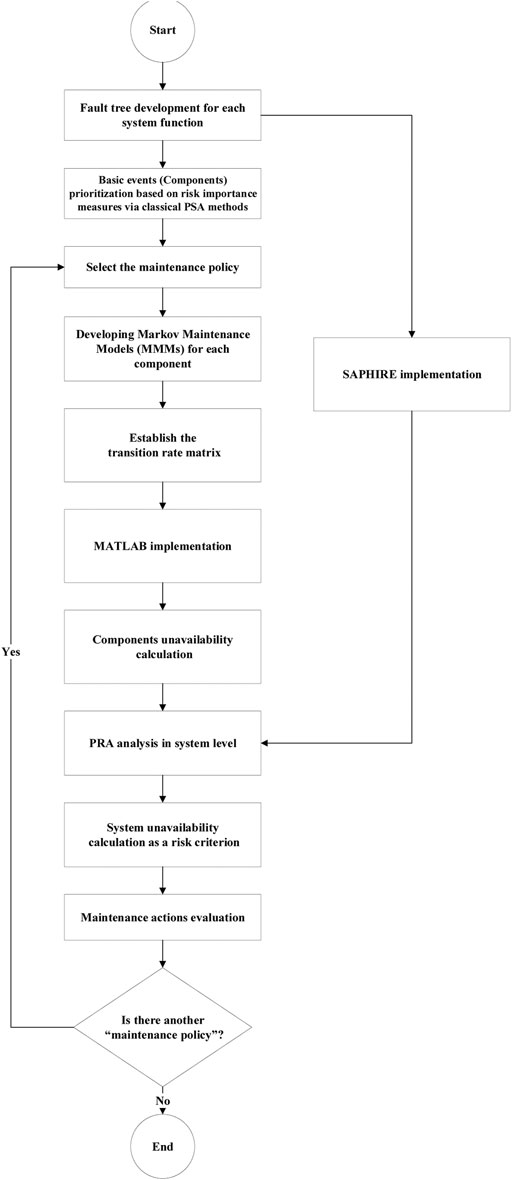
FIGURE 5. Coupling process of MMMs with the FT method for system unavailability calculation.
Figure 6 as a sample shows a simplified FT for the GL function of ECCS system of VVER1000/V446 NPP. To analyze the FTs, they are first implemented in the SAPHIRE code. Then, by applying the Boolean algebra, the top event for each FT is calculated based on basic events and is simplified to gives the minimal cut sets (MCSs).
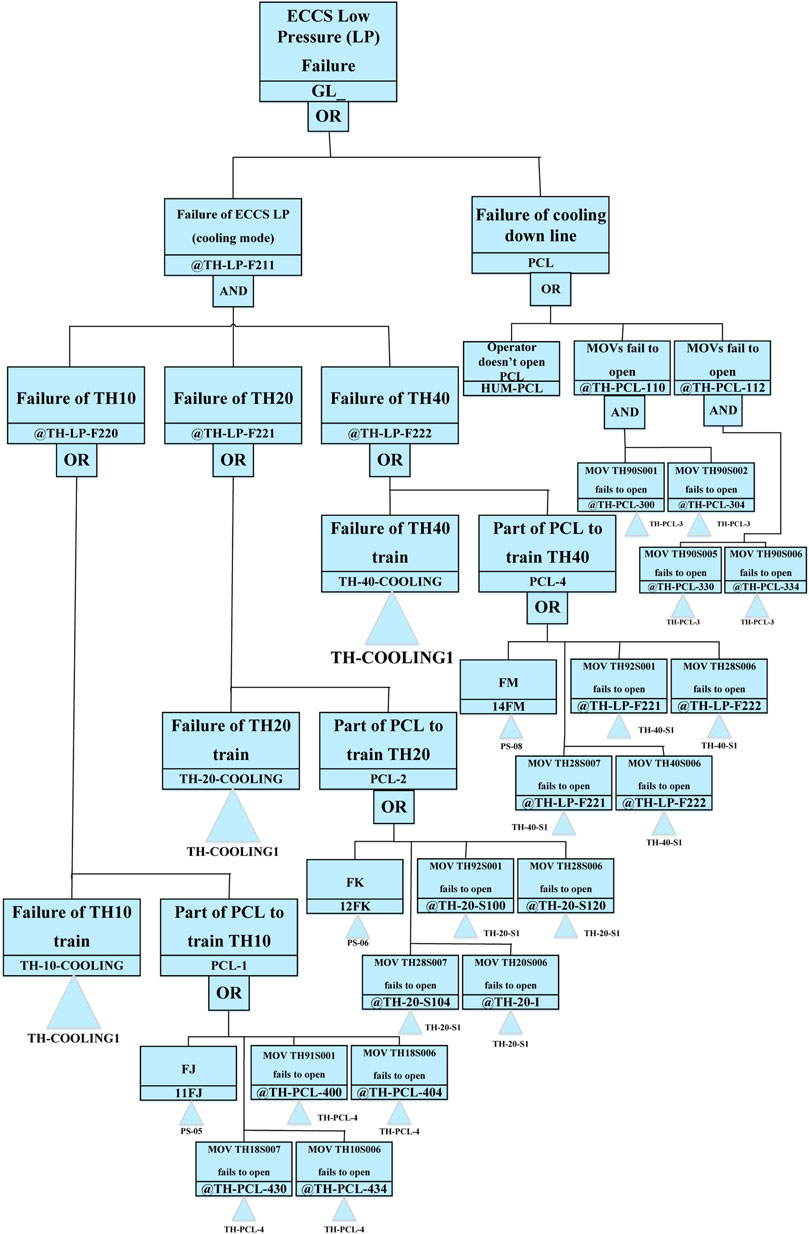
FIGURE 6. A simplified FT for the GL function of ECCS system of VVER1000/V446 NPP (AEOI, 2003).
After developing the MMMs at the component level and implementing them for different maintenance policies—accomplished by means of MATLAB software—the component unavailability is computed. The component availability is calculated as follows (Høyland and Rausand, 2004):
Let X = {0, 1,. . ., r } stand for the set of all possible states of a component and let B and F (F = X–B) stand for the subset of states respectively corresponding to the component functioning and failure states, then the average availability of the component is the mean proportion of time when the component is functioning. The average component availability
Here,
In the next step, the components unavailability calculated by MMMs is assigned to respective basic events in the FT and the top event probability is calculated as a risk criterion. This process evaluates the effects of MAs at the component level on the system unavailability. The above mentioned procedure is iterated for all functions under investigation.
The developed model is eventually applied for evaluating the system unavailability variations with STI [as one of its technical specifications (TSs)] and the component’s degradation rate. According to IAEA-TECDOC-503, the permitted tolerance for the deviation from a specified surveillance test interval is plus or minus 25% of the interval (IAEA-TECDOC-503, 1989). The test interval currently used for the components of the safety systems of VVER-1000 NPP is 28 days (AEOI, 2003). Therefore, the adopted test intervals to examine the changes in system unavailability are determined at 21 and 35 days.
The effects of degradation on the system unavailability also are investigated. It is to be noted that the degradation rate is considered by varying the
where
Results
This section presents the results of implementing the coupling MMMs and FT method. Table 6 shows the system unavailability calculated through the coupling process for most important functions of the safety systems and for three maintenance policies. Also, in Table 6, the original unavailability (calculated by system FT using NPP PSA data) is compared with that of the unavailability from coupling process for each function. As is shown, the unavailability values computed by coupling MMMs with FT for all maintenance policies and for all functions are higher than the original unavailability. It should be noted that the Markov method—due to its multistate nature—is effective in a realistic evaluation of the component unavailability and consequently the system unavailability. The results are also displayed in Figures 7, 8 to provide a better comparison.
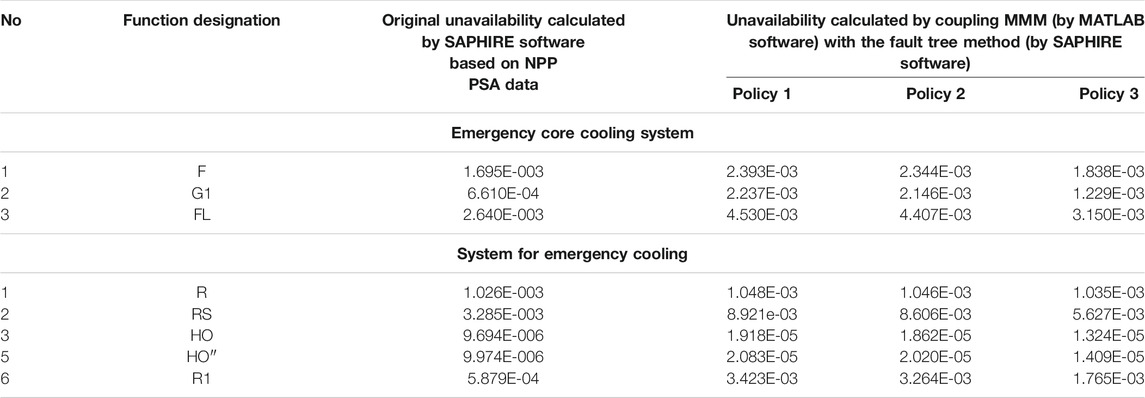
TABLE 6. Comparison of original unavailability (calculated by FT using NPP PSA data) and unavailability calculated through a coupling process.
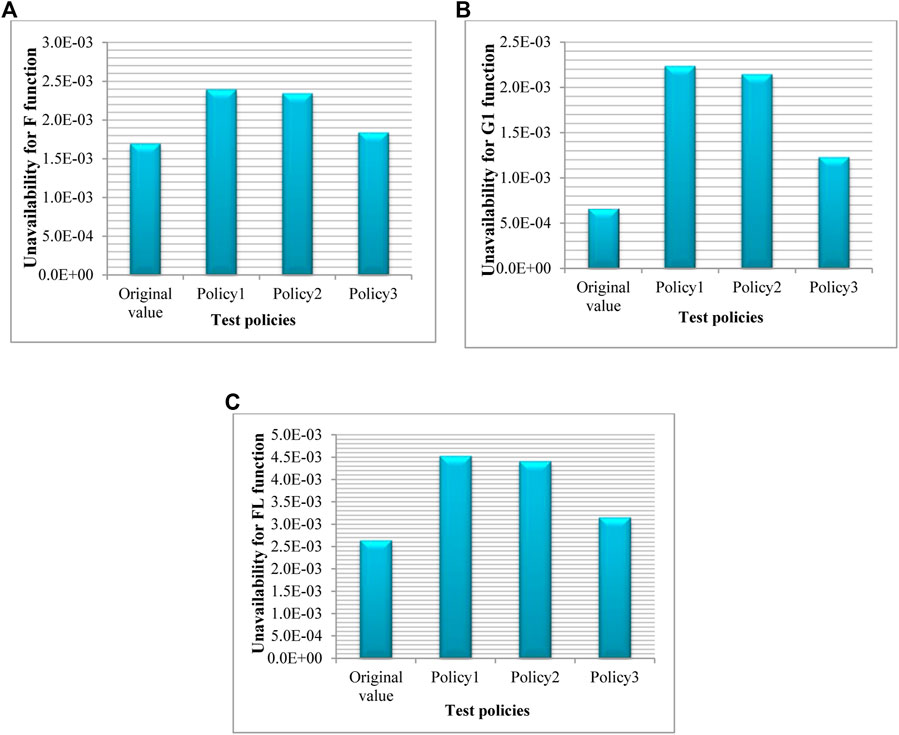
FIGURE 7. Comparison of unavailability between different policies and original value for functions of ECCS: (A) F, (B) G1, and (C) FL.
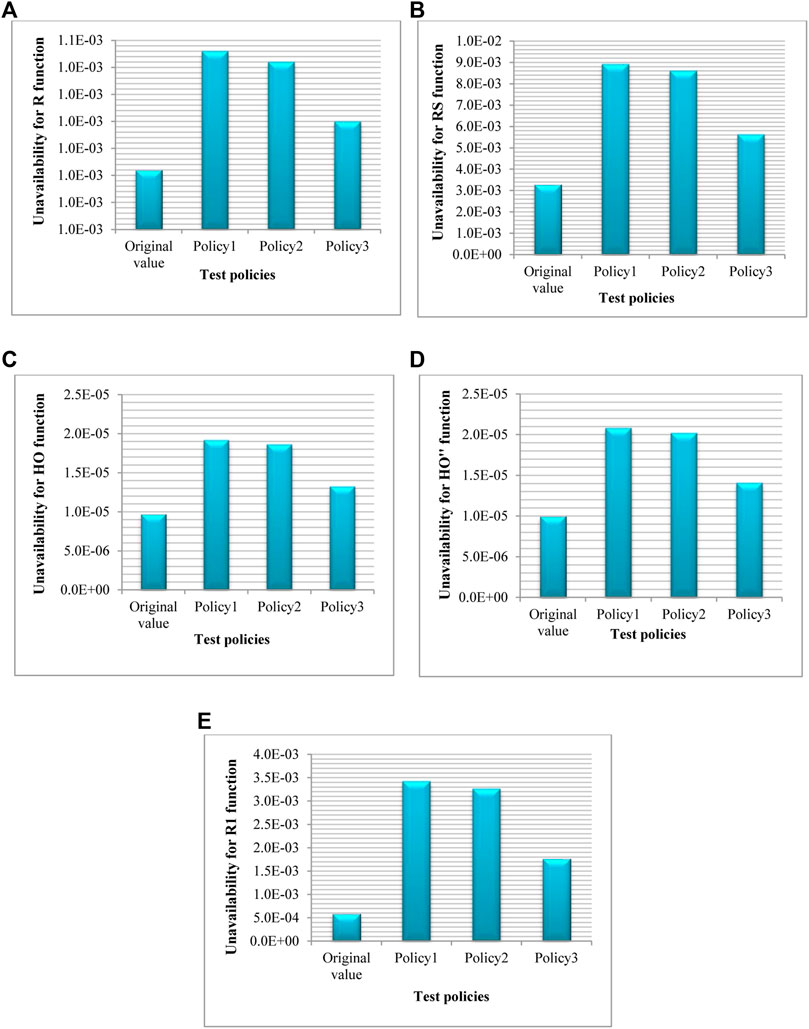
FIGURE 8. Comparison of unavailability between different maintenance policies and original value for functions of “System for Emergency Cooling”: (A) R, (B) RS, (C) HO, (D) HO″, and (E) R1.
As is expected, the system unavailability in policy 3 is lower than that of policy 2 and the system unavailability in policy 2 is similarly lower than that of policy 1. This is attributed to the characteristics of maintenance policies implemented at the component level. In other words, given that in policy 3, after detecting the hidden failure of a component, as the failed component enters the repair state, other components also undergo a surveillance test. If they are found to be in a failure state, they are simultaneously repaired. Hence, other redundant components failure is detected sooner than other policies, as a result of which, the component unavailability and consequently the system unavailability are reduced.
In policy 2, it is supposed that by detecting a failed component and accomplishing relevant repair, other components are subjected to surveillance testing. Therefore, the failure of redundant components is identified sooner than that of policy 1 and consequently its unavailability becomes lower than that of policy 1.
In policy 1 no additional testing procedure is performed on other redundant components. After detecting a failed component during the surveillance testing and subsequent prompt repair, the normal surveillance test schedule for other components is resumed. Hence, the failure of other components remains hidden. Accordingly, in policy 1, the system unavailability is higher than that of other policies.
The effect of STI on the system unavailability is also quantified for STI = 21 and 35 days and compared with the reference values of STI for the VVER-1000 NPPs (see Table 7). As is expected, decreasing STI from 28 to 21 days reduces the unavailability in all maintenance policies. In fact, by a decrease in STI, the component is inspected and tested sooner, so, it remains in a lesser amount of time in a failure (and unavailable) state. This result is inversed when the STI = 28 days is increased to STI = 35 days, in which case, the unavailability value increases in all maintenance policies. These results are represented graphically in Figures 9, 10, thus providing a better comparison.
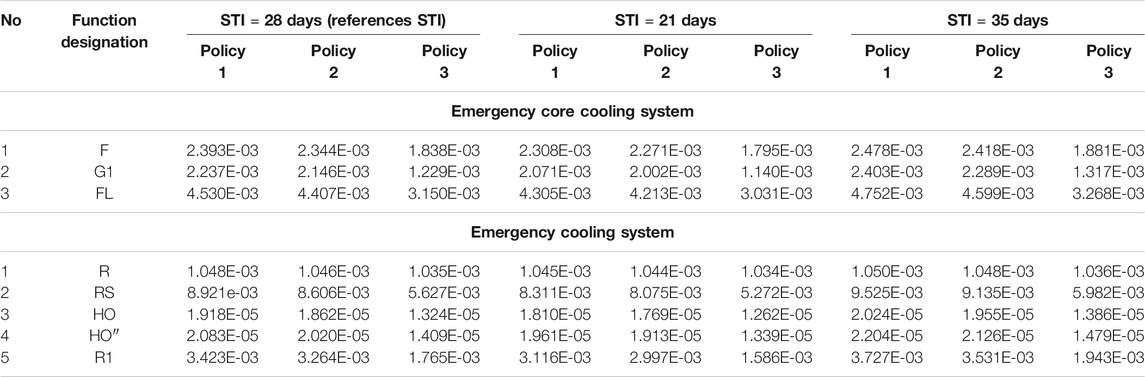
TABLE 7. Comparison of unavailability calculated by coupling MMMs with FT method for different STIs and various system functions.
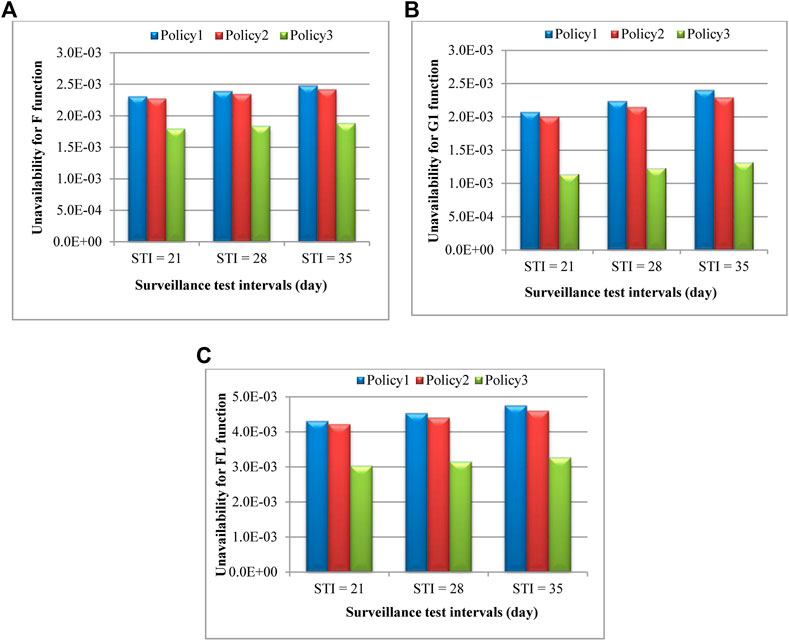
FIGURE 9. Comparison of unavailability between different STIs and three maintenance policies for functions of ECCS: (A) F, (B) G1, (C) FL.
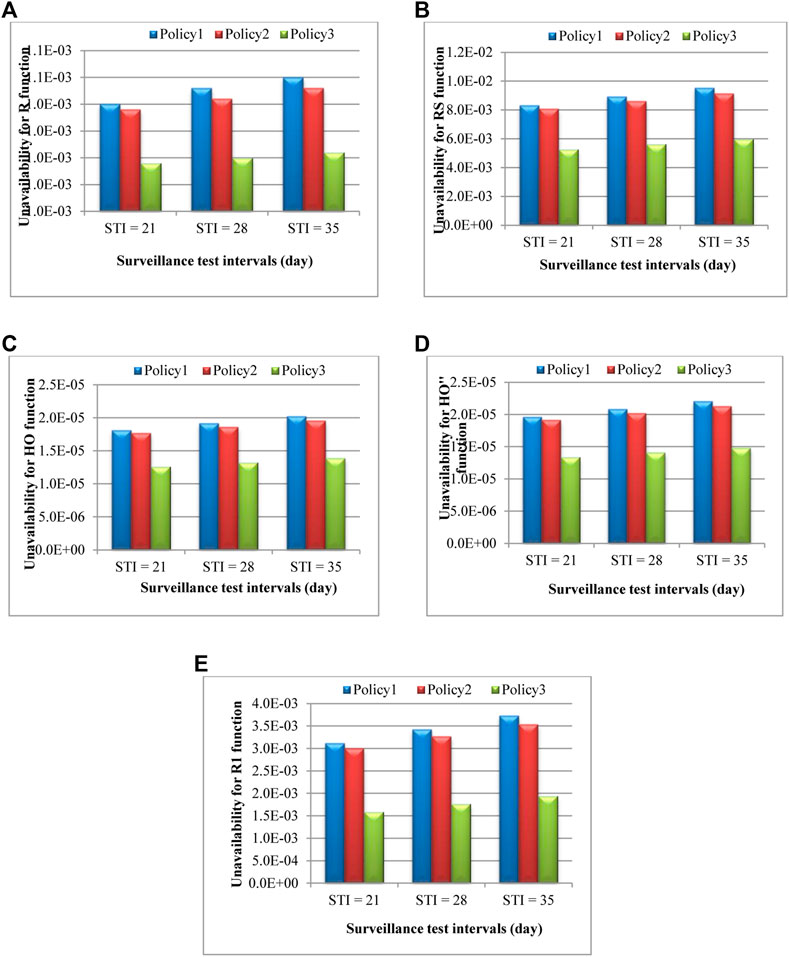
FIGURE 10. Comparison of unavailability between different STIs and three maintenance policies for functions of “Emergency Cooling System”: (A) R, (B) RS, (C) HO, (D) HO″, (E) R1.
Table 8 presents the systems unavailability for both fast and slow degradation rates for selected system functions. This Table provides a comparison between STI = 28 days and STI = 10 years. The STI = 10 years is selected to evaluate the effect of degraded component on the systems unavailability. It is shown that at fast degradation, the systems unavailability for all functions increases sharply. Indeed, an increase in the degradation rate simultaneous with an increase in the STI at the component level (equaling to the component aging) leads to growing unavailability. Therefore, considering the degraded state for components under MAs results in more a realistic evaluation of the unavailability at the system level as expected.
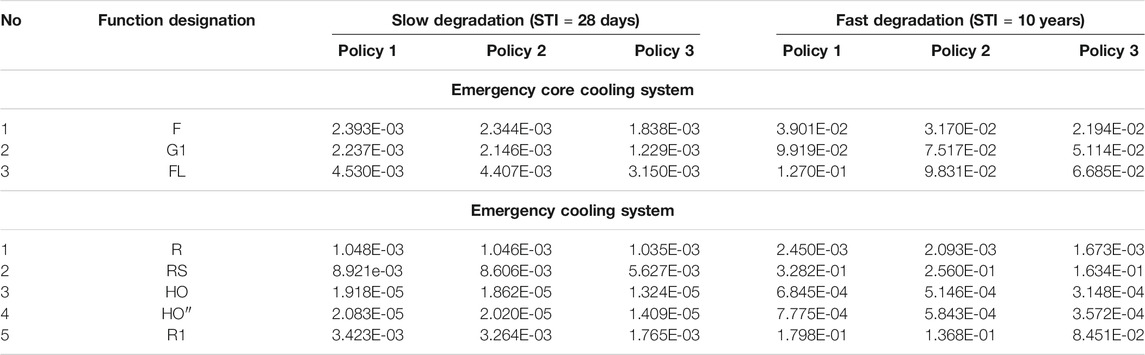
TABLE 8. Comparison of unavailability calculated by coupling MMMs with FT method between two different degradation rates.
Finally, the FV importance measure, which represents the component contribution to the system failure (Høyland and Rausand, 2004) is calculated for basic events in three maintenance policies and is compared to the FV value in the base case (i.e., two state for each basic event and no degradation). As a sample, the FV measure computed for the critical components of “F” function (described in Case I: Emergency Core Cooling System) of ECCS of VVER1000 NPP is shown in Table 9. As presented, the FV measure of all MMMs is higher than the base case. Therefore, the importance of components in the coupling process increases compared to the base case. A similar result is obtained by comparing data of policy 1 and policy 2 to policy 3, respectively. In addition, the coupling of the MMMs with the FT method, changes the order of components importance as can be seen in Table 10.
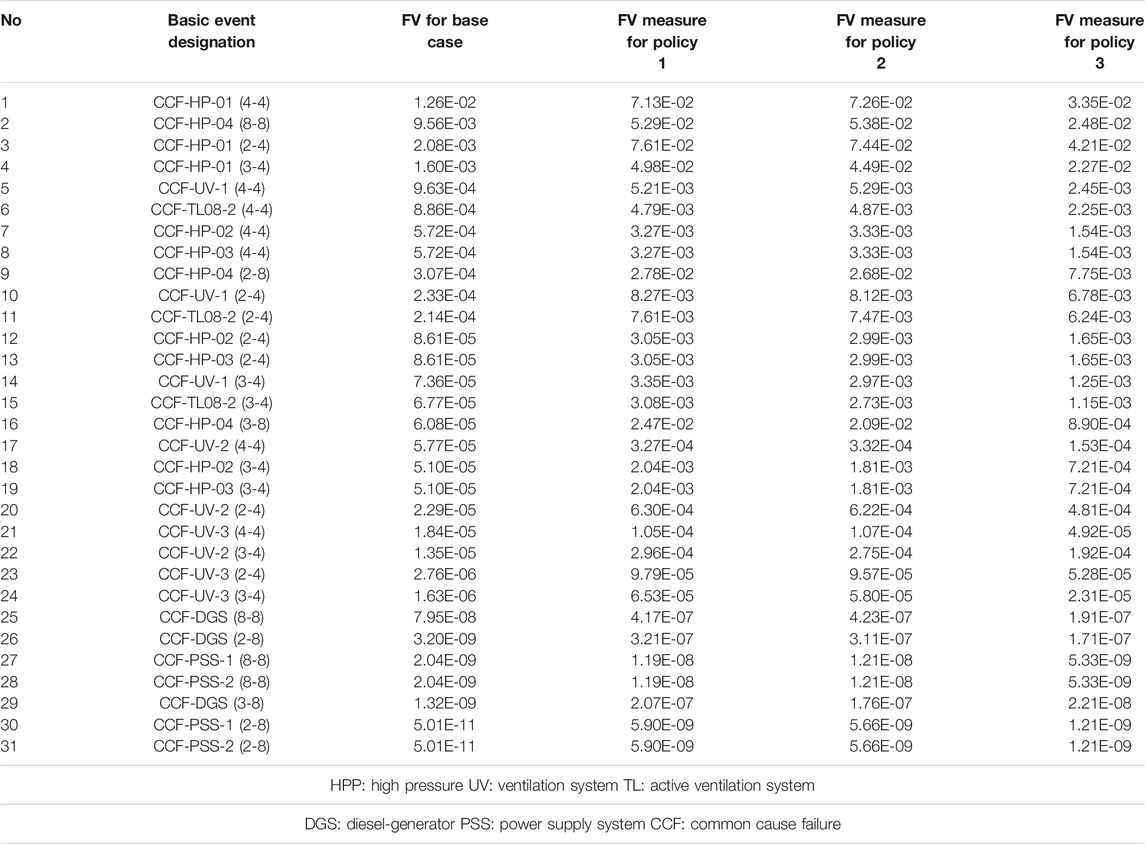
TABLE 9. FV importance measure for selected basic events of “F” function of ECCS of VVER1000/V446 NPP.
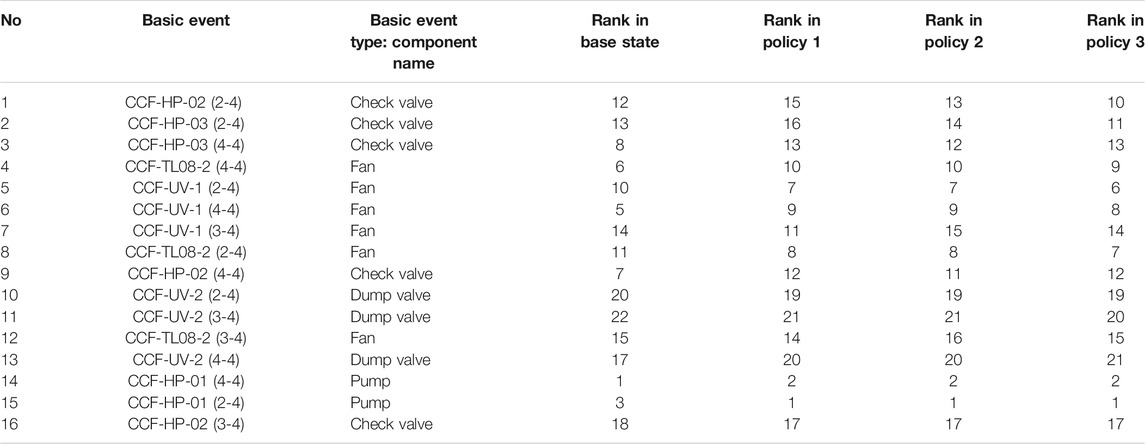
TABLE 10. Ranking alteration of the basic evens related to “F” function of ECCS with changing different policies obtained by importance analysis.
Conclusion
In this study, a risk-based maintenance strategy was adopted for evaluating the effects of maintenance activities on the system risk criterion. Conventional reliability approaches including the FT method can only quantify the negative aspects of maintenance while the upsides of the maintenance procedure in correcting degradations and preventing failures are generally neglected. This article proposed the Markov maintenance models to integrate the effects of maintenance measures and the components degradation on the system unavailability. By coupling these models with the FT method, the risk criterion was upgraded from the component level to the system level, where up on the effects of MAs on the system unavailability were put to assessment. The evaluation was performed via comparing the unavailability calculated by a coupling process and the original unavailability obtained through the system FT using NPP PSA data for several important functions of VVER-1000 reactor safety systems (Table 6 and Figures 7, 8). The comparisons showed that the FT method underestimates the unavailability of the systems. In contrast, the MMM, due to its multistate nature and modeling the degradation state for components, leads to a more realistic estimate of the unavailability computed at the system level so that for all maintenance policies and for all functions, the estimates are higher than those of the original unavailability (Table 6). Also, the obtained results confirmed that due to the characteristics of maintenance policies implemented at the component level, the system unavailability in policy 3 is lower than that of policy 2 and the system unavailability in policy 2 is similarly lower than that of policy 1 for all functions (Table 6).
Quantification of the STI effects on the system unavailability was rendered for the reference STI for 1oo4 redundant components of VVER1000/V446 safety systems with an allowable tolerance equaling 25% of the interval (Table 7). As is expected, decreasing the STI from the reference value reduces the unavailability in all maintenance policies and the situation is reversed when the STI increases from the reference value (Table 7).
The effects of components degradation rate and the STI value on the system unavailability were evaluated as well (Table 8). As is expected, the systems unavailability at fast degradation for all functions rises (Table 8) and the component aging factor increases the risk criterion at the system level. Therefore, modeling the degraded state for components under MAs is a most essential step toward a risk-based maintenance optimization.
It is worth mentioning that the Markov models developed in this work can provide researchers with a new tool for evaluating risk-based maintenance measures. Upgrading the risk measures to the plant level, that is, core damage frequency (CDF), is being conducted by the authors. In this regard, it is possible to study different maintenance policies at the plant level from a risk-based point of view and evaluate the effects of alteration in TSs on the CDF. In this case, the effects of different test intervals and three test policies will be assessed on the various scenarios that lead to core damage. Thus, all systems of VVER1000/V446 NPP will be modeled in the SAPHIRE software and by establishing a link between MMMs, fault trees, and event trees of various initiating events, the CDF for different scenarios will be calculated.
Data Availability Statement
The original contributions presented in the study are included in the article/Supplementary Material; further inquiries can be directed to the corresponding author.
Author Contributions
FM: conceptualization, methodology, software, writing- original draft preparation, visualization, and investigation. AP: conceptualization, methodology, software, investigation, supervision, writing—reviewing and editing.
Conflict of Interest
The authors declare that the research was conducted in the absence of any commercial or financial relationships that could be construed as a potential conflict of interest.
Publisher’s Note
All claims expressed in this article are solely those of the authors and do not necessarily represent those of their affiliated organizations, or those of the publisher, the editors and the reviewers. Any product that may be evaluated in this article, or claim that may be made by its manufacturer, is not guaranteed or endorsed by the publisher.
Acknowledgments
The authors would like to thank the Iran National Science Foundation (INSF) for supporting this work financially (contract number 98012353).
Abbreviations
CCF, common cause failures; CDF, core damage frequency; ECCS, emergency core cooling system; FASD, a fast-acting valves for steam dump to atmosphere; FT, fault tree; FVF, failure visit frequency; LP, low pressure; MAs, maintenance activities; MCSs, minimal cut sets; MMM, markov maintenance model; MSC, main steam collector; MSH, main steam header; MTBF, mean time between failures; MVF, maintenance visit frequency; NPP, nuclear power plant; PRA, probabilistic risk assessment; PSA, probabilistic safety assessment; RCS, reactor coolant system; RIR, risk increase ratio; RRR, risk reduction ratio; RVF, repair visit frequency; SGs, steam generators; T&M, test and maintenance; TSs, technical specifications.
References
AEOI (2003). PSA of Bushehr Nuclear Power Reactor. Probabilistic Safety Assessment, Level 1. App. G., probabilistic safety assessment. Moscow: Atomic Energy Organization of Iran.
AEOI (2008). Final safery analysis report (FSAR) of Bushehr Nuclear Power Reactor. Final Safety Analysis Report. Moscow: Atomic Energy Organization of Iran.
AEOI (2014). PSA of Bushehr Nuclear Power Reactor. Probabilistic safety assessment, level 1, App. E., probabilistic safety assessment. Moscow: Atomic Energy Organization of Iran.
Alam, M. (1982). Quantitative Evaluation of Nuclear-Reactor Protective-Equipment Using Markov Approach. IEEE Trans. Rel. R-31, 112–116. doi:10.1109/tr.1982.5221254
Aldemir, T. (1989). Quantifying Setpoint Drift Effects in the Failure Analysis of Process Control Systems. Reliability Eng. Syst. Saf. 24, 33–50. doi:10.1016/0951-8320(89)90053-7
Aldemir, T., and Siu, N. O. (Editors) (1996). “Guest Editorial,” in Reliability Engineering and System Safety, 52, 181–184.
Andow, P. K. (1981). Fault Trees and Failure Analyses: Discrete State Representation Problems. Trans. Icheme-chem Eng. Res. Des. 59a, 125–128.
Ayodeji, A., and Liu, Y.-k. (2018). Support Vector Ensemble for Incipient Fault Diagnosis in Nuclear Plant Components. Nucl. Eng. Techn. 50 (8), 1306–1313. doi:10.1016/j.net.2018.07.013
Ayodeji, A., and Liu, Y.-k. (2018). SVR Optimization with Soft Computing Algorithms for Incipient SGTR Diagnosis. Ann. Nucl. Energ. 121, 89–100. doi:10.1016/j.anucene.2018.07.011
Baraldi, P., Compare, M., Despujols, A., and Zio, E. (2011). Modelling the Effects of Maintenance on the Degradation of a Water-Feeding Turbo-Pump of a Nuclear Power Plant. Proc. Inst. Mech. Eng. O: J. Risk Reliability 225 (2), 169–183. doi:10.1243/1748006xjrr336
Bucci, P., Kirschenbaum, J., Mangan, L. A., Aldemir, T., Smith, C., and Wood, T. (2008). Construction of Event-Tree/fault-Tree Models from a Markov Approach to Dynamic System Reliability. Reliability Eng. Syst. Saf. 93, 1616–1627. doi:10.1016/j.ress.2008.01.008
Bukowski, J. V. (2001). Modeling and Analyzing the Effects of Periodic Inspection on the Performance of Safety-Critical Systems. IEEE Trans. Rel. 50, 321–329. doi:10.1109/24.974130
Chan, G. K., and Asgarpoor, S. (2006). Optimum Maintenance Policy with Markov Processes. Electric Power Syst. Res. 76 (6-7), 452–456. doi:10.1016/j.epsr.2005.09.010
Cho, S., and Jiang, J. (2008). Analysis of Surveillance Test Interval by Markov Process for SDS1 in CANDU Nuclear Power Plants. Reliability Eng. Syst. Saf. 93, 1–13. doi:10.1016/j.ress.2006.10.007
Cho, S., and Jiang, J. (2008). Effect of the Surveillance Test Frequency of SDS1 on the Core Damage Probability. Nucl. Techn. 161, 98–107. doi:10.13182/nt08-a3916
Dawid, R., McMillan, D., and Revie, M. (2015). Review of Markov Models for Maintenance Optimization in the Context of Offshore Wind.
Dugan, J. B., Bavuso, S. J., and Boyd, M. A. (1993). Fault Trees and Markov Models for Reliability Analysis of Fault-Tolerant Digital Systems. Reliability Eng. Syst. Saf. 39 (3), 291–307. doi:10.1016/0951-8320(93)90005-j
Gohel, H. A., Upadhyay, H., Lagos, L., Cooper, K., and Sanzetenea, A. (2020). Predictive Maintenance Architecture Development for Nuclear Infrastructure Using Machine Learning. Nucl. Eng. Techn. 52 (7), 1436–1442. doi:10.1016/j.net.2019.12.029
Gong, Y., Su, X., Qian, H., and Yang, N. (2018). Research on Fault Diagnosis Methods for the Reactor Coolant System of Nuclear Power Plant Based on D-S Evidence Theory. Ann. Nucl. Energ. 112, 395–399. doi:10.1016/j.anucene.2017.10.026
Hassan, M., and Aldemir, T. (1990). A Data Base Oriented Dynamic Methodology for the Failure Analysis of Closed Loop Control Systems in Process Plant. Reliability Eng. Syst. Saf. 27, 275–322. doi:10.1016/0951-8320(90)90002-5
Hellmich, M., and Berg, H. P. (2014). Markov Analysis of Redundant Standby Safety Systems under Periodic Surveillance Testing. Reliability Eng. Syst. Saf. 133, 48–58.
Høyland, A., and Rausand, M. (2004). System Reliability Theory: Models and Statistical Methods. John Wiley & Sons.
IAEA-TECDOC-503 (1989). Reviewing Surveillance Activities in Nuclear Power Plants, A Technical Document Issued by the International Atomic Energy Agency. Vienna: For IAEA Operational Safety Review Teams (OSARTS).
Joel, P. V., and Kumar, G. (2014). Availability analysis with opportunistic maintenance of a two component deteriorating system. Int. J. Manuf. Mater. Mech. Eng. 2 (2), 155–163.
Jung, W. S., and Cho, N. Z. (1991). Semi-Markov Reliability Analysis of Three Test/repair Policies for Standby Safety Systems in a Nuclear Power Plant. Reliability Eng. Syst. Saf. 31 (1), 1–30. doi:10.1016/0951-8320(91)90033-4
Kančev, D., and Čepin, M. (2011). Evaluation of Risk and Cost Using an Age-dependent Unavailability Modelling of Test and Maintenance for Standby Components. J. Loss Prev. Process Industries 24 (2), 146–155.
Kim, J. W., Choi, G., Suh, J. C., and Lee, J. M. (2015). Optimal Scheduling of the Maintenance and Improvement for Water Main System Using Markov Decision Process. IFAC-PapersOnLine 48 (8), 379–384. doi:10.1016/j.ifacol.2015.08.211
Kolykhanov, V. N., and Kozlov, I. E. (2018). Risk-Informed Maintenance Optimization for Safety Systems of NPP. BgNS Trans. 23 (1), 20–24.
Krishnasamy, L., Khan, F., and Haddara, M. (2005). Development of a Risk-Based Maintenance (RBM) Strategy for a Power-Generating Plant. J. Loss Prev. Process Industries 18, 69–81. doi:10.1016/j.jlp.2005.01.002
Kumar, G., and Joel, P. V. (2018). Optimum preventive maintenance policy for a mechanical system using Semi-Markov approach and Golden section search technique in 2018 IEEE International Conference on Industrial Engineering and Engineering Management (IEEM), Bangkok, Thailand, December 16–19, 2018, 232–236.
Kumar, A., Saxena, A., and Ram, M. (2020). Multi-State Reliability Measures Analysis of Nuclear Power Plant (NPP) System. Int. J. Rel. Qual. Saf. Eng. 27 (02), 2040007. doi:10.1142/s0218539320400070
Kumar, G., Jain, V., and Gandhi, O. P. (2018). Availability Analysis of Mechanical Systems with Condition-Based Maintenance Using Semi-markov and Evaluation of Optimal Condition Monitoring Interval. J. Ind. Eng. Int. 14 (1), 119–131. doi:10.1007/s40092-017-0212-z
Kumar, G., Jain, V., and Gandhi, O. P. (2013). Availability Analysis of Repairable Mechanical Systems Using Analytical Semi-markov Approach. Qual. Eng. 25, 97–107. doi:10.1080/08982112.2012.751606
Kumar, G., Jain, V., and Gandhi, O. P. (2012). Reliability and Availability Analysis of Mechanical Systems Using Stochastic Petri Net Modeling Based on Decomposition Approach. Int. J. Rel. Qual. Saf. Eng. 19 (01), 1250005. doi:10.1142/s0218539312500052
Kumar, G., and Varghese, J. P. (2018). “Optimum Preventive Maintenance Policy for a Mechanical System Using Semi-markov Method and Golden Section Technique,” in 2018 IEEE International Conference on Industrial Engineering and Engineering Management (IEEM) (IEEE), 232–236.
Levy, I. S., Wreathall, J., DeMoss, G., Wolford, A., Collins, E. P., and Jarrell, D. B. (1988). Prioritization of TIRGALEX Recommended Components for Further Aging Research. NUREG/CR-5248, PNL-6701, Prepared for U.S. NRC.
Li, Y.-F., and Zio, E. (2012). A Multi-State Model for the Reliability Assessment of a Distributed Generation System via Universal Generating Function. Reliability Eng. Syst. Saf. 106, 28–36. doi:10.1016/j.ress.2012.04.008
Li, Y. F., Zio, E., and Lin, Y. H. (2012). A Multistate Physics Model of Component Degradation Based on Stochastic Petri Nets and Simulation. IEEE Trans. Reliability 61 (4), 921–931.
Ma, J., and Jiang, J. (2011). Applications of Fault Detection and Diagnosis Methods in Nuclear Power Plants: A Review. Prog. Nucl. Energ. 53 (3), 255–266. doi:10.1016/j.pnucene.2010.12.001
Maitloa, A. A., Liua, Y. K., Lakhanb, M. N., Razac, W., Sharb, A. H., Alic, A., ..., and Ahmedb, M. (2020). Recent Advances in Nuclear Power Plant for Fault Detection and Diagnosis-A Review. J. Crit. Rev. 7.
March-Leuba, J., Cacuci, D. G., and Perez, R. B. (1984). Universality and Aperiodic Behavior of Nuclear Reactors. Nucl. Sci. Eng. 86, 401–404. doi:10.13182/nse84-a18640
Matsuoka, T. (2014). Overview of System Reliability Analyses for PSA. In Progress of Nuclear Safety for Symbiosis and Sustainability (pp. 83–95). Springer, Tokyo.doi:10.1007/978-4-431-54610-8_10
Modarres, M., Kaminskiy, M. P., and Krivtsov, V. (2016). Reliability Engineering and Risk Analysis: A Practical Guide. : CRC Press. doi:10.1201/9781315382425
Mohammadhasani, F., and Pirouzmand, A. (2020). Multi-state Unavailability Analysis of Safety System Redundant Components with Aging Effect under Surveillance Testing. Prog. Nucl. Energ. 126, 1–15. doi:10.1016/j.pnucene.2020.103415
Ngarayana, I. W., Murakami, K., and Suzuki, M. (2019). Nuclear Power Plant Maintenance Optimisation: Models, Methods & Strategies. J. Phys. Conf. Ser. 1198, 022005. doi:10.1088/1742-6596/1198/2/022005
Nøkland, T. E., and Aven, T. (2013). On Selection of Importance Measures in Risk and Reliability Analysis. Int. J. Performability Eng. 9 (2), .
Papazoglu, I. A. (2000). Semi-Markovian Reliability Models for Systems with Testable Components and General Test/outage Times. Reliability Eng. Syst. Saf. 68, 121–133.
Shin, S. M., Jeon, I. S., and Kang, H. G. (2015). Surveillance Test and Monitoring Strategy for the Availability Improvement of Standby Equipment Using Age-dependent Model. Reliability Eng. Syst. Saf. 135, 100–106. doi:10.1016/j.ress.2014.11.001
Sim, S. H., and Endrenyi, J. (1993). A Failure-Repair Model with Minimal and Major Maintenance. IEEE Trans. Rel. 42 (1), 134–140. doi:10.1109/24.210285
Soares, W. A., Vasconcelos, V. D., and Rabello, E. G. (2015). Risk-Based Inspection in the Context of Nuclear Power Plants. .
Somani, A. K., Palnitkar, S., and Sharma, T. (1993). Reliability Modeling of Systems with Latent Failures Using Markov Chains. Proc. Ann. Reliab. Maint. Symp., 120–125.
Tomasevicz, C. L., and Asgarpoor, S. (2006). Preventive Maintenance Using Continuous-Time Semi-markov Processes. Proc. Ann. North. Am. Power Symp, 3–8. doi:10.1109/naps.2006.360125
Tomasevicz, C. L., and Asgarpoor, S. (2006, September). Optimum Maintenance Policy Using Semi-markov Decision Processes. In 2006 38th North American Power Symposium (pp. 23–28). IEEE.
Varghese, J. P., and Kumar, G. (2014). Availability Analysis with Opportunistic Maintenance of a Two Component Deteriorating System. Int. J. Mater. Mech. Manufacturing 2 (2), .
Vesely, W. E. (1992). Approaches for Age-dependent Probabilistic Safety Assessments with Emphasis on Prioritization and Sensitivity Studies NUREG/CR-5587. SAIC-92/1137, Prepared for U.S. NRC.
Vesely, W. E., and Rezos, J. T. (1995). Risk-Based Maintenance Modeling. NUREG/CR-6002, BNL-NUREG-52332. Washington, DC: Brookhaven National Laboratory, prepared for division of systems technology office of nuclear regulatory research, U.S. nuclear regulatory commission. doi:10.2172/106641
Wang, W., Maio, F. D., and Zio, E. (2017). Three-loop Monte Carlo Simulation Approach to Multi-State Physics Modeling for System Reliability Assessment. Reliability Eng. Syst. Saf. 167, 276–289. doi:10.1016/j.ress.2017.06.003
Wu, G., Tong, J., Zhang, L., Zhao, Y., and Duan, Z. (2018). Framework for Fault Diagnosis with Multi-Source Sensor Nodes in Nuclear Power Plants Based on a Bayesian Network. Ann. Nucl. Energ. 122, 297–308. doi:10.1016/j.anucene.2018.08.050
Zhang, S., Du, M., Tong, J., and Li, Y.-F. (2019). Multi-objective Optimization of Maintenance Program in Multi-Unit Nuclear Power Plant Sites. Reliability Eng. Syst. Saf. 188, 532–548. doi:10.1016/j.ress.2019.03.034
Keywords: Markov maintenance model, fault tree method, risk-based maintenance, component degradation, VVER-1000 NPP
Citation: Mohammadhasani F and Pirouzmand A (2021) Multi-state Risk-Based Maintenance Analysis of Redundant Safety Systems Using the Markov Model and Fault Tree Method. Front. Energy Res. 9:685634. doi: 10.3389/fenrg.2021.685634
Received: 25 March 2021; Accepted: 22 June 2021;
Published: 26 July 2021.
Edited by:
M. Mustafa Azeem, Harbin Engineering University, ChinaReviewed by:
Qazi Muhammad Nouman Amjad, University of Engineering and Technology Taxila, PakistanAbiodun Ayodeji, Zhejiang University, China
Copyright © 2021 Mohammadhasani and Pirouzmand. This is an open-access article distributed under the terms of the Creative Commons Attribution License (CC BY). The use, distribution or reproduction in other forums is permitted, provided the original author(s) and the copyright owner(s) are credited and that the original publication in this journal is cited, in accordance with accepted academic practice. No use, distribution or reproduction is permitted which does not comply with these terms.
*Correspondence: A. Pirouzmand, cGlyb3V6bUBzaGlyYXp1LmFjLmly