 Li Ning1
 Li Si
Li Si- 1State Grid Beijing Electric Power Corporation, Beijing, China
- 2State Grid Beijing Information and Telecommunication Company, Beijing, China
- 3State Key Laboratory of Alternate Electrical Power System with Renewable Energy Source, Institute of Electrical and Electronic Engineering, North China Electric Power University, Beijing, China
- 4National Energy Investment Group Co. Ltd., Beijing, China
With the development of distributed energy resources (DERs), the power flow (PF) in the distribution network (DN) is changed from unidirectional to bidirectional, resulting in complex control and coordinate measures. Network reconfiguration (NR) is a feasible solution for the power grid side to deal with the complex PF. This paper proposed an edge-cloud-coordinated reconfiguration framework with edge servers (ESs) in the prosumer side and cloud servers (CSs) in the utility grid side, where the edge computing (EC) technology is implemented in ES to support load forecasting (LF), while cloud computing (CC) is used in CS to reconstruct the DN. LF is implemented by the long–short-term memory network to acquire the load information in advance, and the social preference of prosumers has been considered. The NR is formulated as a complex combinatorial optimization problem with the goal of minimizing power losses, while satisfying the power flow and voltage requirement. The NR problems are solved by the proposed advanced harmony search algorithm, which can find the optimal global solution, while satisfying the complex constraints of the NR problem. Numerical results are conducted based on an IEEE 33-bus network, which shows the high accuracy of LF and demonstrates the effectiveness of the proposed framework in terms of reducing more than 40% power losses and satisfying the voltage requirement.
Introduction
With the wide use of distributed energy resources (DERs), such as photovoltaic (PV) and wind energy, an entity with the competence of both production and consumption called prosumer was created (Liu et al., 2018). Prosumers can serve as a seller and buyer in the trading market with the capability of consumption and production, which complicate the power flow (PF) by transferring unidirectional transmission to bidirectional transmission (Ma et al., 2019; Morstyn and McCulloch, 2019). The control and coordinate mechanisms of the system are becoming complex, resulting in challenges for the manager of distribution networks (DNs). Demand response (DR) based on the interaction between prosumers and utility grids or a third-party network manager has gradually become a hot research topic for the solution of the prosumers’ strategies in complex PF (Liu et al., 2017). Although the DR also helps the utility grid to set the strategies for responding to the complex PF, the focus is on the prosumer side. However, network reconfiguration (NR) based on advanced load forecasting (LF) is a good way to solve the problem.
NR can change the PF of the network by changing the state of switches (Baran and Wu, 1989). Sarma et al. (1994) reduce the network to find the alternate paths of power supply to the affected load points by properly merging certain nodes and then find the restorative procedure that satisfied voltage and current constraints to reconfigure the DN under faulty conditions. Moreover, NR can also optimize PF of DN and reduce power losses by changing switch states according to load distribution with the development of fast switches (Liu et al., 2019). The NR problem is a complex nonlinear integer optimization problem. Therefore, obtaining the optimal NR solution of DN within a short period of time is difficult. For facing with the solution, which is difficult, previous studies are mainly divided into two categories: 1) mathematical optimization methods and 2) heuristic algorithms. In terms of the mathematical optimization methods, the NR problem is usually modeled as a mixed-integer cone programming model (Jabr et al., 2012). Based on the mixed-integer cone programming model, the NR problem with distributed generation is solved and the global optimal NR solution is obtained (Jabr et al., 2012), a two-stage robust optimization model is built to consider the load uncertainty in NR problem (Lee et al., 2015), and the worthiness of hourly dynamical NR under renewable energy resource access is analyzed (Dorostkar-Ghamsari et al., 2016). In terms of the heuristic algorithms, the NR solution can be obtained through various heuristic principles. The branch-exchange method means closing a tie switch accompanied with opening a sectionalizing switch and gradually comparing the power losses of different switch states to get the optimal NR solution (Mishra et al., 2017). Through combining with the random walks-based technique, the computational runtime of solving the NR problem based on the branch-exchange method is speeded up (Ababei and Kavasseri, 2011). A segmented-time dynamical NR problem coupled with reactive power contribution of distributed generators is proposed, whose optimal solution is searched by a solution algorithm based on the particle swarm optimization (PSO) method (Chen et al., 2016). However, the mathematical optimization methods and heuristic algorithms are faced with the difficulty of cumbersome and time-consuming solutions.
NR requires operators to decide a large number of switches, and LF is based on a large number of data, which are all computationally heavy tasks. Edge computing (EC) is emerged from the Internet of things that can be used to dramatically improve the computation performance by deploying services at the edge of the network (Ren et al., 2019). EC has the advantages of achieving low latency transmission, saving energy for mobile devices, supporting context-aware computing, and enhancing privacy and security for mobile applications. In recent years, researchers from both academia and industries have investigated a wide range of issues related to EC, which includes system and network modeling, optimal control, and resource allocation (Mao et al., 2017). Besides, the forecasting error often exists in the LF of a single prosumer (Gong et al., 2019) so that an edge server allocated in a distribution transformer (DT) is required for improving the forecasting accuracy by aggregating LF.
According to the current studies, LF is performed via various methods, which can be divided into two categories: conventional and machine learning-based techniques. From the perspective of the conventional methods, a combined probabilistic load forecast model is established based on a constrained quantile regression averaging method (Wang et al., 2019a). Besides, a hybrid model is built for overcoming the computational complexity and forecasting accuracy problems, combining the wavelet transform, and gene expression programming (Al-Hilfi et al., 2021). However, the performance of conventional methods is unsatisfying in nonlinear load series forecasting due to the linear model established. Therefore, the machine learning-based techniques have been widely used in LF recently (Xu et al., 2018; Chen et al., 2019; Jawad et al., 2020). An extreme learning machine-based predictor is proposed, where the weighted averaging is used to combine the individual forecast outputs for the accuracy improvement (Song et al., 2016). Moreover, capable of solving the gradient vanishing problems, the long–short-term memory (LSTM) network is employed in the short-term forecasting problems involving time series (Rafi et al., 2021).
A multilayer data flow processing system consisting of a cloud center on the top layer, EC servers on the middle layer, and edge devices on the bottom layer has been proposed in Wang et al., 2019b. Mach and Becvar, 2017 describe the major application scenarios that adapt to EC and focus on three major areas, that is, computation offloading decisions, computing resource allocation, and mobility management. A comprehensive model designed to solve the optimization problem of online resource allocation in edge clouds and an efficient online algorithm were proposed in Wang et al., 2019c, which are based on the regularization technique under unpredictable resource prices and user movements. Therefore, with the powerful computation capacities, LF and NR with a huge computation cost can be solved with the help of EC and cloud computing (CC), respectively. Therefore, LF and NR with a huge computation cost and time can be solved by the computation allocation in EC and CC. Moreover, the computation time can be further reduced by the parallel computation in multiple edge servers.
In this paper, an edge-cloud-coordinated reconfiguration framework (ECCRF) was proposed to manage the LF tasks in the prosumer side and NR tasks in the power grid side. The social preference of each prosumer is also considered in the framework during the process of LF. The main contributions include the following:
1) An ECCRF with edge servers (ESs) in the DT of the prosumer side and cloud servers (CSs) in the utility grid side is created, where the EC technology is implemented in ES to provide LF, while CC is used in CS to reconstruct the DN.
2) The short-term LF tasks considering the social preference of prosumers have been suggested for ES, enabling the ES to conduct the LF for an aggregated prosumer with similar preference under a DT and providing the basic execution conditions for tasks in the CS.
3) NR is implemented in CS due to the fact that it is a system level task that required information of the whole system. Based on the LF results, NR is formulated as an optimization problem with the goal of minimizing power losses. Besides, an advanced harmony search algorithm was proposed for solving the NR tasks.
Edge-Cloud-Coordinated Reconfiguration Framework
Overview of the Framework
The ECCRF is based on EC and CC, consisting of two aspects: the physical field and cyber field. In the physical field, the major entities are PV prosumers, distribution transformers, and physical DN. With the competence of production and consumption of PV prosumers, they act as either a seller or buyer based on their load profiles, which have influence on the PF of the DN. Each DT separates prosumers to different parts, allowing prosumer access to DN in multiple areas. The NR of the DN should be considered to suit the new PF for reducing power loss and increasing voltage stability and frequency stability.
In the cyber field, there are the user energy management system (UEMS), multiple ESs, and a CS, which correspond to prosumers, DT, and DN of the physical field, respectively. With the metering and a little computation capacity, the UEMS can help users collecting load information, adjusting load distribution, etc. The ES located near each DT is the fundamental of EC, focusing on the control in the DT level. The UEMS and ES belong to the user side, aimed at the control and operation of prosumers. However, as the fundamental of CC, the CS is focused on the power grid side, in charge of global operation of the DN in the system level. Each entity has a special communication mechanism about its information. The specific topology of the ECCRF with these two fields is shown in Figure 1.

FIGURE 1. ECCRF contains the physical field and cyber field. The EC technology is implemented in ES to provide LF, while the CC is used in CS to reconstruct the DN.
Edge Server and Cloud Server Role
To implement the NR in the physical field, LF was considered in the framework assisted by the cyber field. The load information of prosumers can be obtained by LF ahead of time, which is useful to plan the network future operational structure in advance.
Load Forecasting Tasks From Prosumers
UEMS is used to be the entity to provide individual load information to the market for prosumers to participate in the trading, but LF is a heavy computation task for UEMS with limited computation resources and high cost to transmit to the cloud. With the powerful computation capacity and storage, the ES coordinates the operation of many prosumers that access DTs, and the LF task can be offloaded to ES with less transmission cost and time. As the goal of LF is to alleviate the influence of dynamic load consumption of prosumers on the power grid, LF can be implemented in the ES.
Reconfigured Tasks of the Distribution Network
The CS serves as the manager of the DN in power grid side, which in charge of the system level control, such as the NR problem, with the powerful computation capacities. Based on the LF results that transmit from ES, the CS can get the future PF in advance and find a best network structure for the power grid by analyzing switching patterns. Therefore, the coordination of edge (aimed at LF) and cloud (focused on NR) is built, proposing solutions for the power grid in face of random access of prosumers and dynamic load consumption. The overall flowchart of ECCRF is provided Figure 2.
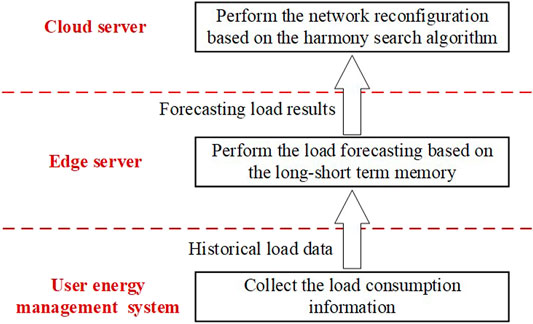
FIGURE 2. Overall flowchart of ECCRF.
Data-Driven Load Response of Prosumers
The influence of dynamic load distribution of prosumers on the DN was considered, so the control mechanism on the power grid side was mainly analyzed, that is, the NR. With the powerful computation capacity and storage, the ES can conduct LF and predict the aggregated load of all prosumers under a DT so as to facilitate the power grid side to analyze the impact of the prosumers’ trading. The load information was collected from the smart meter installed in each prosumer and then sent to ES for data analyzing (i.e., LF). The social preference of an individual prosumer will have a great influence on the system energy management (Chen et al., 2021) and also affect the LF, that is, each prosumer has individual preference, so that the prosumer can be aggregated to multiple categories according to their load profiles to enhance the accuracy of LF. Besides, the load distribution obeys a regular distribution in 1 day, and the weekly and holiday load distributions are time-correlated. Therefore, the learning of load information should be based on the long-term load profiles (24 h in this paper). Separating the prosumers’ load values in each time slot may ignore the time correlation. Because the memory cell of LSTM would achieve the transformation and maintaining processes of the time-series load distribution, the LSTM network is capable of implementing the time-series LF (Wang et al., 2019c). Therefore, the LSTM model is used for LF, which relates the load distribution between current and previous time slots.
Data-Driven Load Response Strategies
Suppose there are P prosumers in the system with access to different DTs (the number is A), and the DT has the number of
where
The net load of the prosumer includes the comprehensive load information consisting of PV production
According to the characteristic of historical load curves, the prosumers can be aggregated to four categories shown in Figure 3: single-peak prosumers, that is, commercial users; double-peak prosumers, that is, large industries and government utilities; peak-avoiding prosumers, that is, small factories; and stationary prosumers, that is, light industries. The load consumption of single-peak prosumers, double-peak prosumers, and peak-avoiding prosumers is relevant to time, while that of the stationary prosumers is independent of time. There is difference in the peak occurrence time of single-peak prosumers, double-peak prosumers, and peak-avoiding prosumers. Moreover, the change of load curve of double-peak prosumers is more violent than those of single-peak prosumers and peak-avoiding prosumers.
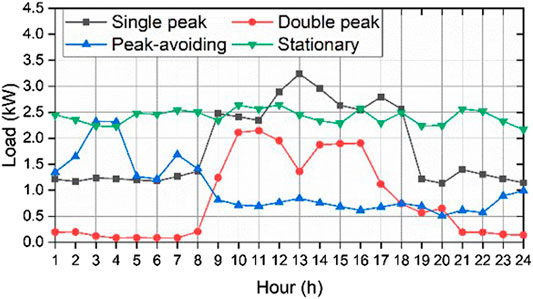
FIGURE 3. Load curves of four different categories.
The data-driven method, curve clustering, is applied to divide the categories of prosumers based on the load curves. Considering the clustering goal being determined by the characteristic of the load curve in the whole time slot, the rate of load curve is used as the indicator to determine which categories the prosumers belong to. For obtaining the indicator, take the number of M sample points from the load curve, form the vector M, and calculate differentials
where
Prosumer Behavior Characteristic
Under the background of DN reconfiguration, the short-term (e.g., day-ahead) LF and predicting the current load through the historical load data were considered. Some features related to net load distribution are considered as the LSTM model input:
1) The load data prior to the forecast day, which are a time series consisting of 24 elements from every 1 h for 24 h:
2) The day in 1) that used to predict the load corresponds to the day of the week: W, where the range of W is 0–6.
3) The day in 1) that used to predict the load corresponds to a holiday or not: H, where the holiday is 1 and not a holiday is 0.
4) The temperature of the day in 1) used to predict the load: T, where T consists of three elements, maximum temperature, minimum temperature, and average temperature.
Due to the fact that each feature has different dimensions, the normalization method is used in these features, converting the range of each feature to (0, 1). The L and T are general data, converted by max-min normalization, while the W represents category data, converted by one hot encoder, which transfers the data dimensions to the number of categories, and only one category in each dimension is 1 and the rest is 0. The feature of 2 day load data (1 day prior to the forecast day and 1 week prior to the forecast day) after normalization was chosen as the input vector for LF, and each cluster has a specific feature vector and forecast separately by the LSTM model
Long–Short-Term Memory Realization Method
The LSTM model consists of three layers: input layer, hidden layer, and output layer. The time series feature with multidimensions is input to the model through the input layer, and the load of the forecasting day is the output. The objective of the LSTM model is to build a connected relation between input and output in the hidden layer, and then, the model can used to load forecast when the input data are known.
The LSTM model has advantages in handling problems that have long-term dependencies, like the load of the forecasting day is related to the load 1 day before or 1 week before. The advantage comes from the forget mechanism with three gates (forget gate, input gate, and output gate) in the block of the hidden layer, which is shown in Figure 4. The multidimension load feature
where the
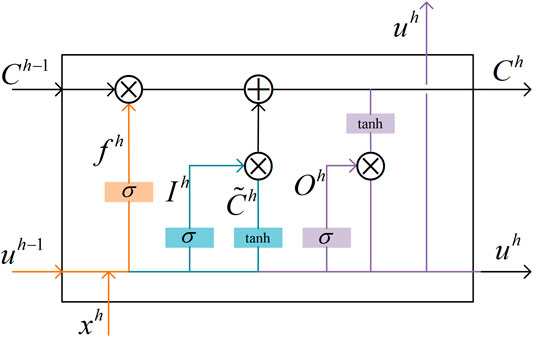
FIGURE 4. Structure of the hidden layer in the LSTM model, where three gates (forget gate, input gate, and output gate) ensure the time-series forecasting capability.
The first learning process is based on Eqs. 6–11 and generates the initial weight matrix W and bias b. Then, they will be updated through the back-propagation through time (BPTT) process by minimizing the error accumulated in the first step using the loss function (Goodfellow et al., 2016)
where Q is the number of output units;
Reconfiguration Problem Formulation and the Solving Algorithm
Due to the prosumers with load consumption, random access to the DN will change the PF in the whole system. To realize the requirement of voltage and PF, the NR is formulated as an optimization problem under the assistance of ES and CS.
High-speed switching devices can be used to achieve fast transient response and are extensively used in the connection of submicrogrids that are subdivided from a microgrid (Kermany et al., 2017). It can be seen that high-speed switching devices shorten the transient response times of the system and make a significant contribution to the stability of the power system. With this technology maturity and cost reduction of the field equipment, its use will be very common in the future. The reconfiguration is conducted by these methods, and the time horizon will be in days.
Formulation of the Problem
PF in the DN is calculated by the forward and backward substitution methods because of the radial structure in the DN (Das et al., 1995). This method first stratifies the nodes to find the root node and network connection relation, then calculates the power of each branch through forward traversal and calculates the voltage of each node through backward traversal, and finally calculates the PF of the system
where ij is the branch between node i and node j; the total node in DN is N;
The power loss can be calculated based on the PF of the system, and each single branch has an individual power loss, but it is insignificant for analyzing the whole system power losses, which is given as
When the load of each prosumer changes or new user accesses the system, the power consumption of each node will also change; then, the CS will conduct DN reconfigured calculations and adjust the switching pattern according to the target of minimum power loss. The switching pattern will affect the network structure so that the system parameters (e.g.,
where
Harmony Search Algorithm
The network structure was expressed as a directed graph to build the mathematical model, and each switching pattern corresponds to a specific graph. The PF calculation should be implemented in each different switching pattern to obtain the power loss, voltage, and optimal reconfiguration solution. Due to the fact that finding the switching states is a combinatorial problem and calculating the power loss is an optimization problem, the reconfiguration problem expressed in Eqs. 17–20 is a complex combinatorial optimization problem related to graph theory, which is difficult to solve.
The harmony search algorithm (HSA) is a heuristic global search algorithm, which has been successfully applied in combinatorial optimization problems (Al-Omoush et al., 2019), such as NR with distributed generation (Rao et al., 2013) and wireless sensor network coverage (Alia and Al-Ajouri, 2017). The goal of HSA is to find a pleasing harmony (e.g., the global optimal solution) for the musician in a scene where instruments with different tones are playing together. Each instrument has its pitch range, and the pleasing harmony is measured by an auditory standard. Under the NR background, the objective function of minimizing power loss (Eq. 16) is the auditory standard of the musician, the sectionalizing switches
1) Initialization: There are five parameters of the HSA which should be set up in advance, which consist of harmony memory size (HMS), (e.g., the size of the solution space), harmony memory considering rate (HMCR), (e.g., the probability of selecting a set of solutions from the HM), pitch adjusting rate (PAR), (e.g., probability of fine tuning when harmony is selected from HM), tuning bandwidth (bw), (e.g., the adjustment range of the fine tuning), and maximum iterations (Tmax), (e.g., the number of maximum iterations).
2) Generate the initial HM: The initial HM is generated by many random combination of each instrument
where
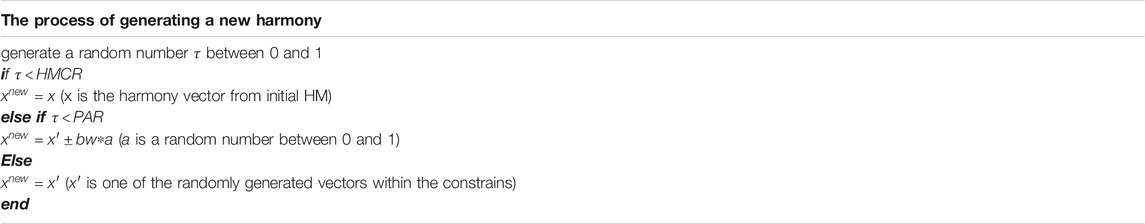
3) Improvising a new harmony: During the improvisation, the new harmony vector
4) Update the HM: If the objective function (Eq. 16) under the new harmony vector is better than the original one, then the new harmony vector
5) Judge termination conditions: The end of the algorithm is controlled by the objective function or the number of maximum iterations Tmax, and in general, the algorithm is stopped when the Tmax is reached.
The HSA is improved to fit the complex combinatorial optimization problem under the NR background with LF. Each node in DN is connected by a branch with a sectionalizing switch or tie switch, and one tie switch can form a loop with other sectionalizing switches in the network. The loop is specified in advance, and one of the switches of a loop should be open to satisfy the radial structure of DN; then, the network structure can be obtained from the state of open switches. The harmony vector can be expressed as follows:
where n is the number of loops in the DN, each
HSA has a process of randomly selecting and generating vectors. However, the change of the switching state should be based on the loop to guarantee the radial network in the NR problem, and randomly changing every element of the harmony vector cannot keep the radial system. Therefore, the advanced HSA (AHSA) is proposed to generate initial HM and left HM at first, and the harmony vectors in both matrixes are switch combinations that satisfy the radial network requirement and contain all possible combinations. The HM in AHSA is shown as follows:
where each vector k is the switching pattern that satisfies the radial network requirement, and the total is the total number of possible switching combinations.
The process of improvising a new harmony is changed to selecting the vectors in initial HM and left HM; if the random number τ is larger than HMCR, then
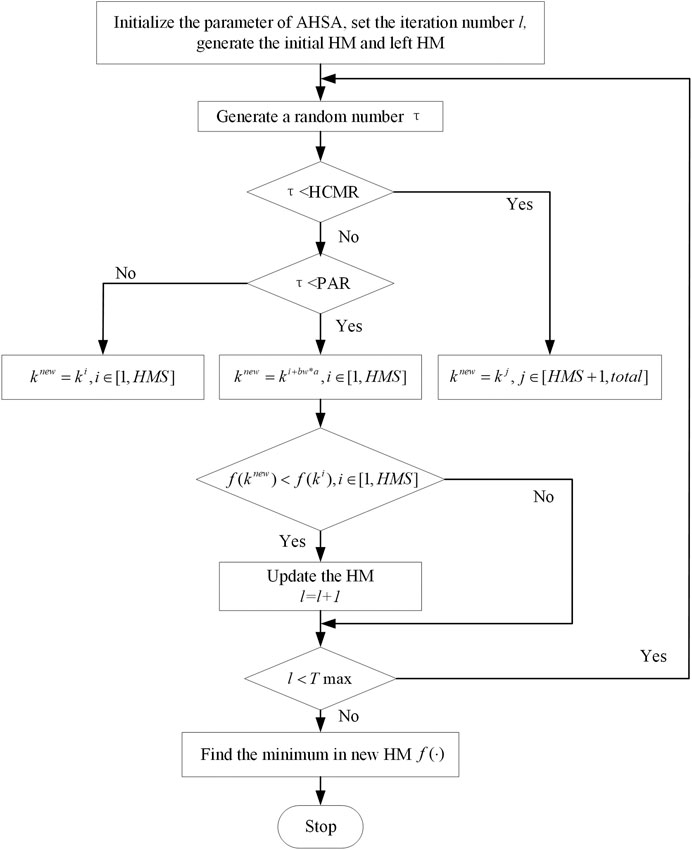
FIGURE 5. Flowchart of AHSA.
Case Study
Basic Data
An IEEE 33-bus distribution system, as shown in Figure 4, is used here to verify the performance of the proposed framework. There are five DT accesses to five buses, and the number of the prosumers in the system is 60, which is connected to medium-voltage feeders and includes four categories, that is, commercial users, large industries and government utilities, small factories and stationary prosumers, and light industries. Five loops for AHSA are specified in advance, as shown by the red circle in Figure 6. A CS and five ESs are allocated in the system. Each ES is set in the DT, which is in charge of forecasting several prosumers’ load according to their historic information from the user energy management system, that is, load data, day of the week, holiday or not, and temperature. CS is allocated in the manager of the distribution network, such as the system operator, to conduct the network reconfiguration tasks.
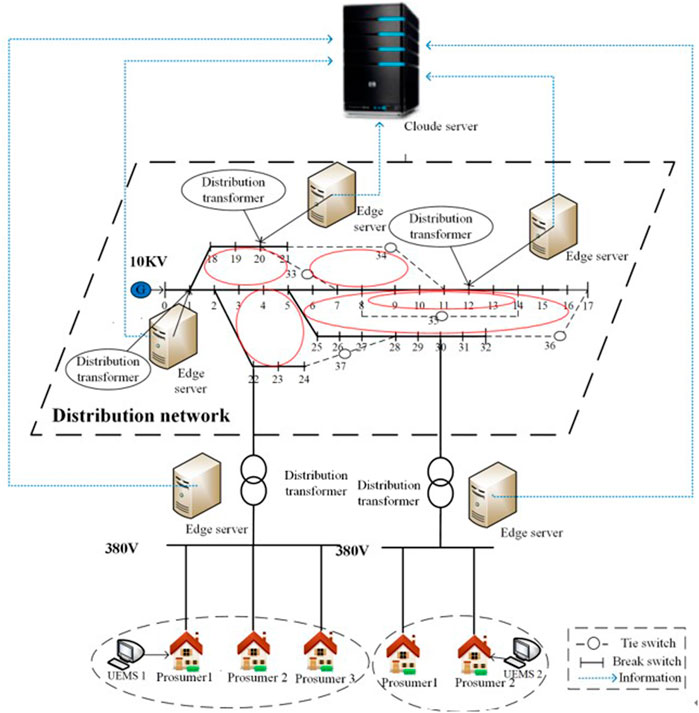
FIGURE 6. IEEE 33-bus distribution system in the reconfiguration framework with five DT accesses to five buses, 60 prosumers classified into four categories, a CS, and five ESs allocated.
Results of the Edge-Cloud-Coordinated Reconfiguration Framework on a Nonholiday
For analyzing the scenario of a nonholiday, Monday is selected as an example.
1) Results of the load forecasting in the edge server
The LSTM model is implemented using MATLAB toolbox LSTM with an Intel Core i5-8250 CPU 1.60 GHz, 16 G memory computer. The input data are the historic information in 24 time slots with four features. The output layer is the total load in 24 h; the hidden layer has 100 units, the learning rate is 0.01, the gradient threshold is 1, and the maximum epoch is 200.
The data used to train the model include 420 samples from 60 users. To verify the effectiveness and accuracy of the model, 88% of the data are used to train the model and 12% are used to test the model. The input data consist of a cell array with four dimensions, and the output data are an array with one dimension, resulting in four units in the input layer and one unit in the output layer. The learning process using the MATLAB toolbox is shown in Figure 7. Root-mean-squared error (RMSE) is the error between the predicted value and true value. From Figure 7, the RMSE is almost 0 near the 5000th iteration and remains stable at around 0 with minor fluctuations. The “Loss” in the bottom graph reflects the changes in the loss function during the iteration process; the values decrease with the increase in the number of iterations. It is observed that the RMSE and loss reach a steady state after the 5000th iteration, indicating the success of the learning process. Therefore, the LSTM model trained by ES can realize short-term LF within a certain range of accuracy. The load data in the predicted day obtained by LSTM are shown in Table 1.
2) Results of the Network Reconfiguration in the Cloud Server
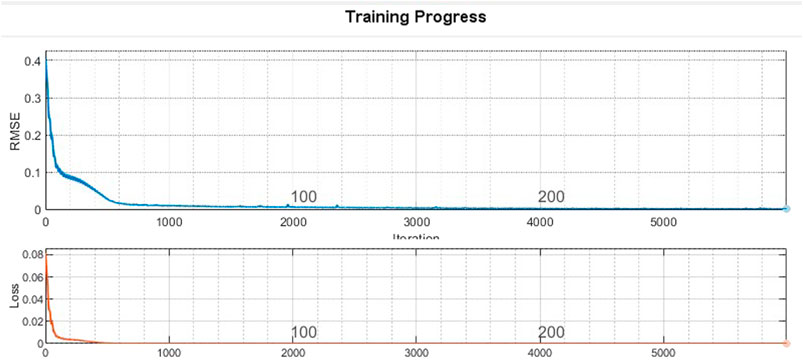
FIGURE 7. Learning process of LSTM model, where the root mean squared error (RMSE) is the error between the predicted value and true value, and the loss is the changes in the loss function during the iteration process.
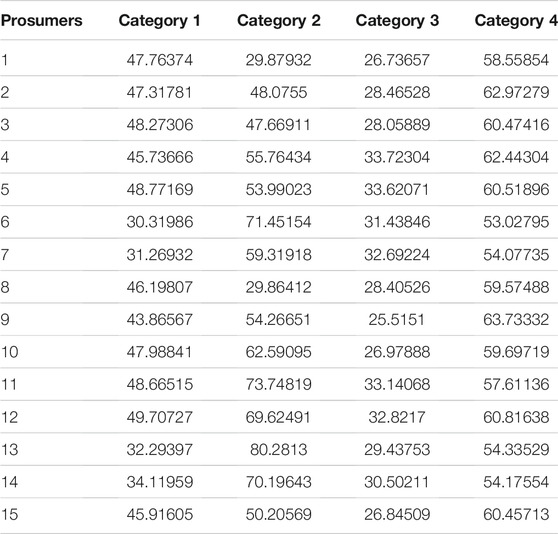
TABLE 1. Predicted load of partly prosumers.
The CS minimizes the network losses by changing the state of the switches when the load information of prosumers is obtained from ES, that is, conducting NR based on the forecasting PF. The switching pattern under the new PF is calculated through AHSA, as shown in Figure 8, and the open switches of the minimum power losses in each loop are in the branches {6–7, 11–21, 9–10, 16–17, 27–28}, which satisfy the radial structure of the distribution system. Besides, the NR a day ahead will provide the feasible solution for complexity PF raised by increasing number of prosumers.
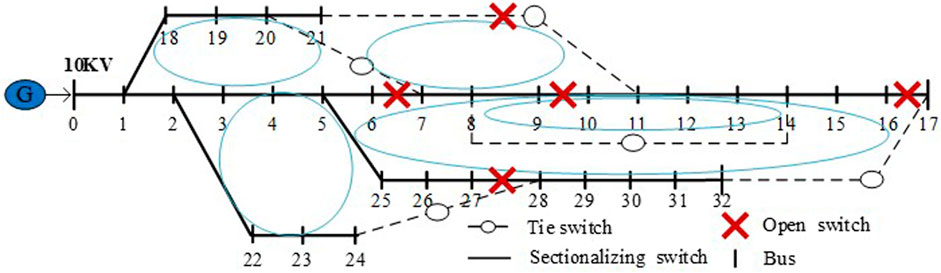
FIGURE 8. Switching pattern after NR, where the open switches of the minimum power losses in each loop are 7, 34, 10, 17, and 28.
The process of power loss changes during the AHSA iteration and the corresponding bus voltage are partly shown in Table 2. The buses shown in Table 2 are away from the power supply bus due to the fact that the voltage level of these buses will suffer the most severe drop and convenience to judge the operation requirement of the distribution system. The first iteration is the initial state with open switches in the branches {7–20, 11–21, 8–14, 17–32, 24–28}. It is clear that the power losses are higher, and the bus voltage drops seriously, which does not satisfy the operation requirement of the distribution system. The power loss decreases with the iteration process until the optimal result of 153.19 W is obtained, which is about 42% less than the initial power loss, and the bus voltages are all higher than 0.94 p. u., which are the required constraints of the distribution system.
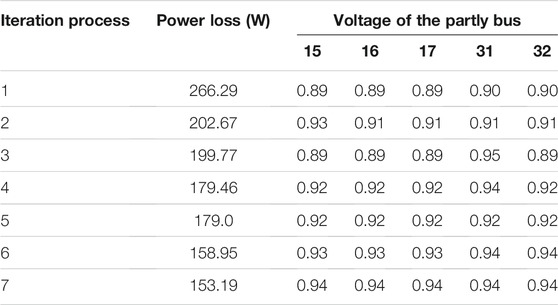
TABLE 2. Iteration process of the AHSA, where the minimum power loss is 153.19 W.
Results of the Edge-Cloud-Coordinated Reconfiguration Framework on a Holiday
According to the load information on the holiday, LF and NR on Saturday are performed to improve case analysis.
1) Results of the load forecasting in the edge server
In the Saturday scenario, the basic parameters of the LSTM model are the same as the parameters of the Monday scenario. Besides, the training process and required database of the LSTM model are the same in the two scenarios so that the trained mapping mechanism by the edge server is identical. Therefore, only the input data required for the forecasting should be changed, and they are composed of load data of Friday, day of the week, holiday, and temperature. Through the trained LSTM network, the load data of prosumers on Saturday can be predicted by the edge server, and the load of partial prosumers belonging to different categories is shown in Figure 9. It is clear that there is an obvious difference in the load characteristics of prosumers.
2) Results of the network reconfiguration in the cloud sever
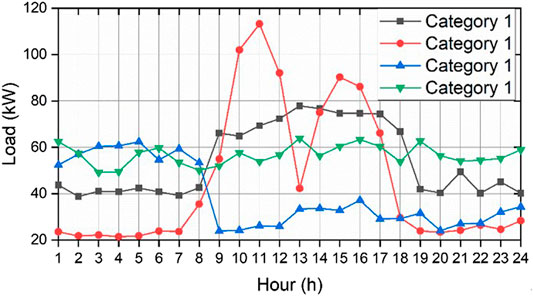
FIGURE 9. Predicted load of partial prosumers.
According to predicted load data, the NR is performed by the cloud server. The optimal reconfiguration strategy is obtained through AHSA, that is, opening the switch in the branches {6–7, 9–10, 13–14, 16–17, 27–28}. The optimal topology of the distribution system shown in Figure 10 satisfies the radial structure of the distribution system. Moreover, the minimum power loss of 152.81 W decreases by 44.46% compared with the initial power loss of 275.13 W, which is in opening the switches in the branches {7–20, 11–21, 8–14, 17–32, 24–28}. It is evident from Figure 11 that the bus voltages are all higher than 0.94 p. u., satisfying the bus voltage constraints of the distribution system.
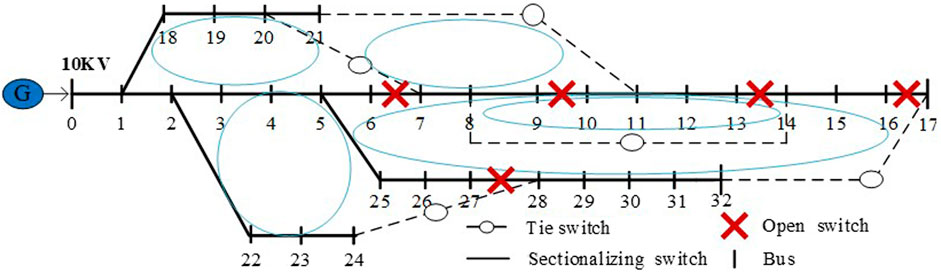
FIGURE 10. Optimized structure of the distribution system on Saturday.
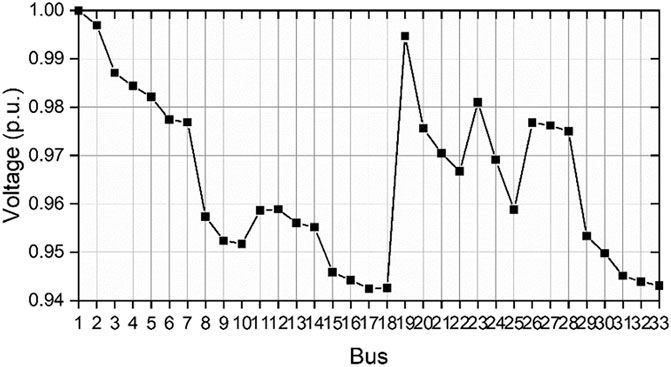
FIGURE 11. Bus voltage of the distribution system.
Practical Feasibility of the Coordinated Reconfiguration Framework.
The proposed ECCRF is proposed for dealing the prosumer-based DR with complex power flow in the supporting of the infrastructure. The load forecasting can be implemented in a Jetson TX2 development board equipped with an NVIDIA Pascal GPU and a CPU cluster, which is optimized for higher single-thread performance, and an ARM Cor-tex-A57 Quad-Core CPU, which is better suited for multithreaded applications. However, the NR can be implemented in a domestic tower server with two Intel Xeon Scalable Gold 6,248 CPUs and two NVIDIA RTX 2080Ti GPUs. Besides, the information sharing between the prosumers and network can be realized by the communication system based on the wireless channels in the private 4G/5G network with a virtual private network (VPN) as well as equipment support of ESP and prosumers’ UEMS.
Conclusion
In this paper, we proposed an ECCRF to manage the LF tasks in the prosumer side and NR tasks in the power grid side. The framework realized the NR with the goal of minimizing network losses, and the social preference of each prosumer is taken into consideration. The simulation was conducted in a designed test bed with the IEEE 33-bus distribution system. The holiday and non-holiday cases are considered in the studies. It is shown that in both cases, the trained LSTM network can achieve the high-accuracy LF for the mentioned four kinds of load characteristics. Then, the NR results show that with the high-accuracy load information, the power losses of the whole network can be reduced more than 40%, and the volage requirement can always be satisfied. At the current stage, the method is mainly suitable for a DN with a certain number of buses and the load information of the bus is fully known. For a DN with a large number of buses or some load information being not completely known, the NR will be different, and the requirement of computation capacity will be increased. Therefore, it is very interesting to study the DN reconfiguration with many buses and incomplete information in the future.
Data Availability Statement
The raw data supporting the conclusions of this article will be made available by the authors, without undue reservation.
Author Contributions
LN contributed to the conception of the study and write the manuscript; LS contributed to the formulation of the problem and the research of the method, LN contributed significantly to analysis and supervision; ZF helped perform the analysis with constructive discussions.
Conflict of Interest
LS was employed by the company State Grid Beijing Information and Telecommunication Company, and ZF was employed by the company National Energy Investment Group Co., Ltd.
The remaining authors declare that the research was conducted in the absence of any commercial or financial relationships that could be construed as a potential conflict of interest.
Publisher’s Note
All claims expressed in this article are solely those of the authors and do not necessarily represent those of their affiliated organizations, or those of the publisher, the editors and the reviewers. Any product that may be evaluated in this article, or claim that may be made by its manufacturer, is not guaranteed or endorsed by the publisher.
Acknowledgments
The authors would like to thank State Key Laboratory of Alternate Electrical Power System With Renewable Energy Source for helpful discussions on topics related to this work.
References
Ababei, C., and Kavasseri, R. (2011). Efficient Network Reconfiguration Using Minimum Cost Maximum Flow-Based Branch Exchanges and Random Walks-Based Loss Estimations. IEEE Trans. Power Syst. 26 (1), 30–37. doi:10.1109/tpwrs.2010.2052076
Al-Hilfi, H. A. H., Abu-Siada, A., and Shahnia, F. (2021). Estimating Generated Power of Photovoltaic Systems during Cloudy Days Using Gene Expression Programming. IEEE J. Photovoltaics. 11 (1), 185–194. doi:10.1109/jphotov.2020.3029217
Al-Omoush, A. a. A., Alsewari, A. A., Alamri, H. S., and Zamli, K. Z. (2019). Comprehensive Review of the Development of the Harmony Search Algorithm and its Applications. IEEE Access. 7, 14233–14245. doi:10.1109/access.2019.2893662
Alia, O. M. d., and Al-Ajouri, A. (2017). Maximizing Wireless Sensor Network Coverage with Minimum Cost Using Harmony Search Algorithm. IEEE Sensors J. 17 (3), 882–896. doi:10.1109/jsen.2016.2633409
Baran, M. E., and Wu, F. F. (1989). Network Reconfiguration in Distribution Systems for Loss Reduction and Load Balancing. IEEE Trans. Power Deliv. 4 (2), 1401–1407. doi:10.1109/61.25627
Chen, K., Chen, K., Wang, Q., He, Z., Hu, J., and He, J. (2019). Short-Term Load Forecasting with Deep Residual Networks. IEEE Trans. Smart Grid. 10 (4), 3943–3952. doi:10.1109/tsg.2018.2844307
Chen, L., Liu, N., Li, C., and Wang, J. (2021). Peer-to-peer Energy Sharing with Social Attributes: A Stochastic Leader-Follower Game Approach. IEEE Trans. Ind. Inform. 17 (4), 2545–2556. doi:10.1109/TII.2020.2999328
Chen, S., Hu, W., and Chen, Z. (2016). Comprehensive Cost Minimization in Distribution Networks Using Segmented-Time Feeder Reconfiguration and Reactive Power Control of Distributed Generators. IEEE Trans. Power Syst. 31 (2), 983–993. doi:10.1109/tpwrs.2015.2419716
Das, D., Kothari, D. P., and Kalam, A. (1995). Simple and Efficient Method for Load Flow Solution of Radial Distribution Networks. Int. J. Electr. Power Energ. Syst. 17 (5), 335–346. doi:10.1016/0142-0615(95)00050-0
Dorostkar-Ghamsari, M. R., Fotuhi-Firuzabad, M., Lehtonen, M., and Safdarian, A. (2016). Value of Distribution Network Reconfiguration in Presence of Renewable Energy Resources. IEEE Trans. Power Syst. 31 (3), 1879–1888. doi:10.1109/tpwrs.2015.2457954
Gong, X., Cardenas-Barrera, J. L., Castillo-Guerra, E., Cao, B., Saleh, S. A., and Chang, L. (2019). Bottom-Up Load Forecasting with Markov-Based Error Reduction Method for Aggregated Domestic Electric Water Heaters. IEEE Trans. Ind. Applicat. 55 (6), 6401–6413. doi:10.1109/tia.2019.2936330
Goodfellow, I., Bengio, Y., and Courville, A. (2016). “Sequence Modeling: Recurrentand Recursive Nets,” Deep Learning. Cambridge, MA, USA: MIT Press, 378–415.
Jabr, R. A., Singh, R., and Pal, B. C. (2012). Minimum Loss Network Reconfiguration Using Mixed-Integer Convex Programming. IEEE Trans. Power Syst. 27 (2), 1106–1115. doi:10.1109/tpwrs.2011.2180406
Jawad, M., Nadeem, M. S. A., Shim, S.-O., Khan, I. R., Shaheen, A., Habib, N., et al. (2020). Machine Learning Based Cost Effective Electricity Load Forecasting Model Using Correlated Meteorological Parameters. IEEE Access. 8, 146847–146864. doi:10.1109/access.2020.3014086
Kermany, S. D., Joorabian, M., Deilami, S., and Masoum, M. A. S. (2017). Hybrid Islanding Detection in Microgrid with Multiple Connection Points to Smart Grids Using Fuzzy-Neural Network. IEEE Trans. Power Syst. 32 (4), 2640–2651. doi:10.1109/tpwrs.2016.2617344
Lee, C., Liu, C., Mehrotra, S., and Bie, Z. (2015). Robust Distribution Network Reconfiguration. IEEE Trans. Smart Grid. 6 (2), 836–842. doi:10.1109/tsg.2014.2375160
Liu, N., Cheng, M., Yu, X., Zhong, J., and Lei, J. (2018). Energy-Sharing Provider for PV Prosumer Clusters: A Hybrid Approach Using Stochastic Programming and Stackelberg Game. IEEE Trans. Ind. Electron. 65 (8), 6740–6750. doi:10.1109/tie.2018.2793181
Liu, N., Yu, X., Wang, C., and Wang, J. (2017). Energy Sharing Management for Microgrids with PV Prosumers: A Stackelberg Game Approach. IEEE Trans. Ind. Inf. 13 (3), 1088–1098. doi:10.1109/tii.2017.2654302
Liu, Y., Li, J., and Wu, L. (2019). Coordinated Optimal Network Reconfiguration and Voltage Regulator/DER Control for Unbalanced Distribution Systems. IEEE Trans. Smart Grid. 10 (3), 2912–2922. doi:10.1109/tsg.2018.2815010
Ma, L., Liu, N., Zhang, J., and Wang, L. (2019). Real-Time Rolling Horizon Energy Management for the Energy-Hub-Coordinated Prosumer Community from a Cooperative Perspective. IEEE Trans. Power Syst. 34 (2), 1227–1242. doi:10.1109/tpwrs.2018.2877236
Mach, P., and Becvar, Z. (2017). Mobile Edge Computing: A Survey on Architecture and Computation Offloading. IEEE Commun. Surv. Tutorials. 19 (3), 1628–1656. doi:10.1109/comst.2017.2682318
Mao, Y., You, C., Zhang, J., Huang, K., and Letaief, K. B. (2017). A Survey on Mobile Edge Computing: The Communication Perspective. IEEE Commun. Surv. Tutorials. 19 (4), 2322–2358. doi:10.1109/comst.2017.2745201
Mishra, S., Das, D., and Paul, S. (2017). A Comprehensive Review on Power Distribution Network Reconfiguration. Energy Syst. 8 (2), 227–284. doi:10.1007/s12667-016-0195-7
Morstyn, T., and McCulloch, M. D. (2019). Multiclass Energy Management for Peer-To-Peer Energy Trading Driven by Prosumer Preferences. IEEE Trans. Power Syst. 34 (5), 4005–4014. doi:10.1109/tpwrs.2018.2834472
Rafi, S. H., Nahid-Al-Masood, , Deeba, S. R., and Hossain, E. (2021). A Short-Term Load Forecasting Method Using Integrated CNN and LSTM Network. IEEE Access. 9, 32436–32448. doi:10.1109/access.2021.3060654
Rao, R. S., Ravindra, K., Satish, K., and Narasimham, S. V. L. (2013). Power Loss Minimization in Distribution System Using Network Reconfiguration in the Presence of Distributed Generation. IEEE Trans. Power Syst. 28 (1), 317–325. doi:10.1109/tpwrs.2012.2197227
Ren, J., Yu, G., He, Y., and Li, G. Y. (2019). Collaborative Cloud and Edge Computing for Latency Minimization. IEEE Trans. Veh. Technol. 68 (5), 5031–5044. doi:10.1109/tvt.2019.2904244
Sarma, N. D. R., Prasad, V. C., Prakasa Rao, K. S., and Sankar, V. (1994). A New Network Reconfiguration Technique for Service Restoration in Distribution Networks. IEEE Trans. Power Deliv. 9 (4), 1936–1942. doi:10.1109/61.329526
Song, Li., Goel, L., and Wang, P. (2016). An Ensemble Approach for Short-Term Load Forecasting by Extreme Learning Machine. Appl. Energ. 170, 22–29. doi:10.1016/j.apenergy.2016.02.114
Wang, L., Jiao, L., Li, J., Gedeon, J., and Mühlhäuser, M. (2019). MOERA: Mobility-Agnostic Online Resource Allocation for Edge Computing. IEEE Trans. Mobile Comput. 18 (8), 1843–1856. doi:10.1109/tmc.2018.2867520
Wang, P., Yao, C., Zheng, Z., Sun, G., and Song, L. (2019). Joint Task Assignment, Transmission, and Computing Resource Allocation in Multilayer Mobile Edge Computing Systems. IEEE Internet Things J. 6 (2), 2872–2884. doi:10.1109/jiot.2018.2876198
Wang, Y., Zhang, N., Tan, Y., Hong, T., Kirschen, D. S., and Kang, C. (2019). Combining Probabilistic Load Forecasts. IEEE Trans. Smart Grid. 10 (4), 3664–3674. doi:10.1109/tsg.2018.2833869
Keywords: edge-cloud-coordinated computing, network reconfiguration, load forecasting, distributed energy resource, long–short-term memory
Citation: Ning L, Si L, Nian L and Fei Z (2021) Network Reconfiguration Based on an Edge-Cloud-Coordinate Framework and Load Forecasting. Front. Energy Res. 9:679275. doi: 10.3389/fenrg.2021.679275
Received: 11 March 2021; Accepted: 26 August 2021;
Published: 22 September 2021.
Edited by:
Mingyang Sun, Zhejiang University, ChinaReviewed by:
Dazhong Ma, Northeastern University, ChinaNarottam Das, Central Queensland University, Australia
Sivkumar Mishra, Biju Patnaik University of Technology, India
Copyright © 2021 Ning, Si, Nian and Fei. This is an open-access article distributed under the terms of the Creative Commons Attribution License (CC BY). The use, distribution or reproduction in other forums is permitted, provided the original author(s) and the copyright owner(s) are credited and that the original publication in this journal is cited, in accordance with accepted academic practice. No use, distribution or reproduction is permitted which does not comply with these terms.
*Correspondence: Liu Nian, NTAxMDIxMDFAbmNlcHUuZWR1LmNu