 Wei Li
 Ruidi Han
95% of researchers rate our articles as excellent or good
Learn more about the work of our research integrity team to safeguard the quality of each article we publish.
Find out more
ORIGINAL RESEARCH article
Front. Energy Res. , 01 February 2022
Sec. Sustainable Energy Systems
Volume 9 - 2021 | https://doi.org/10.3389/fenrg.2021.678828
This article is part of the Research Topic Emerging Solutions for Increasing The Market Value of Wind Energy Technology in The Energy Transition View all 3 articles
China has promoted the development of the new energy power generation industry since 2013. However, the high proportion of unique energy access to the grid brings greater volatility and uncertainty. One effective way to solve these problems is incentivizing shiftable loads (SLs) to demand response (DR). The low enthusiasm of SLs lies in the lack of an effective incentive mechanism and strategy. Because the SLs’ initiatives participating in the DR are closely related to its structure of comfort and economic preference, we divided SLs into economical users (EUs), standard users (SUs), and comfortable users (CUs). Considering the balance of the benefits between the load aggregator (LA) and SLs and the impact of resource scarcity, we build the optimal incentive model based on the principal-agent theory under the case of symmetry and asymmetry information. Based on MATLAB simulation, we have the following suggestions for LA: 1) In terms of dispatch sequence, LA should dispatch SUs first and then EUs and CUs, 2) In the setting of retained earnings, EUs should be the most, followed by SUs, and the least is CUs, 3) In terms of incentive intensity, CUs need the most incentive, EUs need moderate, and SUs need the least, 4) LAs need to adjust the intensity of incentive contracts according to the scarcity of resources, 5) LAs should also improve their service to reduce users’ risk aversion to strengthen their effort level.
As renewable sources, including wind power (Lu et al., 2015) and solar power (Zhao et al., 2013), become gradually permeable in the grid, creating intermittent volatility in power transfer, optimal dispatch becomes increasingly tricky nowadays. To solve new energy development, we need to start from the power supply, power grid, energy storage, users, and market and take multiple and comprehensive measures to resolve the problems (Ming et al., 2013; Geng et al., 2016). Based on the conventional methods, such as vigorously developing source side pumped storage and fully tapping the energy storage side’s regulation capacity, the shiftable loads (SLs) on the load side have substantial regulating potential. It has become a vital resource that can be developed and utilized. However, it is not easy to use its regulation ability due to the scattered distribution and low scale of load side SLs. According to Germany’s practical experience (Stede et al., 2020), it has become a universal and feasible technical route of demand response (DR) to aggregate SLs by the load aggregator (LA) as an intermediary to provide regulatory resources for the power grid.
On the premise of technical feasibility, effectively mobilizing SLs to participate in DR is the key to turning the assumption into reality. Therefore, it is urgent to design a reasonable incentive contract and strategy based on the electricity preference and interest demands of SLs. This article endeavors to study LA’s incentive mechanism to integrate user resources from SL appreciation, analyze users’ participation enthusiasm, and the incentive intensity of LAs, based on the principal-agent theory, and provides theoretical support for the formulation of LA’s incentive strategies.
The remainder of this article is arranged as follows: Literature Review reviews previous studies on DR, electricity behavior, optimal dispatch, and incentive methods. Considering the power consumption preference of SLs, Methodology introduces the primary hypothesis and model establishment based on principal-agent theory. The results of solving the incentive mechanism model under information symmetry and information asymmetry are discussed in Solutions of Incentive Mechanism Model Under Information Symmetry and Information Asymmetry. Simulation Results and Incentive Strategy of Load Aggregator sets out the simulation results and the incentive strategy of LAs. Finally, Analysis of Simulation Examples concludes the results and puts forward relevant suggestions for future research.
Both the power supply side (Takahashi et al., 2017) and the energy storage side (Meng et al., 2021) can be directly connected to dispatch. Unlike the abovementioned subjects, the load side’s minimum regulation unit is the user, which the LA must integrate to provide grid regulation capacity. Various SLs can participate in DR, such as wastewater treatment plants, heating, ventilation, and air-conditioning systems. For example, Musabandesu and Loge (2021) found that wastewater treatment plants can use flow diversion to shift site-wide energy use. Both Li et al. (2017) and Chen et al. (2020) studied how to improve the power quality efficiency through aggregated heating and air-conditioning systems. The optimal smart city energy management, which considers shiftable loads and energy storage, can meet the energy balance with minimum cost (Golpîra and Bahramara, 2020). Through evidence from Germany, Stede et al. (2020) discussed the LA’s indispensable role in DR. Qi et al. (2020) estimated the potential DR ability of air-conditioning loads. To determine the impact of DR in capacity markets, Lynch et al. (2019) used equilibrium models and found DR to mitigate wind energy’s adverse effects. However, in terms of carbon emission reduction, the market-driven DR does not necessarily yield CO2 reductions (Schwabeneder et al., 2019).
Many scholars have paid attention to the power consumption characteristics of power users, and they have carried out relevant research on load forecasting and mining the value of power consumption (Fotouhi Ghazvini et al., 2019; Ableitner et al., 2020). To improve the solution accuracy of load characteristics, Wang et al. (2020a) built a multi-objective electric heating load model that considers user response behavior. Zhou et al. (2019) argued that end users’ time-of-use price with storage devices could optimize discharging behavior. According to a novel approach that simulates the impact of individual behavior on charging infrastructure, Pagani et al. (2019) verified that a business model based on parking fees is superior to power sales.
Many scholars are devoted to the research of DR optimal scheduling. For example, Lu et al. (2020) proposed a novel optimal load dispatch model for a community energy hub that took electrical and thermal DR programs into account. The integrated energy system contains considerable potential in the overall carbon emission mitigation; thus, Wang et al. (2020b) proposed a two-stage framework to conduct a low-carbon economy energy dispatch by carbon intensity control. Gu et al. (2017) set out a novel integrated DR for the residential loads from pricing strategy and optimal dispatch. They proposed an energy pricing strategy for the residential combined cooling heating and power (CCHP) system. Given the interaction between service price and elastic demand, Zhang et al. (2020) formulated the optimal dispatch as a fixed-point problem. Numerical results based on actual load and electricity price data validate the following method.
There are many research achievements in the aspect of the incentive mechanism and strategy of DR. It is found that different incentive strategies for a household in the short and long term will make DR more effective (Katz et al., 2016). Besides, short-term DR and energy efficiency will reduce gas capacity consumption by 50.0% in 2050 (Mier and Weissbart, 2020). Wen et al. (2020) proposed modified deep learning and reinforcement learning (MDLRL) for an incentive-based demand response (IDR) algorithm for an incentive-based DR program. With an MDLRL forecasting method, the algorithm effectively overcomes the environment’s uncertainty, and the peak electricity demand can be reduced by 17.0%. Zheng et al. (2021) established an integrated DR model for multiple energy carriers, which considered stochastic programming theory and dynamic parameters.
By summarizing the existing research results, we can find that an integrated research system has been formed, including the subject of DR, the necessity of LA in DR, the assessment of regulatory potential, and the effect of carbon emission reduction. There are theoretical models and a relatively complete evaluation of methods in power user electricity behavior. There also have been some mature optimization scheduling methods in DR. The dynamic pricing incentive method has proved its effectiveness. On balance, there are two kinds of DR incentive strategies, which are dominated by price and incentive. However, SL participation in DR is at the cost of comfort utility loss. Different preference structures have various utility losses. At present, the current strategies do not customize incentive strategies according to the diverse preference structure. Therefore, it is impossible to maximize the benefits between LA and all SLs. Based on preference and principal-agent theories, our motivation is to provide customized benefit distribution schemes for all different SLs considering the preference structure. On the premise of more accurately motivating SLs, this incentive strategy can maximize the interests of SLs and LAs.
By analyzing the characteristics of SLs and combining them with the current research (Curtis et al., 2020; Yilmaz et al., 2020), we can summarize SLs’ preferences into three categories: endogenous preference, power consumption preference, and willingness preference to participate in DR. Users’ actual electricity consumption preference, which changes dynamically with different scenarios and different times, cannot be fully observed in real life. From the perspective of utility brought by SLs participating in DR, the most stable, observable, and quantifiable power consumption preference is the SL comfort and economic preference. In this article, we divided the SL’s comfortable preference proportion (0.0, 0.3) into economical users (EUs), (0.3, 0.7) into standard users (SUs), and (0.7, 1.0) into comfortable users (CUs).
In the study of LAs encouraging SLs to participate in DR, because LAs cannot directly observe the complete information that affects whether SLs participate in DR, there is information asymmetry between them. Therefore, we can treat the problem as a principal-agent theory problem in the case of asymmetric information. The LA is the principal, and the SLs are the agent (Zhao et al., 2017).
The client’s benefit is the difference between the total revenue of DR and the incentive contract promised to SLs. The total revenue of DR is the output of agents participating in DR, which is affected by preference structure, effort level, and external factors, such as resource scarcity. The incentive contract of LA’s commitment is divided into two parts: the fixed income that LA promises to SLs. The other is the variable income that the LA promises to SLs according to their actual output.
The agent’s benefit is the difference between the incentive contract promised by the LA and its own cost. The cost of agents participating in DR is also affected by agents’ preference structure and effort level. Because of SL’s characteristics in DR, the agent’s fee is considered its loss utility (Gibbons, 2005; Chao et al., 2009).
We set the following hypotheses (H). According to these hypotheses, the model will conduct MATLAB simulation analysis based on the parameter assumed by actual conditions, references, and model constraints.
Hypothesis 1 (H1). In the SL’s generous authorization capacity, the proportion of the comfortable preferred total is
The use of variables in the abovementioned hypothesis to classify people’s abstract traits or abilities has long been used in previous studies (Lin and Jiu-He, 2019; Wei et al., 2019). This article divides SL electricity preference into two parts: economic and comfort preference.
Hypothesis 2 (H2). It is assumed that the participation costs of comfortable preference and economic preference are
The loss of comfort utility of SLs participating in DR is regarded as the participation cost of SLs. With the increase of called capacity, the loss of comfort validity of SLs increases, C' (s) > 0. Consumer purchase has diminishing marginal utility effect, while SLs’ comfort utility loss has an increasing marginal effect. This is also consistent with the fact that with the expanding volume of calls, the SLs’ comfort utility decreases faster and faster, with C" (s) > 0. In principal-agent theory, the assumption of participation cost is usually set in the form of quadratic (Zhao et al., 2018; Sun et al., 2019).
Hypothesis 3 (H3). The output of comfort preference and conservation preference is
When the effort level is low, the improvement in the effort level can quickly increase the output participating in the DR. In contrast, when the effort level is high, the progress in the effort level will not have a significant impact on the output participating in the DR. Therefore, the production is proportional to the logarithm of the effort level in hypothesis 3. In other studies, similar problems are also dealt with this way (Lin and Jiu-He, 2019).
Hypothesis 4 (H4). The output of SLs participating in the DR is also affected by uncontrollable random factors. Suppose θ is the random factor affecting the production (independent of agents’ effort levels), θ follows the normal distribution with the mean value of
Like other studies using principal-agent theory (Assaf et al., 2020; Wang et al., 2020c; Wang and Huang, 2020), this article also considers the influence of random factors in the model.
Hypothesis 5 (H5). Suppose that the optimal linear incentive contract designed by the principal is
The linear incentive contract between the principal and agent has been fully applied in many studies (Cachon and Lariviere, 2005; Chao et al., 2009; Zhu and You, 2011).
Hypothesis 6 (H6). LAs are risk-neutral, and SLs are risk-averse. The absolute risk aversion quantity of users is
In the abovementioned hypotheses, the preference of LAs and SLs for risk has long been mature in the principal-agent theory (Mirrlees, 1976; Tapiero, 2007). We refer to Hsu’s research for the specific value of their risk appetite (Hsu, 2006).
Based on the abovementioned six hypotheses, we construct the analysis model under the condition of information symmetry and information asymmetry.
The output of SLs participating in the DR is determined by comfortable preference capacity, economical preference capacity, and random factors. According to hypotheses 1–4, the output function of SL’s participation in DR can be obtained.
The cost of SLs participating in DR is considered as the loss of utility. According to hypothesis 2, the cost function of SLs participating in DR is as follows:
To improve the effort level of SLs to participate in DR, the LA needs to provide a linear incentive contract for SLs:
Among them,
This model assumes that LAs are risk-neutral and SLs are risk-averse. Assuming that the SL’s absolute risk aversion degree is
The expected utility of LAs is the total revenue from DR minus the incentive contracts promised to SLs. The desired utility function of LAs is as follows:
The expected utility of SLs is the incentive contract provided by the LA minus the cost of participating in DR. The fee includes two aspects: the loss of utility of SL’s participation in DR; the other is the risk cost. The expected utility function of SLs is as follows:
According to the principal-agent theory, the principal faces two constraints from the agent when motivating the agent. They are individual rationality constraint (IR) and incentive compatibility constraint (IC). Participation constraint means that after participating in the LA’s contract, SL’s benefit cannot be less than the maximum expected utility when they do not accept the agreement. Incentive compatibility constraint means SLs always choose the activity to maximize their expected utility in any incentive contract. Under the above mentioned theory, we transformed the incentive mechanism of SLs participation in DR to solve the following optimization problems.
Objective function:
Constraints:
In the case of symmetric information, the LA can directly observe the influence of SL preferences on the user’s willingness to authorize capacity, that is, the LA can directly observe all kinds of information of SLs. In this case, the incentive compatibility constraint (IC) is redundant. The problem becomes an optimization problem comprising Eqs 7, 8 in the fundamental optimization problem, and the model is as follows:
Objective function:
Constraints:
In the case of information symmetry, what the LA is willing to pay is only the maximum expected utility
Taking the first-order condition for
When the information is asymmetric, the LA cannot directly observe the influence of SL’s various preferences on the SL’s willingness to grant capacity, so it is necessary to encourage SLs to choose higher willingness authorization capacity through a reasonable incentive contract. Thus, the problem is transformed into the solution of the basic model. That is, the optimization model comprising Eqs 7–9 is solved.
By deriving Eq. 9 to
The result of bringing Eq. 8 into Eq. 7 is as follows
Find the first-order partial derivative of Eq. 21 to
In the abovementioned formula, to simplify the expression
There are six main parameters in the flow chart of the excitation model (Figure 1): quantifying utility loss, demand response, asymmetric information solution, classifying the consumers, simulate the optimal incentive contract, and determine the optimal load aggregation scheduling policy. The process of seeking mode is described as follows:
Step 1: By quantifying the utility loss of SL’s participation in DR, various basic assumptions of SLs are established.
Step 2: By mapping LA scheduling SL participation in DR to principal-agent theory in the two-level supply chain, the contract theory of supply chain is introduced into the optimal incentive contract of SL participation in DR, and the corresponding revenue model is established.
Step 3: The optimal incentive contract under the condition of asymmetric information is solved to obtain the general expression of the optimal incentive contract parameters of all types of SLs.
Step 4: Select an appropriate value range according to SL’s incentive sensitivity and classify SLs.
Step 5: Combined with SL’s classification and actual situation, the general expression of the optimal incentive contract is simulated to obtain all the solutions of the optimal incentive contract for all types of SLs.
Step 6: According to the mean value of all solutions of optimal incentive contracts for various types of SLs, the optimal scheduling strategy of LAs for SLs participating in DR is determined.
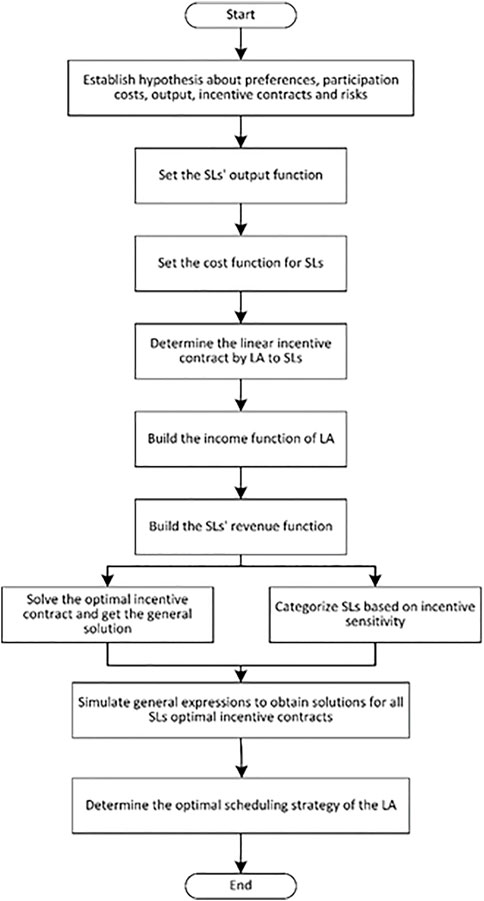
FIGURE 1. Flow chart of the LA incentive model based on SLs’ preference.
Due to the theoretical research on SLs’ preference structure, we cannot collect specific data. Therefore, the research team assumed the following parameter value according to the actual situation, model constraints, and other references.
SLs’ retention benefit assignment is a parameter related to the actual situation and can also be considered an environment variable. The value of this parameter does not affect the study of other variables and the result of this paper. Here we set
According to the problem description above, the input-output ratio of comfortable preference users is higher. Therefore, we set
According to the research (Hsu, 2006), we set
We discussed the effect of market scarcity on the optimal incentive contract in three cases. Under the equilibrium of supply and demand, we take the market shortage resources coefficient as
We suppose θ follows the normal distribution with the mean value of
Based on the abovementioned assumptions and parameter assignment, we used MATLAB to simulate the SL’s effort level and income distribution coefficient under the information symmetry and information asymmetry situation according to the incentive optimization model constructed above. We obtained the following six results.
According to Eq. 14 and 18,
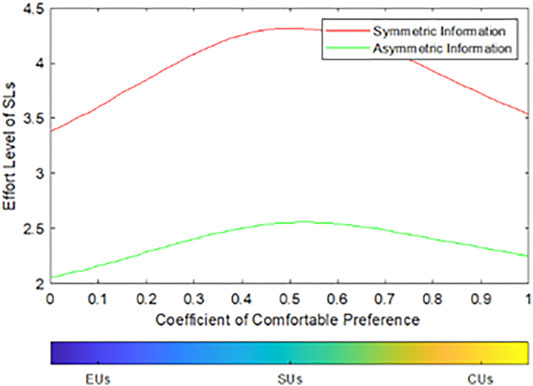
FIGURE 2. Relationship between the effort level and SLs’ type under different information conditions.
When the data are symmetrical, the LA can accurately observe and dispatch the SLs according to the genuine demand preference of the SLs. On the premise of ensuring the SL power demand, the LA can make the maximum use of the SL’s adjustment ability to participate in the DR, so the SL’s overall coordination degree is high. When the information is asymmetric, the LA cannot directly observe SL’s needs and preferences only to take incentive measures to improve the SL effort level. The simulation results also confirm this point.
Figure 3 (left) shows that EUs get the highest fixed income, CUs get the second, and SUs get the lowest under the optimal incentive contract. In reality, since EUs have a more adjustable capacity, the LA prefers to give a higher fixed income incentive to EUs. When DR resources are incredibly scarce, CUs are called with a relatively high fixed income. This means the LA can mobilize CUs to participate in DR and improve LA’s DR competitiveness compared to other LAs. Figure 3 (right) shows that 1) under the optimal incentive contract, the income distribution coefficient of SUs is the lowest, that of EUs is moderate, and that of CUs is the highest. 2) When users change from EUs to SUs, their income distribution coefficient decreases; their income distribution coefficients increase when SLs change from SUs to CUs.
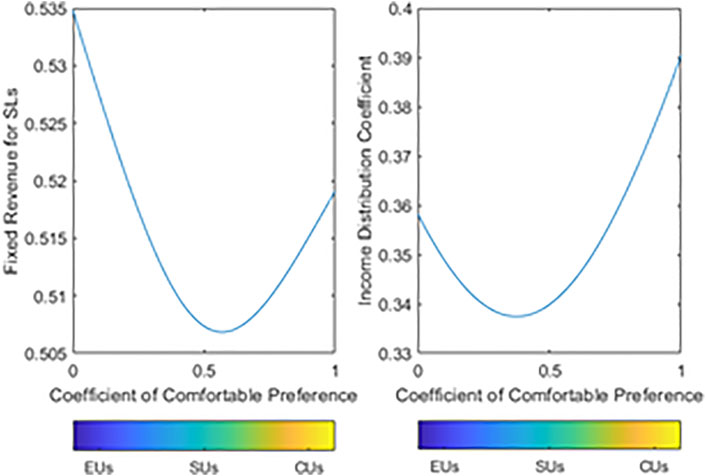
FIGURE 3. Relationship between SLs’ fixed income/income distribution coefficient and preference in the case of asymmetric information.
In reality, LAs will dispatch the SUs with the largest adjustable capacity with a relatively low-profit distribution coefficient, then the EUs with the medium income distribution coefficient, and finally deliver the CUs with the highest profit distribution coefficient when the resources are in short supply.
Figure 4 shows that 1) under the optimal incentive contract, SUs effort level is the highest, that of CUs is the second, and that of EUs is the lowest. 2) When SLs change from EUs to SUs, their effort level increases; when SLs switch from SUs to CUs, their effort level decreases.
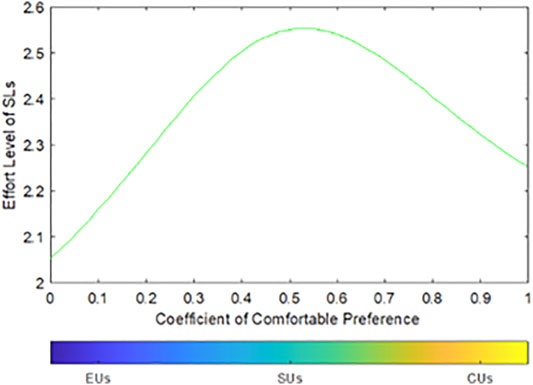
FIGURE 4. Relationship between the effort level and SLs’ preference in the case of asymmetric information.
In Figure 5, the ordinate is the SL’s incentive sensitivity, which is numerically equal to the ratio of the SL’s effort level
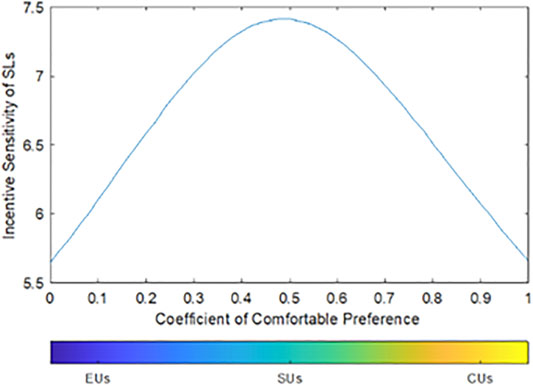
FIGURE 5. Relationship between SLs’ incentive sensitivity and their preference structures under asymmetric information.
As shown in Figure 6, the same kind of SL effort level increases with the increasing scarcity of resources. The income distribution coefficient given by the LA also increases. In reality, the higher the shortage of resources, the higher their economic value and importance to the power system. Therefore, the LA is willing to take more profits to mobilize scarce resources. The SL’s effort level will improve significantly, and the income distribution coefficient will be relatively higher.
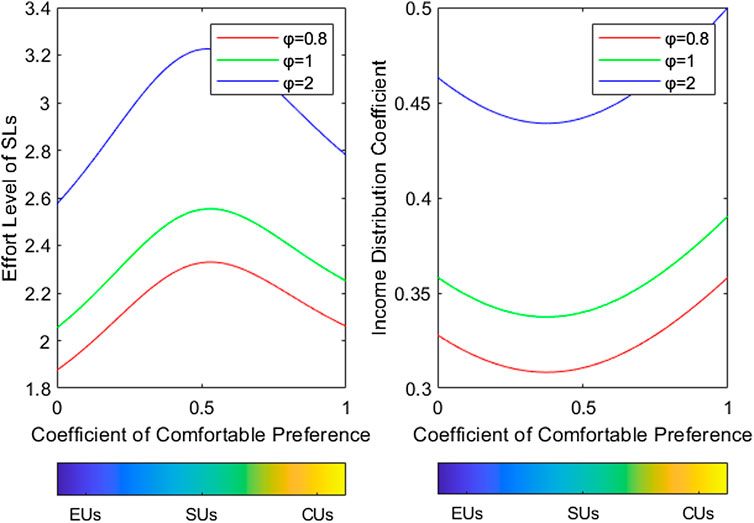
FIGURE 6. Relationship between effort level/income distribution coefficient and SLs’ preference type under different resource scarcity conditions.
Figure 7 demonstrates that, for the same kind of SLs, the higher the degree of risk aversion, the lower their effort level. Suggesting that SLs with a strong awareness of risk display a humble willingness to participate, the income distribution coefficient that the LA provides will also decrease.
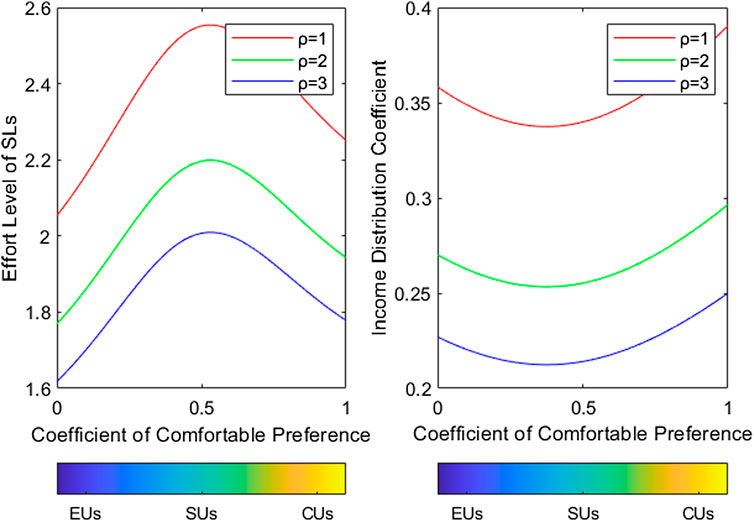
FIGURE 7. Relationship between effort level/profit distribution coefficient and SLs’ type under different risk preferences.
Combined with the abovementioned simulation results and under the optimal incentive contract, the LA could use the following incentive strategies to stimulate SLs to participate in DR.
(1) In the incentive sequence, the LA should first tap the regulating ability of SUs, then EUs, and finally CUs.
(2) In terms of incentive intensity, the profit distribution coefficient that the LA should set is in the order of CUs, EUs, and SUs.
(3) In the setting of retained revenue, the LA should place EUs first, then SUs, and then CUs.
(4) Besides, the LA should adjust the intensity of incentive contracts according to the scarcity of resources.
(5) Last but not least, the LA should strive to improve its service level and service credit to reduce the SL’s risk aversion degree to encourage SLs to strengthen their effort.
In this article, two different LA scheduling strategies are formulated, namely, considering user comfort preferences (CUCP) and regardless of user comfort preferences (RUCP) scheduling strategies. Among them, the RUCP scheduling strategy takes different comfortable temperature intervals of the three types of users as operating constraints. They are the scheduling strategy constrained by the lowest temperature of EUs, and we use RUCPE as its abbreviation; for the scheduling strategy constrained by the lowest temperature acceptable to SUs, we use RUCPS as its abbreviation; and for the lowest acceptable temperature for CUs, we use RUCPC as its abbreviation. Through the comparison of the two schemes, the analysis draws conclusions and gives suggestions.
In order to simplify the calculation, we converted the temperature ranges of the three types of SLs into their respective power operating ranges. The conversion relationship between the downregulated power that the electric heating user can provide at a certain moment and the indoor temperature is determined by Eq. 25.
where
Since SLs with different preferences have different comfortable temperature ranges, when the LA schedules SLs with different preferences, if the dispatched temperature exceeds the physical temperature adjustment range that the SLs can withstand under the preferences, the LA will be dissatisfied. This article uses the users’ lost (UL) indicator to measure, and the calculation method of UL is as shown in Eqs 26, 27:
where
Under different scheduling strategies, the main calculation steps of the adjustable power of SL electric heating are shown in Figure 8:
Step 1: Enter the current heating room temperature of all SLs, the preference of each SL, and the temperature scheduling interval corresponding to different preferences.
Step 2: Determine and calculate the temperature that the ith SL can reduce.
Step 3: Calculate the adjustable power that all SLs can provide.
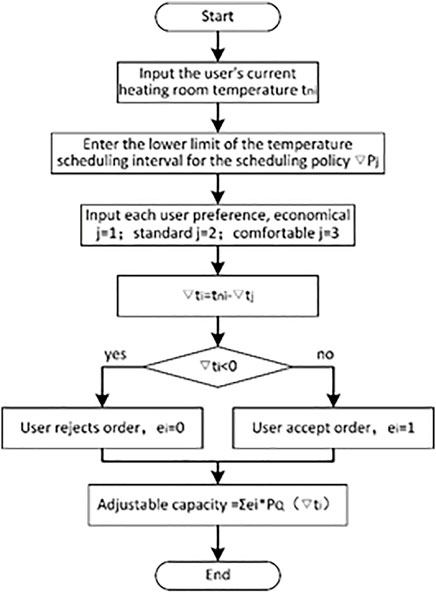
FIGURE 8. Household electricity heating adjustable power calculation flow chart.
The simulation area of this example is located in a city in the cold northern part of China (125.35°E, 43.88°N). One LA in the city manages 30,000 households of electric heating residents. Among them, there are 10,000 EUs, SUs, and CUs. With reference to the “Regulations on the Operation of the Northeast Auxiliary Service Market,” suppose that when the operating period is from 12:00 to 13:00 on a certain day, the auxiliary power service market is in a stage of severe shortage of demand response and load reduction, that is, the power market can accept the LA reducing the electric heating power at this time. The arbitrarily large downward adjustment capability is provided by the electricity market. Based on this scenario, this article simulates the downregulation ability of the SL’s electric heating at a certain moment. According to the abovementioned discussion, the power consumption preferences of the three types of SLs are different. In practice, the differences in the use of electric heating by these three types of SLs are manifested in the different operating intervals for the control of the ambient temperature. According to the public standard of China Institute of Built Environment research, it is believed that the universal comfortable temperature of the human body is 26°C. In this example, we set the temperature range of EUs at [23.5°C, 24.5°C] and the temperature range of SUs at [24.5°C, 27.5°C]. For CUs, the temperature interval is set at [25.5°C, 26.5°C].
The values in Table 1 are calculated by taking the fixed income coefficient and income distribution coefficient of typical users when
TABLE 1. Calculation parameter table.
According to the parameters in Table 1, the maximum schedulable capacity, maximum revenue, and UL of the SLs in two different situations in the simulation calculation example are calculated, as shown in Tables 2, 3:
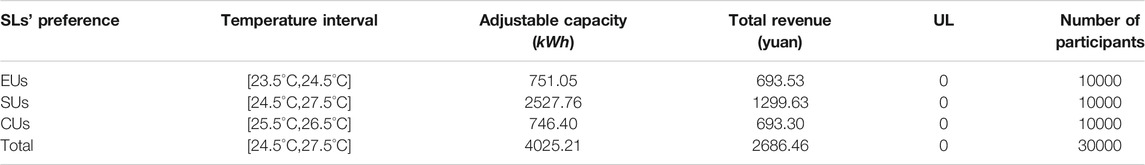
TABLE 2. One-hour schedulable capacity in consideration of SLs’ preferences.

TABLE 3. Dispatching capacity in 1 hour regardless of SLs’ preference.
The LA dispatches all SLs according to the lower limit of acceptable temperature for economical, standard, and comfortable SLs without considering SL’s preferences. The results are shown in Table 3:
The following conclusion can be drawn from the data in Figure 9 and Tables 2, 3:
(1) In consideration of SL’s preferences, when dispatching SLs with different types of preferences, the EUs, SUs, and CUs schedulable capacity are 751.05 kWh, 2527.76 kWh, and 746.40 kWh, respectively. Because of the SUs’ large temperature scheduling interval, it can provide the largest schedulable capacity.
(2) Regardless of SLs’ preferences, scheduling is performed according to the temperature range of economic, standard, and comfortable SLs. When using the temperature range of economic SLs, the maximum adjustable power can be obtained, reaching 8225.21 kWh, but its UL reaches 11.54%; when using the temperature range of comfortable SLs, the minimum adjustable power can be obtained, only 1733.13 kWh. When using the standard SLs’ temperature range, an adjustable power of 4474.16 kWh can be obtained, which is an increase of 448.95 kWh of adjustable power compared to the case of considering SLs’ preferences, but UL is 3.84%.
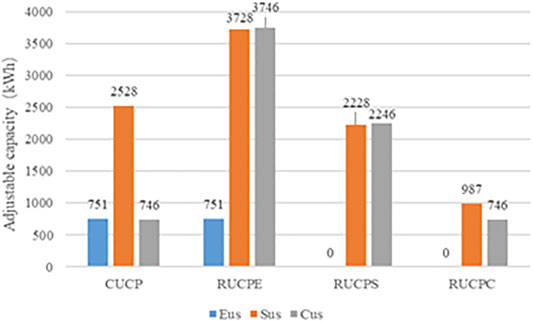
FIGURE 9. Adjustable capacity under four scheduling strategies.
By analyzing the existing literature and studying practical problems, we found that the LA’s scheduling strategy for SLs ignored the critical factor of preference structure. The relationship between LAs and SLs is consistent with that between the principal and agent in the Game Theory. Therefore, based on the principal-agent theory and considering the preference structure of SLs, this article innovatively constructed an incentive mechanism model for SLs to participate in DR.
We focused on the influence of the proportion of comfortable selection and saving preference on the coordination degree and income distribution coefficient of SLs’ participation in DR. Through MATLAB, we obtained the trend relationship between SLs’ effort, fixed income, income distribution coefficient, and SLs’ type in the case of information symmetry and information asymmetry. Moreover, we also obtained the relationship between effort level, income distribution coefficient, and SLs’ preference type under different resource scarcity conditions and risk preferences.
According to the abovementioned simulation results, we obtained six suggestions for LA in incentive sequence, incentive intensity, retained revenue setting, the impact of scarcity on incentive intensity, and service quality improvement.
In the case study, we compare CUCP strategies with RUCPE, RUCPS, and RUCPC strategies. It can be found that the CUCP strategy can fully utilize the electric heating regulation potential of all preferred SLs, which can not only minimize the UL and improve the electric heating satisfaction of SLs but also significantly improve the income of LAs.
From the perspective of practical social application, the present study plays a significant role in helping the LA provide SLs with accurate incentive contracts. The LA can use the CUCP strategy to improve SLs’ enthusiasm to participate in DR and, thus, improve the economic benefits of LAs and SLs. However, this article only considers the incentive problem between a single LA and a single type of SL. Simultaneously, we simply divided the SLs’ electricity preference into comfortable preference and economic priority. In the future, we will further subdivide consumers’ power consumption preferences and consider the incentive mechanism under the condition of game competition between multiple load aggregators and various users.
The original contributions presented in the study are included in the article/Supplementary Material; further inquiries can be directed to the corresponding author.
WL: conceptualization, supervision, and writing—reviewing and editing. RH: methodology, original draft preparation, and software. CS: investigation and validation. JZ: conceptualization and investigation. PF: conceptualization and validation.
The authors declare that the research was conducted in the absence of any commercial or financial relationships that could be construed as a potential conflict of interest.
All claims expressed in this article are solely those of the authors and do not necessarily represent those of their affiliated organizations, or those of the publisher, the editors, and the reviewers. Any product that may be evaluated in this article, or claim that may be made by its manufacturer, is not guaranteed or endorsed by the publisher.
Ableitner, L., Tiefenbeck, V., Meeuw, A., Wörner, A., Fleisch, E., and Wortmann, F. (2020). User Behavior in a Real-World Peer-To-Peer Electricity Market. Appl. Energ. 270, 115061. doi:10.1016/j.apenergy.2020.115061
Assaf, A. G., Bu, R., and Tsionas, M. G. (2020). A Bayesian Approach to Continuous Type Principal-Agent Problems. Eur. J. Oper. Res. 280 (3), 1188–1192. doi:10.1016/j.ejor.2019.07.058
Cachon, G. P., and Lariviere, M. A. (2005). Supply Chain Coordination with Revenue-Sharing Contracts: Strengths and Limitations. Manag. Sci. 51 (1), 30–44. doi:10.1287/mnsc.1040.0215
Capitanescu, F. (2021). Evaluating Reactive Power Reserves Scarcity during the Energy Transition toward 100% Renewable Supply. Electr. Pow Syst. Res. 190, 106672. doi:10.1016/j.epsr.2020.106672
Chao, G. H., Chao, S. M. R. I., Iravani, S. M. R., and Savaskan, R. C. (2009). Quality Improvement Incentives and Product Recall Cost Sharing Contracts. Manag. Sci. 55, 1122–1138. doi:10.1287/mnsc.1090.1008
Chen, X.-D., Li, L., Tseng, M.-L., Tan, K., and Ali, M. H. (2020). Improving Power Quality Efficient in Demand Response: Aggregated Heating, Ventilation and Air-Conditioning Systems. J. Clean. Prod. 267, 122178. doi:10.1016/j.jclepro.2020.122178
Curtis, J., Grilli, G., Brazil, W., and Harold, J. (2020). Why Do Preferences for Electricity Services Differ? Domestic Appliance Curtailment Contracts in Ireland. Energ. Res. Soc. Sci. 69, 101705. doi:10.1016/j.erss.2020.101705
Fotouhi Ghazvini, M. A., Ramos, S., Soares, J., Castro, R., and Vale, Z. (2019). Liberalization and Customer Behavior in the Portuguese Residential Retail Electricity Market. Utilities Policy 59, 100919. doi:10.1016/j.jup.2019.05.005
Geng, W., Ming, Z., Lilin, P., Ximei, L., Bo, L., and Jinhui, D. (2016). China׳s New Energy Development: Status, Constraints and Reforms. Renew. Sustain. Energ. Rev. 53, 885–896. doi:10.1016/j.rser.2015.09.054
Gibbons, R. (2005). Incentives between Firms (And within). Manag. Sci. 51, 2–17. doi:10.1287/mnsc.1040.0229
Golpîra, H., and Bahramara, S. (2020). Internet-of-things-based Optimal Smart City Energy Management Considering Shiftable Loads and Energy Storage. J. Clean. Prod. 264, 121620. doi:10.1016/j.jclepro.2020.121620
Gu, W., Lu, S., Wu, Z., Zhang, X., Zhou, J., Zhao, B., et al. (2017). Residential CCHP Microgrid with Load Aggregator: Operation Mode, Pricing Strategy, and Optimal Dispatch. Appl. Energ. 205, 173–186. doi:10.1016/j.apenergy.2017.07.045
Hsu, I.-C. (2006). Enhancing Employee Tendencies to Share Knowledge-Case Studies of Nine Companies in Taiwan. Int. J. Inf. Manag. 26 (4), 326–338. doi:10.1016/j.ijinfomgt.2006.03.001
Katz, J., Andersen, F. M., and Morthorst, P. E. (2016). Load-shift Incentives for Household Demand Response: Evaluation of Hourly Dynamic Pricing and Rebate Schemes in a Wind-Based Electricity System. Energy 115, 1602–1616. doi:10.1016/j.energy.2016.07.084
Li, L., Chen, X.-D., Tseng, M.-L., Wang, C.-H., Wu, K.-J., and Lim, M. K. (2017). Effective Power Management Modeling of Aggregated Heating, Ventilation, and Air Conditioning Loads with Lazy State Switching. J. Clean. Prod. 166, 844–850. doi:10.1016/j.jclepro.2017.08.112
Lin, L., and Jiu-He, W. (2019). Research on Incentive Mechanism of Customer Knowledge Sharing Based on the Structure of Knowledge. Chin. J. Manag. Sci., 1–12. doi:10.16381/j.cnki.issn1003-207x.2018.1618
Liu, J., Wei, W.-J., Shi, B., Guan, X., Ma, J.-Y., and Wang, Y.-C. (2019). Mapping Theme Trends and Knowledge Structures for Human Neural Stem Cells: a Quantitative and Co-word Biclustering Analysis for the 2013-2018 Period. Neural Regen. Res. 14 (10), 1823–1832. doi:10.4103/1673-5374.257535
Lu, X., Liu, Z., Ma, L., Wang, L., Zhou, K., and Feng, N. (2020). A Robust Optimization Approach for Optimal Load Dispatch of Community Energy Hub. Appl. Energ. 259, 114195. doi:10.1016/j.apenergy.2019.114195
Lu, Z.-Y., Li, W.-H., Xie, B.-C., and Shang, L.-F. (2015). Study on China’s Wind Power Development Path-Based on the Target for 2030. Renew. Sustain. Energ. Rev. 51, 197–208. doi:10.1016/j.rser.2015.06.024
Lynch, M. Á., Nolan, S., Devine, M. T., and O’Malley, M. (2019). The Impacts of Demand Response Participation in Capacity Markets. Appl. Energ. 250, 444–451. doi:10.1016/j.apenergy.2019.05.063
Meng, Q., Li, Y., Ren, X., Xiong, C., Wang, W., and You, J. (2021). A Demand-Response Method to Balance Electric Power-Grids via HVAC Systems Using Active Energy-Storage: Simulation and On-Site experiment. Energ. Rep. 7, 762–777. doi:10.1016/j.egyr.2021.01.083
Mier, M., and Weissbart, C. (2020). Power Markets in Transition: Decarbonization, Energy Efficiency, and Short-Term Demand Response. Energ. Econ. 86, 104644. doi:10.1016/j.eneco.2019.104644
Ming, Z., Song, X., Mingjuan, M., and Xiaoli, Z. (2013). New Energy Bases and Sustainable Development in China: A Review. Renew. Sustain. Energ. Rev. 20, 169–185. doi:10.1016/j.rser.2012.11.067
Mirrlees, J. A. (1976). The Optimal Structure of Incentives and Authority within an Organization. Bell J. Econ. 7, 105–131. doi:10.2307/3003192
Musabandesu, E., and Loge, F. (2021). Load Shifting at Wastewater Treatment Plants: A Case Study for Participating as an Energy Demand Resource. J. Clean. Prod. 282, 124454. doi:10.1016/j.jclepro.2020.124454
Pagani, M., Korosec, W., Chokani, N., and Abhari, R. S. (2019). User Behaviour and Electric Vehicle Charging Infrastructure: An Agent-Based Model Assessment. Appl. Energ. 254, 113680. doi:10.1016/j.apenergy.2019.113680
Qi, N., Cheng, L., Xu, H., Wang, Z., and Zhou, X. (2020). Practical Demand Response Potential Evaluation of Air-Conditioning Loads for Aggregated Customers. Energ. Rep. 6, 71–81. doi:10.1016/j.egyr.2020.12.019
Schwabeneder, D., Fleischhacker, A., Lettner, G., and Auer, H. (2019). Assessing the Impact of Load-Shifting Restrictions on Profitability of Load Flexibilities. Appl. Energ. 255, 113860. doi:10.1016/j.apenergy.2019.113860
Stede, J., Arnold, K., Dufter, C., Holtz, G., von Roon, S., and Richstein, J. C. (2020). The Role of Aggregators in Facilitating Industrial Demand Response: Evidence from Germany. Energy Policy 147, 111893. doi:10.1016/j.enpol.2020.111893
Sun, D.-q., Ma, X.-y., Wang, D.-j., and Li, J.-j. (2019). Principal-agent Problem for Returns Handling in a Reverse Supply Chain with One Manufacturer and Two Competing Dealers. Appl. Math. Model. 66, 118–140. doi:10.1016/j.apm.2018.09.012
Takahashi, S., Koibuchi, H., and Adachi, S. (2017). Water Supply Operation and Scheduling System with Electric Power Demand Response Function. Proced. Eng. 186, 327–332. doi:10.1016/j.proeng.2017.03.257
Tapiero, C. S. (2007). Consumers Risk and Quality Control in a Collaborative Supply Chain. Eur. J. Oper. Res. 182 (2), 683–694. doi:10.1016/j.ejor.2006.07.039
Wang, H., and Huang, W. (2020). On the Study of a Single-Period Principal-Agent Model with Taxation. Math. Probl. Eng. 2020, 1–12. doi:10.1155/2020/5401591
Wang, Y., Huang, W., Liu, B., and Zhang, X. (2020a). Optimal Effort in the Principal-Agent Problem with Time-Inconsistent Preferences. North Am. J. Econ. Finance 52, 100909. doi:10.1016/j.najef.2019.01.006
Wang, Y., Qiu, J., Tao, Y., Zhang, X., and Wang, G. (2020b). Low-carbon Oriented Optimal Energy Dispatch in Coupled Natural Gas and Electricity Systems. Appl. Energ. 280, 115948. doi:10.1016/j.apenergy.2020.115948
Wang, Z., Wang, H., Lin, Z., Liu, W., Mao, Y., Wang, X., et al. (2020c). Modeling of Regional Electrical Heating Load Characteristics Considering User Response Behavior Difference. Int. J. Electr. Power Energ. Syst. 123, 106297. doi:10.1016/j.ijepes.2020.106297
Wen, L., Zhou, K., Li, J., and Wang, S. (2020). Modified Deep Learning and Reinforcement Learning for an Incentive-Based Demand Response Model. Energy 205, 118019. doi:10.1016/j.energy.2020.118019
Yilmaz, S., Xu, X., Cabrera, D., Chanez, C., Cuony, P., and Patel, M. K. (2020). Analysis of Demand-Side Response Preferences Regarding Electricity Tariffs and Direct Load Control: Key Findings from a Swiss Survey. Energy 212, 118712. doi:10.1016/j.energy.2020.118712
Zhang, W., Wei, W., Chen, L., Zheng, B., and Mei, S. (2020). Service Pricing and Load Dispatch of Residential Shared Energy Storage Unit. Energy 202, 117543. doi:10.1016/j.energy.2020.117543
Zhao, N., Fan, M., Tian, C., and Fan, P. (2017). Contract-Based Incentive Mechanism for Mobile Crowdsourcing Networks. Algorithms 10 (3), 104. doi:10.3390/a10030104
Zhao, N., Tian, C., Fan, M., Wu, M., He, X., and Fan, P. (2018). Deep Reinforcement Learning for Mobile Video Offloading in Heterogeneous Cellular Networks. Int. J. Mobile Comput. Multimedia Commun. 9 (4), 34–57. doi:10.4018/IJMCMC.2018100103
Zhao, Z.-y., Zhang, S.-Y., Hubbard, B., and Yao, X. (2013). The Emergence of the Solar Photovoltaic Power Industry in China. Renew. Sustain. Energ. Rev. 21, 229–236. doi:10.1016/j.rser.2012.12.066
Zheng, S., Sun, Y., Li, B., Qi, B., Zhang, X., and Li, F. (2021). Incentive-based Integrated Demand Response for Multiple Energy Carriers under Complex Uncertainties and Double Coupling Effects. Appl. Energ. 283, 116254. doi:10.1016/j.apenergy.2020.116254
Zhou, K., Wei, S., and Yang, S. (2019). Time-of-use Pricing Model Based on Power Supply Chain for User-Side Microgrid. Appl. Energ. 248, 35–43. doi:10.1016/j.apenergy.2019.04.076
Zhu, L., and You, J. (2011). Moral hazard Strategy and Quality Contract Design in a Two-Echelon Supply Chain. J. Syst. Sci. Syst. Eng. 20 (1), 70–86. doi:10.1007/s11518-011-5153-2
SLs shiftable loads
DR demand response
EUs economical users
SUs standard users
CUs comfortable users
CUCP consider user comfort preference
RUCP regardless of user comfort preference
RUCPE scheduling strategy constrained by the lowest temperature of EUs
RUCPS scheduling strategy constrained by the lowest temperature of SUs
RUCPC scheduling strategy constrained by the lowest temperature of CUs
UL users’ lost
k1 proportion of the comfortable preferred
k2 balance of saving preferred
c1 participation cost coefficients of comfortable preference
c2 participation cost coefficients of economic preference
s SLs’ effort level
θ SLs’ scarcity random factor affecting the production
a1 comfortable preference-oriented output coefficients
a2 economic preference-oriented output coefficients
θ SLs’ scarcity random factor affecting the production
ω total income obtained by the agent
α fixed income provided by the principal for the agent
β incentive income distribution coefficient obtained by the agent
π output of the SLs participating in the DR
ρ absolute risk aversion quantity of users
qv volume heat index of user building heating
wm building perimeter volume
tn current heating room temperature
tw calculate the temperature outside the heating room
pQ building heat load
αE the fixed income coefficient of typical EUs when k1 = 0.3 is adopted in the calculation example
αs the fixed income coefficient of typical SUs when k1 = 0.5 is adopted in the calculation example
αC the fixed income coefficient of typical CUs when k1 = 0.7 is adopted in the calculation example
βE the income distribution coefficient of typical EUs when k1 = 0.3 is adopted in the calculation example
βs the income distribution coefficient of typical SUs when k1 = 0.5 is adopted in the calculation example
βc the income distribution coefficient of typical CUs when k1 = 0.7 is adopted in the calculation example
Keywords: principal-agent theory, optimal dispatch, load aggregator, incentive strategy, electricity preference, shiftable load
Citation: Li W, Han R, Zhang J, Sun C and Fu P (2022) An Incentive Strategy of Shiftable Load Participation in Demand Response Based on User Electricity Preference. Front. Energy Res. 9:678828. doi: 10.3389/fenrg.2021.678828
Received: 10 March 2021; Accepted: 21 December 2021;
Published: 01 February 2022.
Edited by:
César Álvarez Alonso, IE University, SpainReviewed by:
Godwin Norense Osarumwense Asemota, University of Rwanda, RwandaCopyright © 2022 Li, Han, Zhang, Sun and Fu. This is an open-access article distributed under the terms of the Creative Commons Attribution License (CC BY). The use, distribution or reproduction in other forums is permitted, provided the original author(s) and the copyright owner(s) are credited and that the original publication in this journal is cited, in accordance with accepted academic practice. No use, distribution or reproduction is permitted which does not comply with these terms.
*Correspondence: Ruidi Han, NzA5NzY3Njg5QHFxLmNvbQ==
Disclaimer: All claims expressed in this article are solely those of the authors and do not necessarily represent those of their affiliated organizations, or those of the publisher, the editors and the reviewers. Any product that may be evaluated in this article or claim that may be made by its manufacturer is not guaranteed or endorsed by the publisher.
Research integrity at Frontiers
Learn more about the work of our research integrity team to safeguard the quality of each article we publish.