 Xinwu Li
 Chan Wang2
 Lianggui Liao
 Hongxin Wen
- 1School of Finance, Guangdong University of Finance and Economics, Guangzhou, China
- 2Guangdong Institute of Economic and Social Development, Guangdong University of Finance and Economics, Guangzhou, China
- 3National Economic Research Center, Guangdong University of Finance and Economics, Guangzhou, China
Carbon emissions trading scheme (ETS) is becoming a crucial policy in mitigating global climate change. This paper purposes to evaluate the spillover effect of Chinese ETS policy with the data of 30 provinces’ carbon emissions in China by China-MRIO model and input-output analysis. The MRIO model provides the change in production value in each region in the intermediate demand and final demand. 2012 and 2015 were selected as case study years to highlight the spillover effects of ETS policy. The results show that some pilot regions such as Beijing, Tianjin, Shanghai and Chongqing reduced their directed CO2 emissions while Guangdong and Hubei increased their directed CO2 compared to 2012. However, there were places like Hebei, Shanxi, Inner Mongolia, Ningxia, and Xinjiang that undertook a mass of embodied CO2 emissions which were majorly caused by providing intermediate products. Similarly, the pilot regions transferred out CO2 emissions by using a good deal of intermediate products. Thus, it is argued that carbon transfer evaluation can provide scientific support for carbon allowance formulating and it is important for policymakers to consider embodied carbon emissions in intermediate product trading when allocating carbon allowance under the market strength of ETS.
Introduction
China has concerned about further climate change impacts caused by greenhouse gas, and it is undergoing the process of carbon dioxide (CO2) emission reduction. Since 2006, China has been the first rank of CO2 emission in the world and added 0.32 billion tones of CO2 to the atmosphere in 2019. Overall, China emitted 9.83 billion tons of CO2 emissions, 28.8% of the world’s total share in 2019 (BP, 2020). The Paris Agreement was officially in force in 2016. Since then, China was becoming one of the most concerned countries in mitigating climate change. China formally approved Beijing, Shanghai, Tianjin, Chongqing, Hubei, Guangdong, and Shenzhen to practice the “cap and trade” carbon emissions trading scheme (ETS) in 2011. And Shenzhen presented the first practice of ETS in China in 2013. Consequently, environmental and economic impacts of ETS have been a major issue of research over the last decade. The focus of these studies includes carbon price and renewable policies (Koch et al., 2014), firms’ inventory management (Hua et al., 2011), carbon allowance allocation (Daskalakis et al., 2009; Zhang et al., 2018) and financial analysis such as carbon trading and tax (Otaki, 2013; Barragán-Beaud et al., 2018). Regression analyses were used to study economics and environmental impacts of the adoption of ETS pilots in China. For example, the authors demonstrated that the trading carbon volume at Shanghai market would be 6.2 million ton in 2030 (Wu et al., 2016). In other studies, carbon leakage was concerned because products’ consuming places were ignored (Peters and Hertwich, 2008a). To overcome this neglect, consumption-based accounting of CO2 emissions was employed to calculate the exact CO2 emission (Peters and Hertwich, 2008b; Davis and Caldeira, 2010).
Leontief proposed an IO method to capture the relations between sectors and industries in the 1930s (Leontief, 1970). Further, the single region national input-output (SRIO) model was employed to assess the net transfer of CO2 between countries which reveals unfair responsibility on emission and negative impacts on developing countries due to providing the majority of industrial products of the world (Su and Ang, 2013; Kulionis and Wood, 2020). However, studies that focus on policy effect or employ the SRIO model cannot evaluate the spatial distribution of impacts. One limitation of the studies based on SRIO and regression is that they treat the entire state economy as one and incapable of calculating region-wise impacts. On the other hand, the MRIO model can identify trading flows between regions, sectors, and final demand. Therefore, the MRIO model can effectively distinguish the pollutant emissions in other regions caused by the consumption of a given region (Wiedmann et al., 2011).
Implementing carbon ETS pilots could result in regional spillover of environmental and economic impacts due to the interconnected nature of the regional production structure. Hence, it is crucial to quantify the distribution of these impacts to avoid any unplanned consequence of ETS pilots’ expansion. To our best knowledge, few studies quantified the regional spillover effects for ETS pilots implementation in China, which can provide important multi-regional insights for policy management departments to allocate carbon allowance between provinces reasonably. Thus, the multi-regional input-output (MRIO) model is employed in this paper to address the gap of multi-regional impacts of carbon transfer during the ETS pilots period.
The MRIO model enables us to compute the spillover effects of ETS pilots among the six pilot provinces and all the other interconnected regions. These spillover effects can be in the form of change in energy consumption and production volume of different commodities in regions that are not included in ETS pilots. This advantage of MRIO methodology to provide a comprehensive insight into spillover effects across different areas because of planned changes in the economic sectors of a region makes MRIO a robust tool to be used for assessing the impact of planned development. Thanks to the fast evolution of technology, MRIO data panels are available for assessment of the impact of these emerging pilot policies before wide-scale adoption (Liang et al., 2007; Mi et al., 2018). Nowadays, there are several studies that work out net transferred CO2 based on China’s MRIO data table (Meng et al., 2013; Mi et al., 2017). Nevertheless, the multi-regional CO2 flow behind the ETS pilots is not fully understood.
In this paper, we perform calculation analysis and attempt to answer the following two questions: (1) How much would the carbon emissions change pre- and post-the ETS pilots’ intervention? (2) What can we know about the spillover effects that an MRIO can provide for the case of implementing ETS pilots in China? To address these issues, we first compute every province’s CO2 emission considering both the production side and consumption side by using China’s MRIO model and then indicate the direction of CO2 transfer among provinces. The China-MRIO table can capture regional contribution and distribution of CO2 emission.
In sum, this study considers the potential changes of carbon emissions transfer to help understand the effect of ETS policy implementation within China. By breaking up the CO2 emissions into the intermediate trade and final consumption, we can figure out the adjustment of CO2 transfer of the pilot regions and the transfer directions of CO2 emissions. The results of this study could facilitate the optimization of China’s ETS pilots policy and minimize the adverse side effects of the policy implementation on the economy and environment.
The Rest of this paper is organized as follows: we first provide the details about calculating regional level direct and indirect CO2 emission with MRIO analytical framework and the China-MRIO data table. This is followed by details on data sources used for studying energy consumption and carbon footprint between pilots and non-pilots areas of China. In the “Results and Discussions” section, we report our major findings for decomposition of regional level CO2 emissions, embodied CO2 emissions for regional sector using MRIO model and CO2 transfer impact of executing ETS pilots followed by conclusion from the work.
Methodology and Data Sources
Calculation of Carbon Emission and Carbon Intensity
In this study, the equation that we use to estimate carbon emissions is defined below (Liu et al., 2016) :
Where CE is CO2 emissions from different sectors of regions, D is the combusted fossil fuels measuring in monetary; and e is the CO2 emission of different types of energy per monetary unit.
By summarizing the emissions from different fossil fuels together, we calculate the emission intensity for a region in the following equation:
where CIr is the CO2 emission intensity for a region, and GDPr is the gross domestic product of that region.
MRIO Model
This paper employs the MRIO model to estimate the spillover effect of carbon transfer under the ETS policy in China. The MRIO model internalizes the stream of commodities and services among areas using inter-regional trading data which present as an MRIO table. The methodology starts with an existing m region MRIO table (Aichele and Felbermayr, 2015). The “Intermediate product” provides the input-output data from a region’s department itself and other regions’ departments; the “Final Product” provides the final consumption data of a region from every region’s departments.
Since the MRIO matrix has been established, area r’s input-output identical equation can be defined as follows:
Where Q is the total output of the system; A is the direct consume coefficient matrix whose elements indicate the number of intermediate products from sector i in region r that produces a unit output for sector j in region s; X is a vector representing the intermediate demand; and Y is a vector representing the final demand, including household consumption, government consumption, fixed asset formation and inventory; EX is a vector indicating the net export.
To calculate the spatial CO2 footprint of economic activities across China, we first construct a carbon intensity matrix which is symbolized by CIr to indicate the CO2 emissions per unit output of region r. If the X, Y, and EX in Eq. 3 are known, then the carbon emissions of departments of region r can be calculated as follows:
Where CIr is a vector whose elements are identified as the amount of direct CO2 emissions per unit GDP; (I - A)–1 is the Leontief inverse matrix.
The net CO2 emission transfer can be calculated as follows:
Where netETr is the net CO2 transfer from region r to other regions. If the netETr > 0, region r is the embodied CO2 importer; respectively, if the netETr < 0, region r is the embodied CO2 exporter.
By breaking it down into different demands, the net CO2 emission transfer of the intermediate demand can be calculated as follows:
Where is the net CO2 transfer resulted from the consume and produce of intermediate products; Xpro is the vector indicates the intermediate products produced in region r and consumed in other regions; and Xcon is the vector indicates the intermediate products produced in other regions and consumed in region r.
The net CO2 emission transfer of the final demand can be calculated as follows:
Where is the net CO2 transfer resulted from the consume and produce of final products; Ypro is the vector indicates the final products produced in region r and consumed in other regions; and Ycon is the vector indicates the final products produced in other regions and consumed in region r.
The domestic net CO2 emission transfer can be calculated as follows:
Where is the net CO2 transfer between region r and other regions in China. If the , region r imports the embodied CO2 from other regions in China; respectively, if the , region r exports the embodied CO2 to other regions in China.
Since this study focus on the spillover effect of ETS policy implementation within China, we need to pay attention to the results of Eqs 6–8.
Data Sources
Two types of data are needed in this research, including China’s national MRIO table and annual emission inventories of 30 provinces in China. This research is conducted to analyze the spillover effect of ETS pilots implementation which was carried out in 2013 and 2014. By the way, the shift of labor-intensive and resource-intensive industries in eastern China to the central and western regions is accelerating in 2010, thus selecting 2012 and 2015 as the case study years is helpful to detect the ETS policy’s effects and defects. The data of 2012 MRIO table and 2015 MRIO table are the most recent data that are available from the China Emission Accounting and Datasets (CEADs) (CEADs, 2012, 2015; Liu et al., 2016). The datasets published by CEADs are the results of current research projects funded by the National Natural Science Foundation of China, Ministry of Science and Technology of China, Chinese Academy of Sciences, Science and Technology Research Council UK, Newton Fund, which ensure the accuracy of economic and trade data in the MRIO table. The industries in the 2015 MRIO table were merged into 30 industries to reconcile 2012 and 2015’s different classification criteria. The MRIO table consists of 30 provinces and 30 industrial departments, and the missing data of Tibet, Hongkong, Macao, and Taiwan are unavailable so that this research does not include these regions. Data of energy activities for calculating CO2 emissions was capturing via the National energy balance sheet in China Energy Statistical Yearbook 2013 And China Energy Statistical Yearbook 2016 which recorded previous year data. Besides, carbon emission factors that we use are recommended in the IPCC 2006 guidelines (IPCC, 2014). Due to the China-MRIO table contains four energy industries which are Coal mining, Petroleum and gas, Petroleum refining and coking and Gas and water production and supply, we categorize energy materials that every province consumes into these four energy genres (Wang et al., 2017). Besides, the part of energy materials to convert has to be distinguished which will result in overrating emissions of intermediate consumption and underrating emissions of final consumption (Liu Y. et al., 2015).
Results
Provincial Level Direct CO2 Emission and Emission Intensity
Direct CO2 Emission
Based on the methodology and relevant data files above, China emitted 8,623 million tons (million tons) CO2 in 2012 and 9,231 million tons CO2 in 2015, which are basically matching with the results of existing researches (Liu Z. et al., 2015; Shan et al., 2018). Figure 1 provides an overview of variations of CO2 emissions of 2012 and 2015. In 2012, top five emitting provinces were Shandong, Hebei, Jiangsu, Hebei, Henan, and Guangdong and they shared 41.48% of total emissions. The biggest emitter was Shandong which produced 1,002.54 million tons CO2. In 2015, Jiangsu, Guangdong, Shandong, Hebei, and Zhejiang became the top five spots direct CO2 emissions and they shared 42.27% of total emissions. And then the biggest emitter was Jiangsu which emitted 1,049.12 million tons CO2.
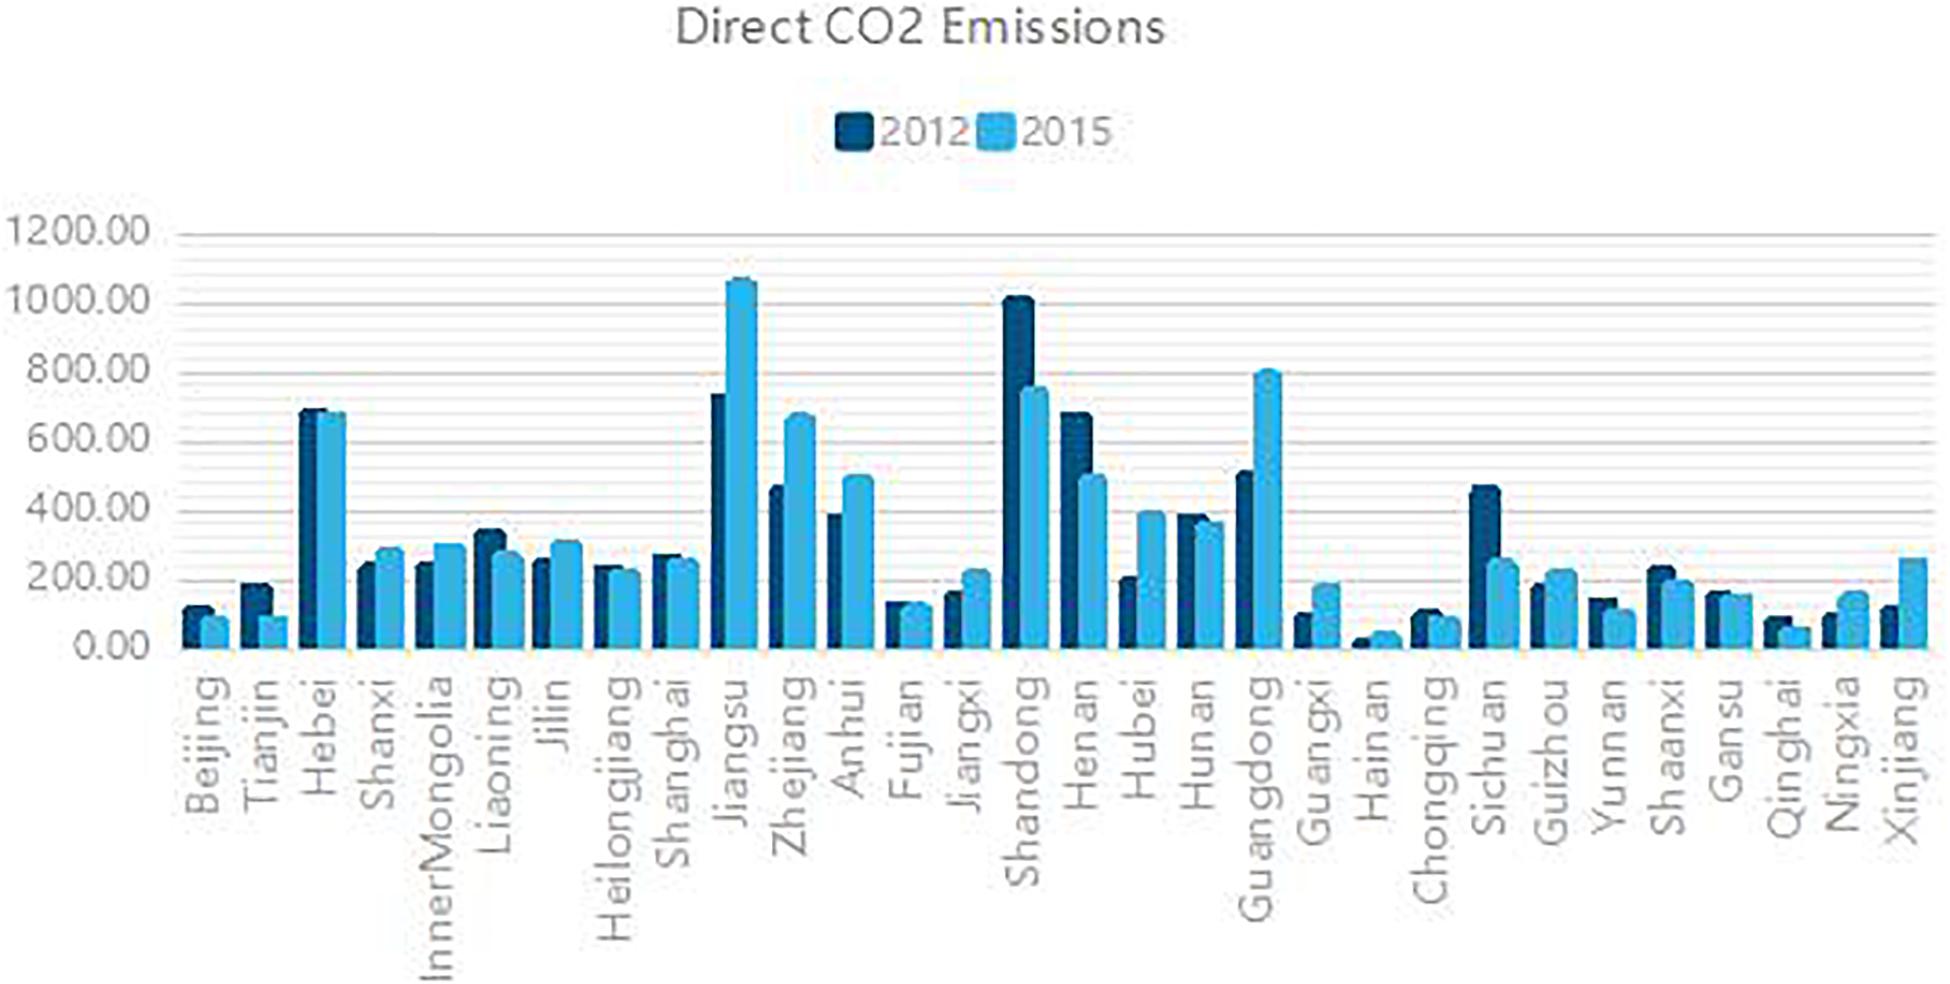
Figure 1. Direct CO2 emissions in 2012 and 2015.
The CO2 emitted by six pilot provinces increased from 1,322.47 million tons in 2012 to 1,638.43 million tons in 2015, the differential of which was generated by Guangdong and Hubei. During this period, Beijing, Tianjin, Shanghai and Chongqing decreased their share of direct CO2 emissions while Guangdong raised its share of direct CO2 emissions from 5.80 to 8.52% and Hubei’s share rised from 2.22 to 4.10%.
CO2 Emission Intensity
According to Figure 2, the carbon emission intensity top five were Qinghai, Ningxia, Gansu, Hebei, and Guizhou in 2012, while in 2015 were Ningxia, Xinjiang, Guizhou, Anhui, and Gansu. And the quantity of emission intensity of these regions were in a strong uptrend. It is shown that the emission intensities of the six pilot places remained low. Besides, Beijing, Tianjin, Shanghai, and Chongqing had slightly declined. Correspondingly, Guangdong increased its emission intensity from 0.87 tons per 10 k RMB in 2012 to 1.38 tons per 10 k RMB in 2015 and Hubei’s emission intensity increased from 0.86 tons per 10 k RMB in 2012 to 1.70 tons per 10 k RMB in 2015.
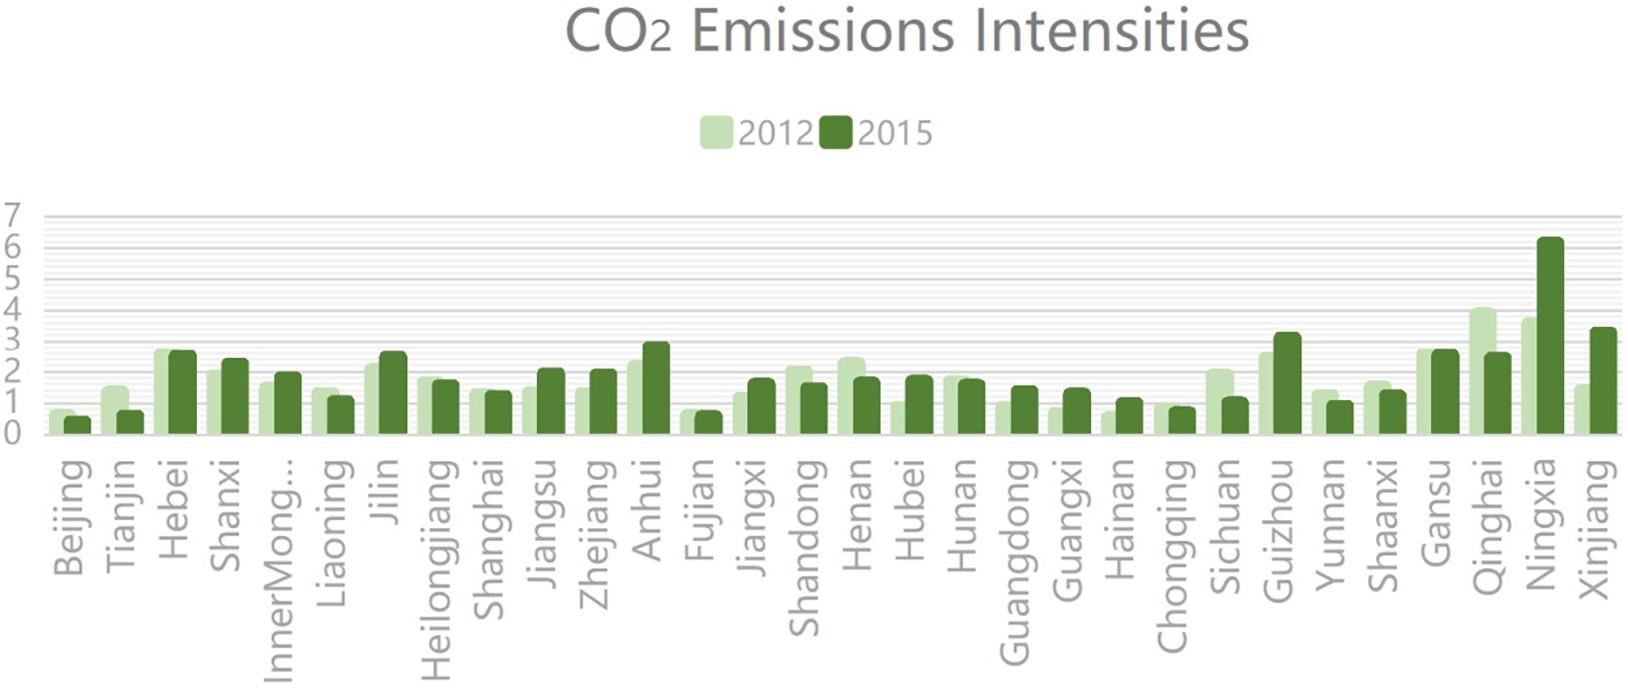
Figure 2. Carbon intensities in 2012 and 2015.
Carbon Footprint
Implementing ETS pilots induces new regional throughput for the whole of China. Using Eqs 8, 9, we calculate 30 provinces’ carbon footprint of production and carbon footprint of consumption in 2 years, respectively, and the results are presented in Table 1.
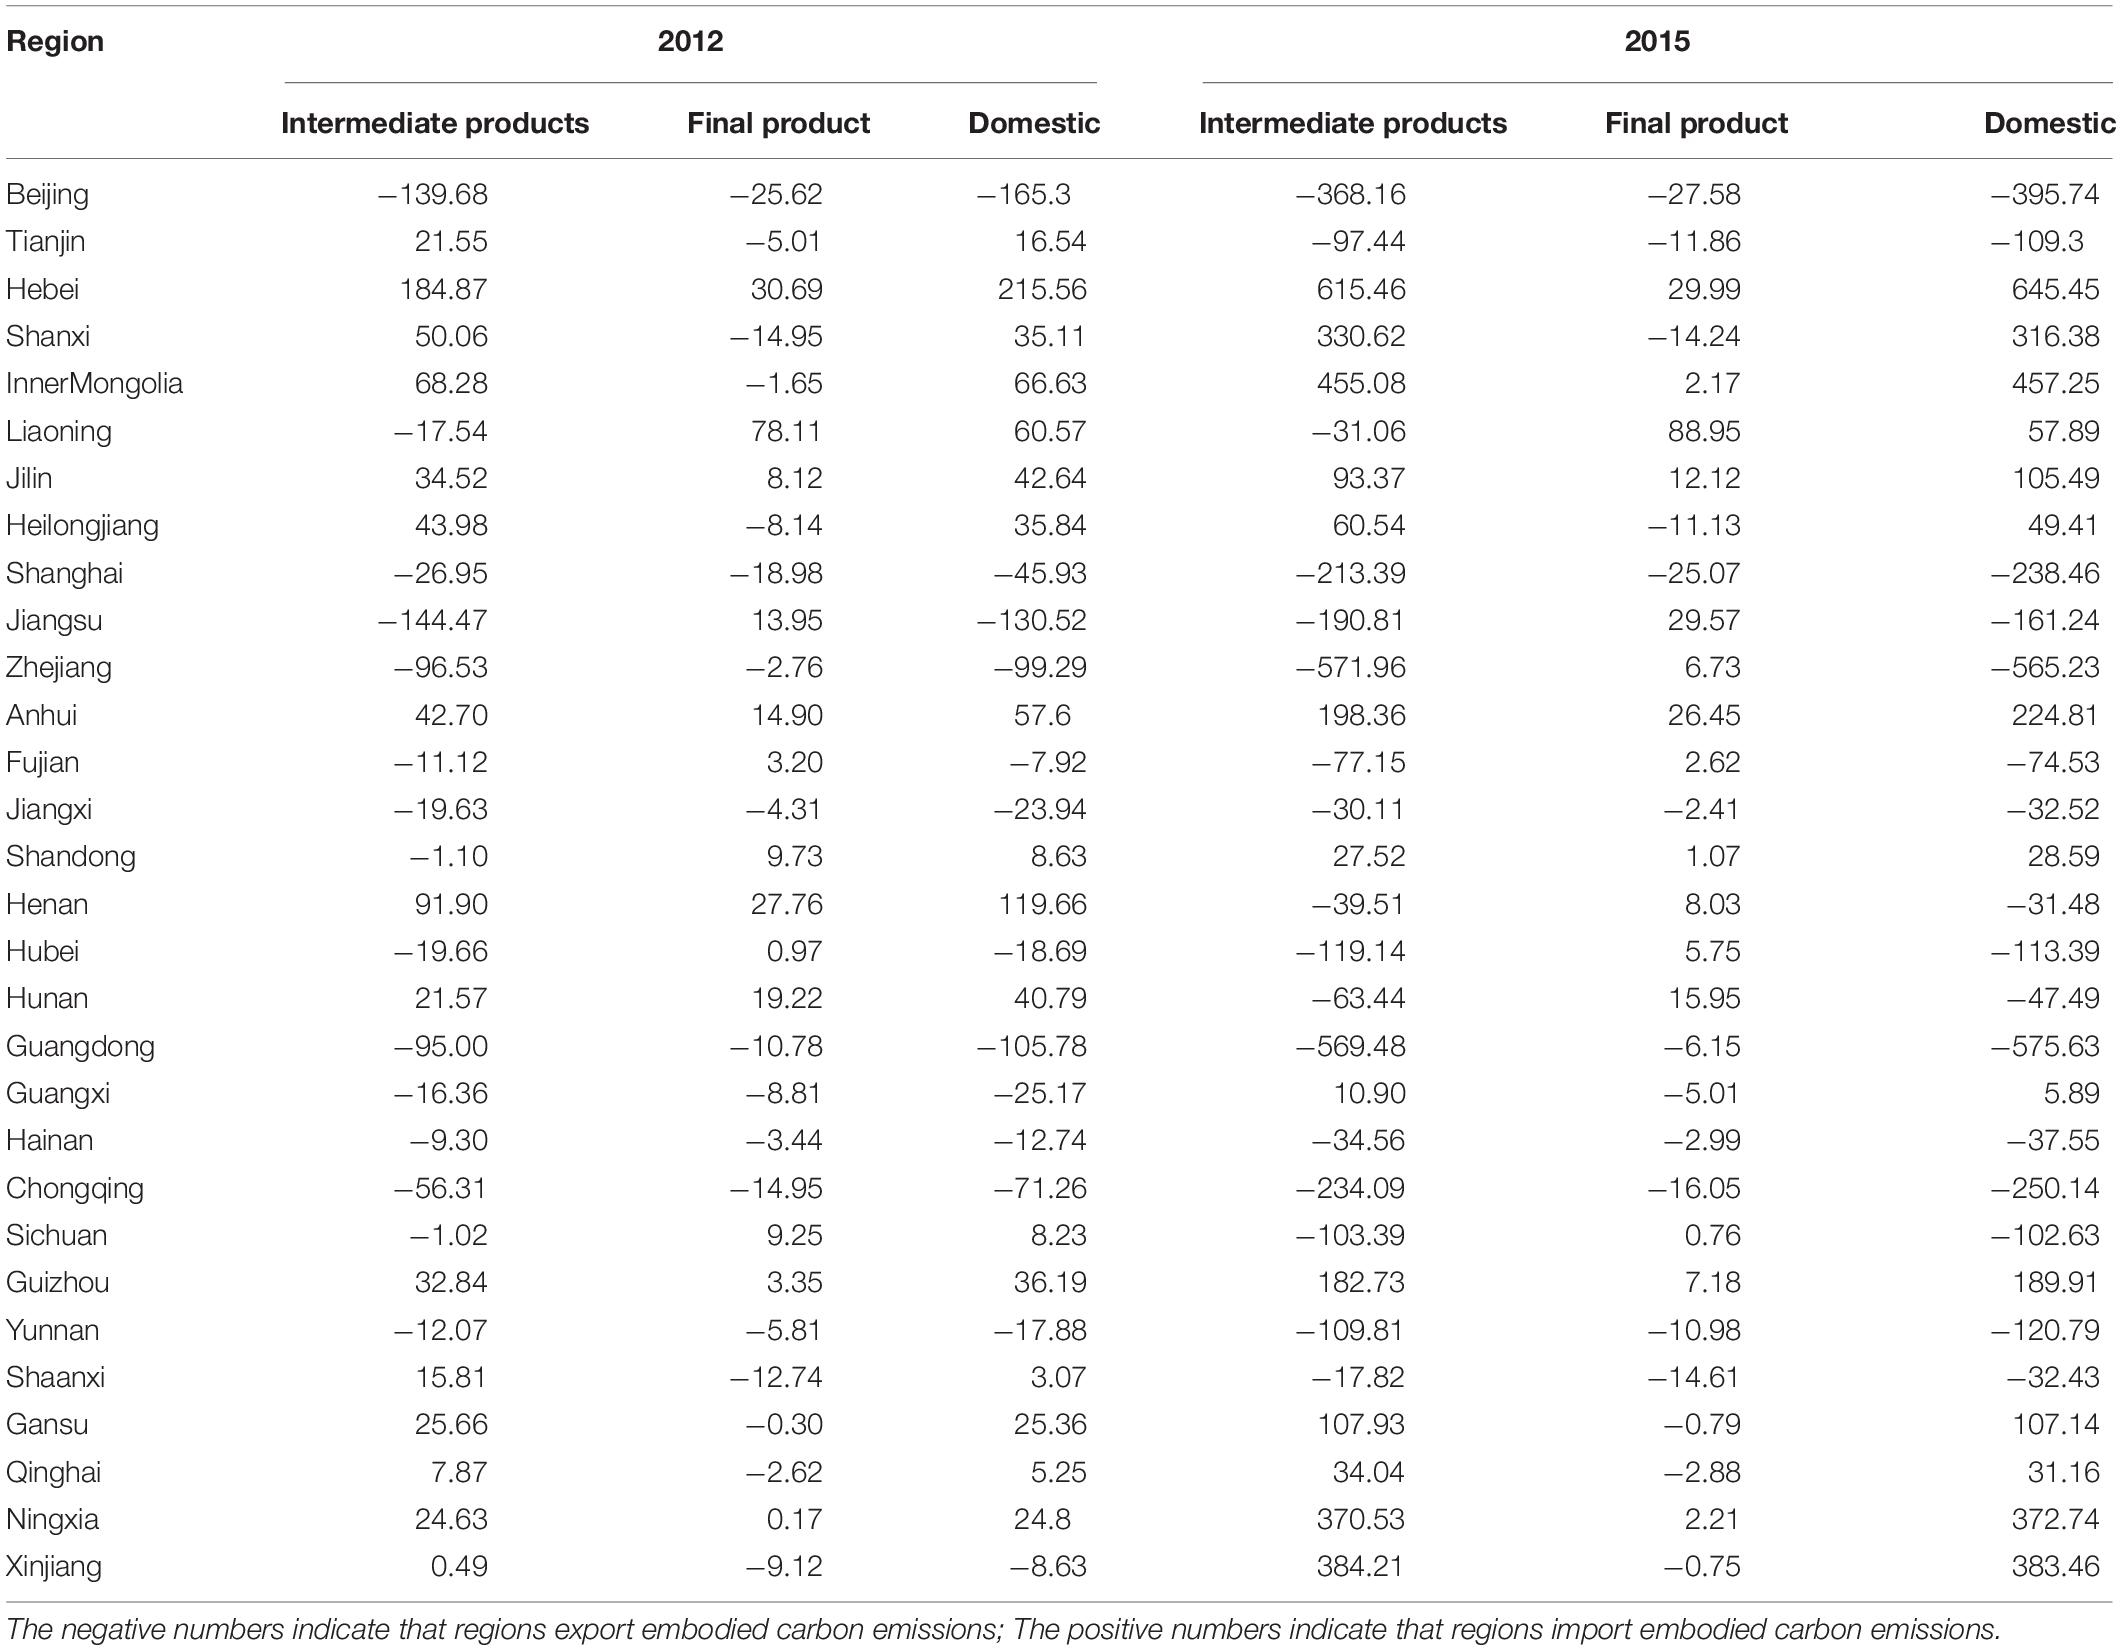
Table 1. CO2 emissions and transfer calculation of 30 province in China in 2012 and 2015 (Unit: Mt).
Carbon Footprint of Consumption
Beijing, Tianjin, Shanghai, Hubei, Guangdong, and Chongqing increased much more CO2 emissions by 146.08 million tons, 30.04 million tons, 229.79 million tons, 234.02 million tons, 780.92 million tons and 190.79 million tons, respectively, through consuming intermediate and final products from other provinces from 2012 to 2015. In 2012, the pilot regions contributed 24.2% of consumption-based CO2 emissions. And in 2015, the pilot regions shared 27.6% of the carbon footprint of consumption.
Carbon Footprint of Production
From 2012 to 2015, the majority of provinces were increasing their CO2 emissions due to production activities within the province boundary. Only Beijing, Tianjin, Shanghai, Sichuan, and Yunnan’s carbon footprint of production were declining. Beijing’s carbon emission of production dropped from 147.43 million tons in 2012 to 75.00 million tons in 2015. Tianjin reduced about 96.36 million tons of carbon emissions in production activity. And Shanghai decreased slightly by 9.17 million tons.
Carbon Transfer of Provinces
According to Figure 3, Beijing’s domestic CO2 emissions transfer in 2015 was −395.74 million tons which were more than twofold that in 2012. Tianjin’s net CO2 emissions transfer was −109.30 million tons which was reversed a lot in volume from 2012. Shanghai’s net CO2 emissions transfer was −238.46 million tons which was about fourfold that in 2012. Guangdong’s net CO2 emissions transfer was −575.63 million tons which is much higher than that in 2012. This situation also emerged in Chongqing.
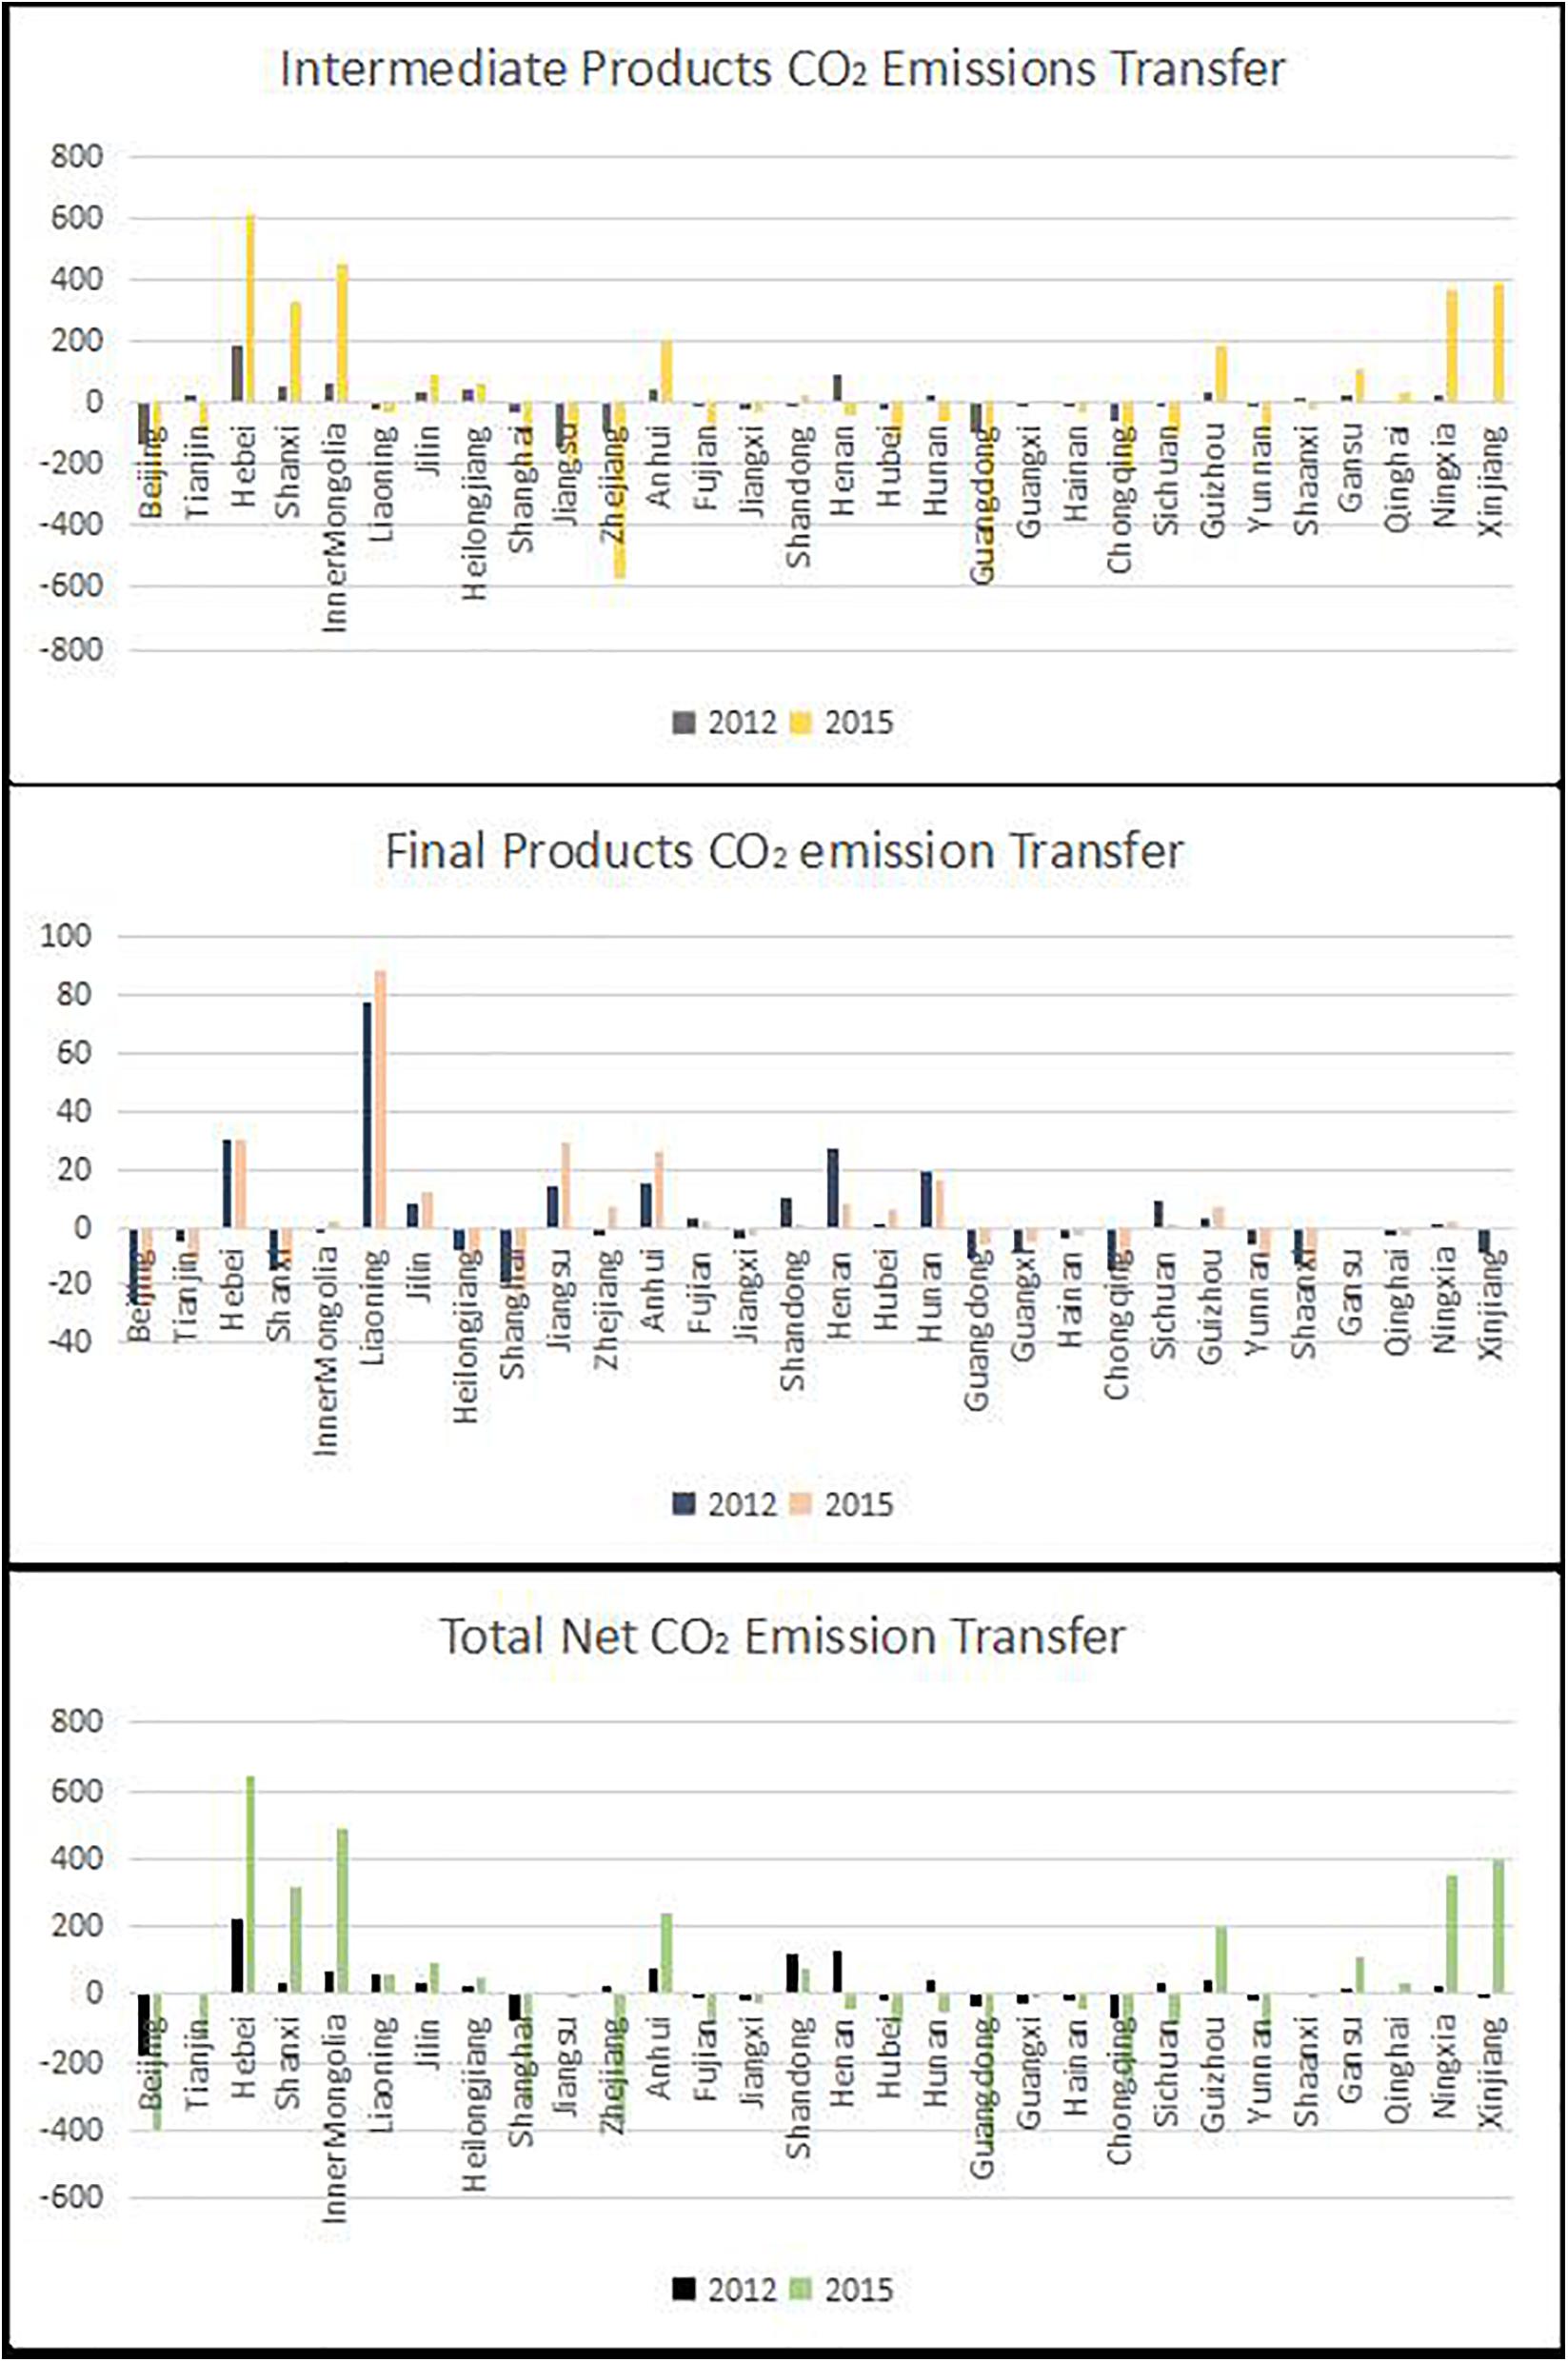
Figure 3. Details of CO2 transfer in 2012 and 2015.
In addition, we can figure out that Hebei, Inner Mongolia, Xinjiang, Ningxia, Shanxi, and Anhui digested the vast majority of CO2 emissions transfer. Their CO2 emissions imports dramatically increased by hundreds of million tons. Their transferred-in quantities increased 429.89 million tons, 390.62 million tons, 392.09 million tons, 347.94 million tons, 281.27 million tons, and 167.21 million tons, respectively, in 2015.
In terms of the CO2 emissions transfer of two types of products, Beijing, Tianjin, Shanghai, Hubei, Fujian, Guangdong, and Chongqing increased much more CO2 emissions exports by 228.49 million tons, 118.99 million tons, 186.43 million tons, 99.48 million tons, 66.03 million tons, 474.47 million tons, and 177.77, respectively, by consuming intermediate products from other provinces in 2015. Hebei, Shanxi, Inner Mongolia, Anhui, Ningxia, and Xinjiang augmented a lot of importing CO2 by 430.59 million tons, 280.56 million tons, 386.80 million tons, 155.65 million tons, 345.90 million tons, and 383.72 million tons due to providing much more intermediate products relatively in 2015. In addition, Jiangsu, Zhejiang, Hunan, and Hubei were the same bearing transferred-in CO2 emissions due to providing final products although they transfer CO2 emissions out by purchasing intermediate products.
Carbon Transfer Between Provinces
The details of multi-regional CO2 emissions transfer in 2015 for analyzing transferring properties between provinces are calculated and shown in Table 2. It must be noticed that the row data express the transferring volume of CO2 by consuming intermediate and final products provided by other provinces. For example, the data located at the second line and third column indicated that Beijing transfers CO2 to Tianjin by using Tianjin’s intermediate and final products.
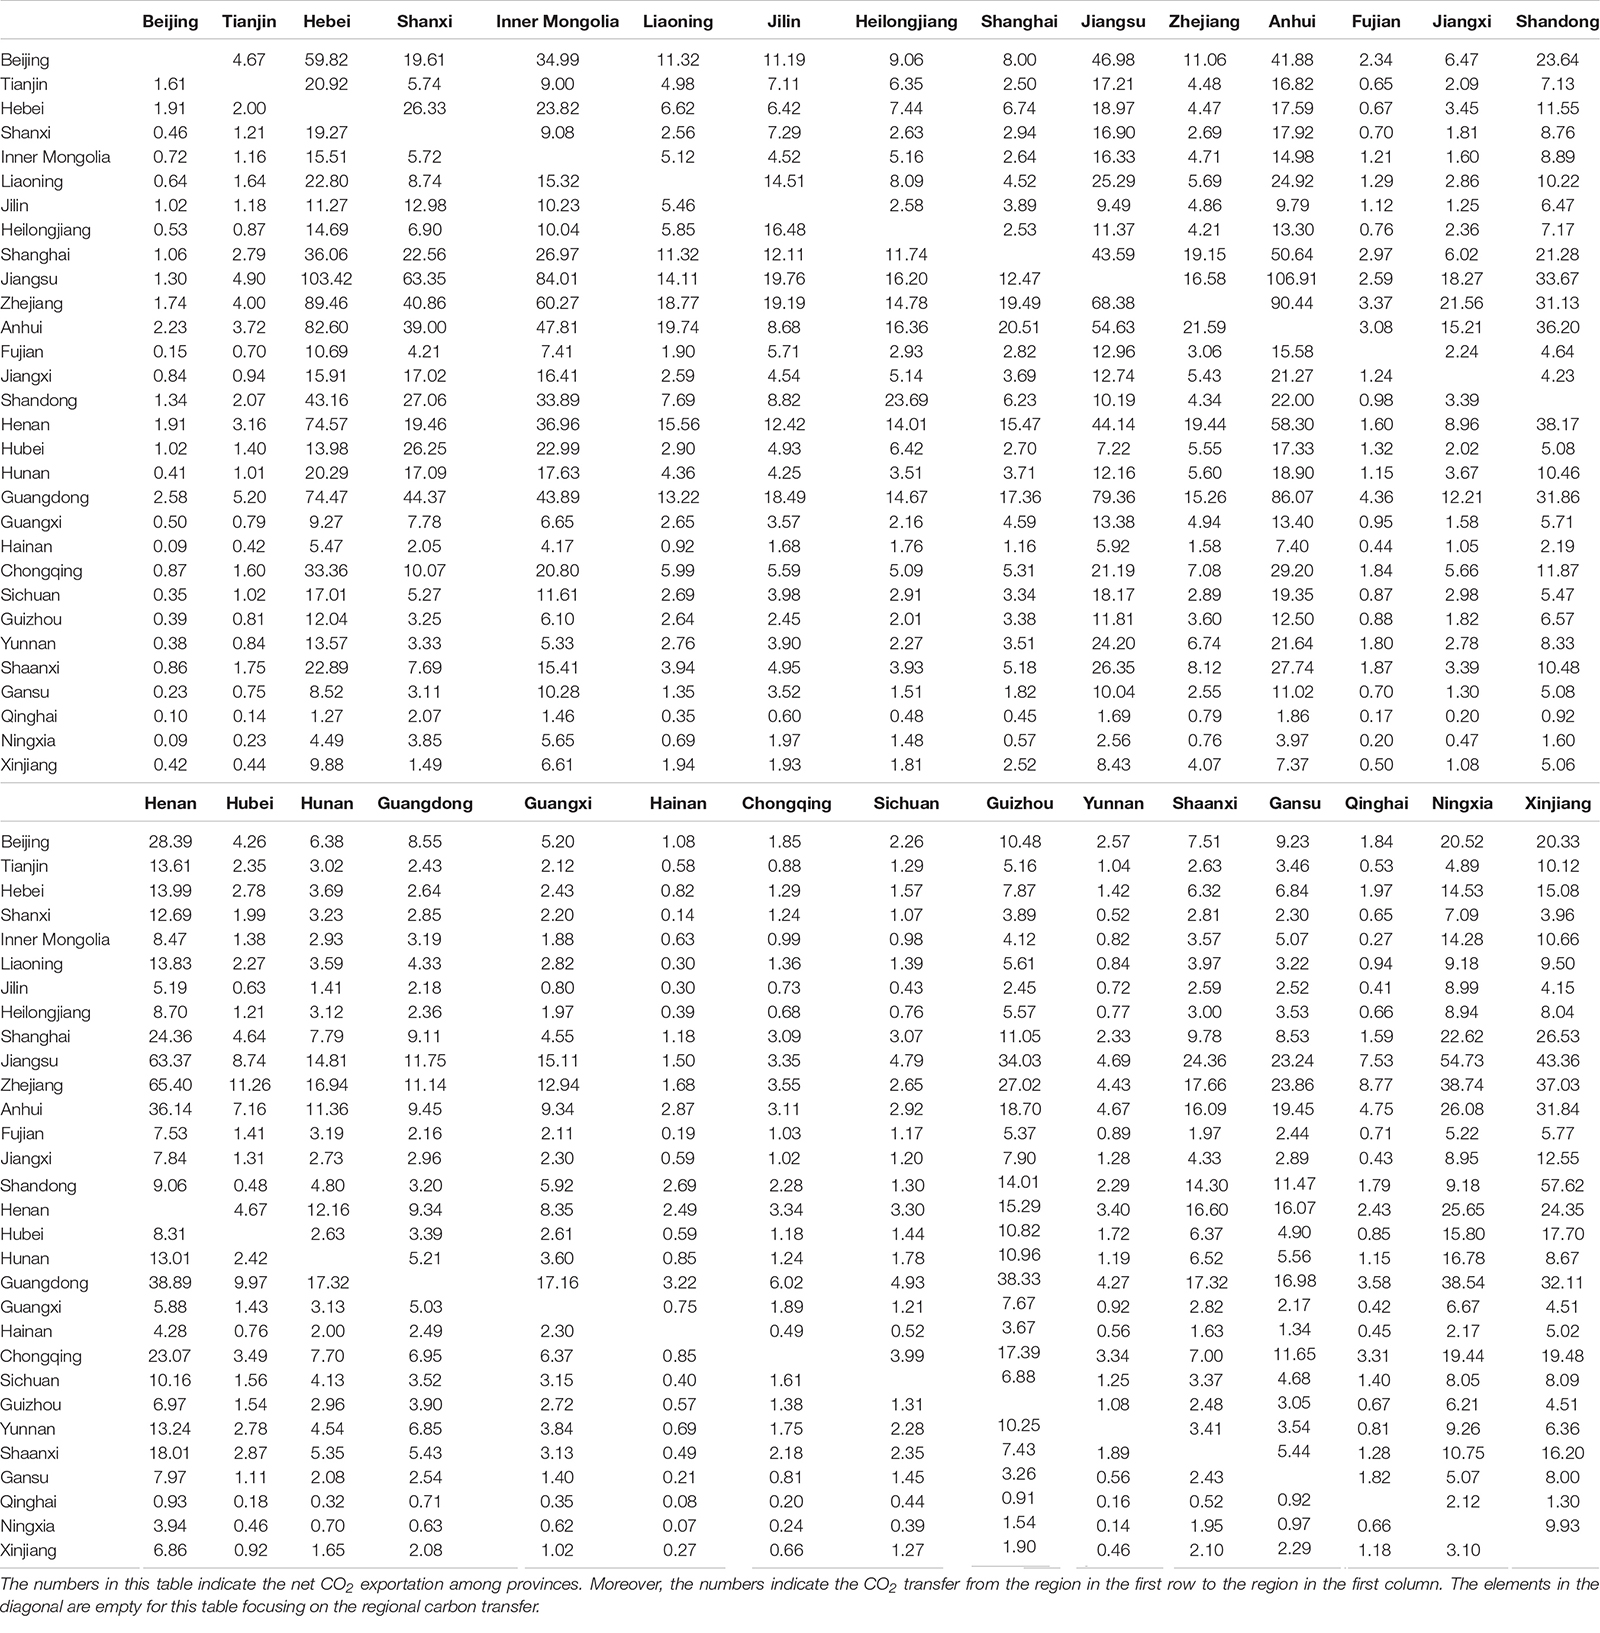
Table 2. Details of multi-regional CO2 emissions transfer for consuming intermediate and final products.
As mentioned previously, the quantity of CO2 transfer of the six pilot places had increased a lot in 2015 compared to the volume in 2012. Guangdong was the biggest CO2 exporter in 2015, and it mainly transferred to Jiangsu (79.36 million tons), Anhui (86.07 million tons), Hebei (74.47 million tons), Henan (38.89 million tons), and Ningxia (38.54 million tons) which indicated that Guangdong used these regions’ products as primary sources. Followed Guangdong, Beijing was the second CO2 exporter who mainly transferred to Inner Mongolia (34.99 million tons), Hebei (59.82 million tons), Jiangsu (46.98 million tons), and Anhui (41.88 million tons). Overview, we can figure out that embodied CO2 emissions continued to flow to nearby provinces and Northern, central and northwest provinces of China which were also poorly-developed in economics according to Table 2. Interestingly, Jiangsu, a developed province whose GDP ranked second place after Guangdong in 2015, accepted embodied CO2 emissions from pilot regions as a primary recipient. It is believed that Jiangsu created increment mainly through manufacturing.
Discussion
The present study was designed to determine the effect of ETS implementation on multi-regional carbon footprint in China. The MRIO analysis results showed that the six early pilot provinces enhanced their CO2 emissions exports from 372.48 million tons in 2012 to 1631.63 million tons in 2015 after ETS policy implementation.
From the standpoint of direct carbon emissions, the reduction potential of pilot regions was limited. However, the results showed that the carbon emission intensity of pilot regions remained low even a bit lower, which may be explained by the development of tertiary industry and allow them to create more value with less energy consumption. This encouraging result indicates that both to develop and to reduce emission and it had better further consider improving the combustion efficiency.
In terms of emission responsibility, the summarizing carbon footprint of the production of six pilot regions declined by 4.15% from 2012 to 2015, while the six pilot regions’ summarizing carbon footprint of consumption increased about 3.39% from 2012 to 2015. From a life cycle perspective, the upstream material consumption in these pilot regions was becoming higher than other regions from 2012 to 2015, for this kind of material required more fossil fuel. Despite the demand within the province boundary, some regions can only develop through undertake high energy consumption industries. For example, Ningxia, Xinjiang, Guizhou, Anhui, and Gansu had much higher carbon intensity in 2015 which indicated that they were producing on low combustion efficiency. These regions were underdeveloped but full of natural resources and inevitably resulted in more carbon emissions in development.
Although some pilot regions decreased their direct carbon emission and carbon emission intensity, the carbon leakage should take into consideration in defining CO2 emissions responsibilities, especially the influences on central and western regions of China. According to the calculation above, the pilot regions created much more carbon emission exports comparing to the number of carbon exports in 2012. Conversely, during that period, some provinces endured heavy CO2 emissions imports. In response to environmental regulations, the pilot regions tended to eliminate backward production and purchased high energy consumption products depending on imports from other regions, which could lead to carbon leakage.
The immense quantity of carbon leakage in China makes it necessary to balance the economy and environment between regions. Thus, laws and regulations should be further improved to regularize actual carbon emissions. Moreover, introducing innovation factors into the western regions with the aid of “China’s Western Development Strategy” could improving these backward regions’ green economic efficiency encouragingly (Yang et al., 2018).
Conclusion
Growing concerns about the impact of greenhouse gas emissions due to rising population and energy demand are leading to the adoption of comprehensive package policies. The CO2 ETS can play a significant role in reducing CO2 emissions and the policy’s spillover effect should be concerned as well. Therefore, a China-MRIO model was conducted to estimate the spillover effect of ETS implementation in China from 2012 to 2015. In this study, we could demonstrate that the adoption of ETS in six pilot provinces has had a huge positive environmental impact on themselves but negative impacts on the rest of China.
In this paper, the CO2 emissions on production based and consumption based of 30 provinces were calculated, respectively, by using 2012 MRIO table and 2015 MRIO table. And then the CO2 transfer among provinces in 2012 and 2015 was computed to capture the spillover effect. The direct CO2 emissions of pilot regions like Beijing, Tianjin, Shanghai, and Chongqing were reduced, while Guangdong and Hubei which were members of pilot regions increased their direct carbon emissions. Hebei, Shanxi, Inner Mongolia, Ningxia, and Xinjiang increased a mass of transferred-in CO2 emissions mainly by providing intermediate products, which indicated that ETS pilot regions had transferred a great amount of embodied CO2 emissions to underdeveloped areas by cutting down intermediate products production and enhancing intermediate products trading. These phenomena also happened in final products trading.
The high emission intensities of central and western China’s regions are the first reason for their high carbon emissions for input-output processes. The development of the east and the west is still unbalanced. There should be great variation in resources endowment, economic size, environmental capacity and industrial structure. The low carbon reduction policy is needed to be developed according to the local conditions. The eastern regions of China possess advanced technologies, human talents and intellectual resources, which must place priority on strategic high-tech industries. The rest regions of China need to take due development of forward-looking strategic industries with technology and assistance from the eastern regions of China under Environmental strict constraints.
Moreover, it is necessary to consider building a sound carbon emission credits allocation system based on multi-regional net CO2 transfer. The embodied carbon transfer among regions results from regional division. With the deepening of regional division, cooperation and commerce, the consumption side should share responsibility with the production side with the support of clearing up carbon transfer direction.
According to the results shown above, China’s ETS policy is facing challenges to CO2 emissions management in multi-regions. The ETS policy is considered as an effective tool to reach the 2030 carbon-neutral vision under the strength of market regulation. However, the 30 provinces of China offer a wide variety of economics and development stages. To guarantee economic growth, underdeveloped areas are likely to undertake more industrial manufacture with much more carbon emissions. Therefore, when allocating carbon allowance, policymakers should not only consider the direct carbon emissions but also be aware of embodied CO2 emissions that happened in product trading, especially intermediate product trading. Thus, it is helpful to reduce employing intermediate products that require high consumption of energy of downstream companies and promoting efficiency in the production process.
Data Availability Statement
Publicly available datasets were analyzed in this study. This data can be found here: CEADs, https://www.ceads.net.cn/.
Author Contributions
XL, CW, LL, HW conception and design of study, analysis and/or interpretation of data, drafting the manuscript, and approval of the version of the manuscript to be published. XL and LL acquisition of data. XL and CW revising the manuscript critically for important intellectual content. All authors contributed to the article and approved the submitted version.
Funding
This work was partially supported by the Key Program of the National Social Science Foundation of China (20&ZD117), the National Natural Science Foundation of China (71771057, 72003044, and 72003045), National Social Science Foundation of China (20FGLB072), Guangdong Social Science Project (GD20SQ15 and GD2018CYJ01), Guangdong Natural Science Foundation (2021A1515011960 and 2020A1515010863), Guangzhou Social Science Project (2020GZQN39 and 2020GZGJ120), and the Foundation for Guangdong Province Universities and Colleges Pearl River Scholar Funded Scheme (GDUPS2019).
Conflict of Interest
The authors declare that the research was conducted in the absence of any commercial or financial relationships that could be construed as a potential conflict of interest.
References
Aichele, R., and Felbermayr, G. (2015). Kyoto and carbon leakage: an empirical analysis of the carbon content of bilateral trade. Rev. Econ. Stat. 97, 104–115.
Barragán-Beaud, C., Pizarro-Alonso, A., Xylia, M., Syri, S., and Silveira, S. (2018). Carbon tax or emissions trading? An analysis of economic and political feasibility of policy mechanisms for greenhouse gas emissions reduction in the Mexican power sector. Energy Policy 122, 287–299. doi: 10.1016/j.enpol.2018.07.010
BP (2020). Statistical Review of World Energy. Available online at: https://www.bp.com/en/global/corporate/energy-economics/statistical-review-of-world-energy.html (accessed August 28, 2020).
CEADs. (2012). Emission Inventories for 30 Provinces. Available online at: https://www.ceads.net/data/province/by_sectoral_accounting/Provincial?#278 (accessed October 10, 2020).
CEADs. (2015). Emission Inventories for 30 Provinces. Available online at: https://www.ceads.net/data/province/by_sectoral_accounting/Provincial?#281
Daskalakis, G., Psychoyios, D., and Markellos, R. N. (2009). Modeling CO2 emission allowance prices and derivatives: evidence from the European trading scheme. J. Banking Finance 33, 1230–1241. doi: 10.1016/j.jbankfin.2009.01.001
Davis, S. J., and Caldeira, K. (2010). Consumption-based accounting of CO2 emissions. Proc. Natl. Acad. Sci. U.S.A. 107, 5687–5692.
Hua, G., Cheng, T. C. E., and Wang, S. (2011). Managing carbon footprints in inventory management. Int. J. Prod. Econ. 132, 178–185. doi: 10.1016/j.ijpe.2011.03.024
IPCC (2014). 2006 IPCC Guidelines for National Greenhouse Gas Inventories, Prepared by the National Greenhouse Gas Inventories Programme. Geneva: IPCC, 9–21.
Koch, N., Fuss, S., Grosjean, G., and Edenhofer, O. (2014). Causes of the EU ETS price drop: recession, CDM, renewable policies or a bit of everything?—New evidence. Energy Policy 73, 676–685. doi: 10.1016/j.enpol.2014.06.024
Kulionis, V., and Wood, R. (2020). Explaining decoupling in high income countries: a structural decomposition analysis of the change in energy footprint from 1970 to 2009. Energy 194:116909. doi: 10.1016/j.energy.2020.116909
Leontief, W. (1970). Environmental repercussions and the economic structure: an input-output approach. Rev. Econ. Stat. 52, 262–271. doi: 10.2307/1926294
Liang, Q. M., Fan, Y., and Wei, Y. M. (2007). Multi-regional input–output model for regional energy requirements and CO2 emissions in China. Energy Policy 35, 1685–1700. doi: 10.1016/j.enpol.2006.04.018
Liu, Y., Lv, Y., and Zhou, M. (2015). Analysis on the influence factors of computing CO2 emission by input-output method. China Popul. Resour. Environ. 25, 21–28.
Liu, Y., Meng, B., Hubacek, K., Xue, J., Feng, K., and Gao, Y. (2016). ‘Made in China’: a reevaluation of embodied CO2 emissions in Chinese exports using firm heterogeneity information. Appl. Energy 184, 1106–1113. doi: 10.1016/j.apenergy.2016.06.088
Liu, Z., Guan, D., Wei, W., Davis, S. J., Ciais, P., Bai, J., et al. (2015). Reduced carbon emission estimates from fossil fuel combustion and cement production in China. Nature 524, 335–338. doi: 10.1038/nature14677
Meng, B., Xue, J., Feng, K., Dabo, G., and Xue, F. (2013). China’s inter-regional spillover of carbon emissions and domestic supply chains. Energy Policy 61, 1305–1321. doi: 10.1016/j.enpol.2013.05.108
Mi, Z., Meng, J., Guan, D., Shan, Y., Song, M., Wei, Y. M., et al. (2017). Chinese CO 2 emission flows have reversed since the global financial crisis. Nat. Commun. 8:1712.
Mi, Z., Meng, J., Zheng, H., Yuli, S., Wei, Y. M., and Guan, D. (2018). A multi-regional input-output table mapping China’s economic outputs and interdependencies in 2012. Sci. Data 5:180155.
Otaki, M. (2013). Emission trading or proportional carbon tax: a quest for more efficacious emission control. Environ. Syst. Res. 2, 1–6.
Peters, G. P., and Hertwich, E. G. (2008b). CO2 embodied in international trade with implications for global climate policy. Environ. Sci. Technol. 42, 1401–1407. doi: 10.1021/es072023k
Peters, G. P., and Hertwich, E. G. (2008a). Post-Kyoto greenhouse gas inventories: production versus consumption. Climatic Change 86, 51–66. doi: 10.1007/s10584-007-9280-1
Shan, Y., Guan, D., Zheng, H., Ou, J., Li, Y., Meng, J., et al. (2018). China CO 2 emission accounts 1997–2015. Sci. Data 5, 1–14.
Su, B., and Ang, B. W. (2013). Input–output analysis of CO2 emissions embodied in trade: competitive versus non-competitive imports. Energy Policy 56, 83–87. doi: 10.1016/j.enpol.2013.01.041
Wang, A., Feng, Z., and Meng, B. (2017). Measure of carbon emissions and carbon transfers in 30 provinces of China. J. Q. Tech. Econ. 8, 89–104.
Wiedmann, T., Wilting, H. C., Lenzen, M., Lutter, S., and Palm, V. (2011). Quo Vadis MRIO? Methodological, data and institutional requirements for multi-region input–output analysis. Ecol. Econ. 70, 1937–1945. doi: 10.1016/j.ecolecon.2011.06.014
Wu, R., Dai, H., Geng, Y., Xie, Y., Masui, T., and Tian, X. (2016). Achieving China’s INDC through carbon cap-and-trade: insights from Shanghai. Appl. Energy 184, 1114–1122. doi: 10.1016/j.apenergy.2016.06.011
Yang, F., Yang, M., Xue, B., and Luo, Q. (2018). The effects of China’s western development strategy implementation on local ecological economic performance. J. Clean. Prod. 202, 925–933. doi: 10.1016/J.JCLEPRO.2018.08.203
Keywords: carbon emissions trading scheme, carbon transfer, MRIO model, spillover effect, effect evaluation
Citation: Li X, Wang C, Liao L and Wen H (2021) The Spillover Effect Evaluation of Chinese Emissions Trading Scheme. Front. Energy Res. 9:677873. doi: 10.3389/fenrg.2021.677873
Received: 08 March 2021; Accepted: 13 April 2021;
Published: 24 May 2021.
Edited by:
You-Hua Chen, South China Agricultural University, ChinaCopyright © 2021 Li, Wang, Liao and Wen. This is an open-access article distributed under the terms of the Creative Commons Attribution License (CC BY). The use, distribution or reproduction in other forums is permitted, provided the original author(s) and the copyright owner(s) are credited and that the original publication in this journal is cited, in accordance with accepted academic practice. No use, distribution or reproduction is permitted which does not comply with these terms.
*Correspondence: Hongxin Wen, aHh3ZW4yMDExQDEyNi5jb20=