 Zhukui Tan1,2
 Liming Sun
- 1School of Economics and Management, North China Electric Power University, Beijing, China
- 2Guizhou Power Grid Co., Ltd., Electric Power Research Institute, Guiyang, China
- 3Guangzhou Shuimutech Co., Ltd., Guangzhou, China
In order to deal with the problem of environmental pollution and energy consumption, developing clean and renewable energy to maintain the sustainable development of society has become an urgent matter for human beings. Therefore, distributed generation (DG) is widely concerned by engineers. However, the output of DG is generally random and intermittent. When it is connected to different locations, different capacities and different types of power grids, the safe and stable operation of the power system will be affected to different degrees. When selecting the optimal DG access scheme, power grid planners must consider the influence of capacity, type and location to ensure a safer, more stable, more reliable and more efficient power grid operation. Therefore, this paper proposes an objective function considering integrated power losses, voltage profile and pollution emission, and swarm moth flame optimization algorithm (SMFO) is used to solve. Finally, based on IEEE-33 bus, the effectiveness of the proposed algorithm is verified.
Introduction
Unreasonable distributed generation (DG) installation will increase the power loss of the distribution network and even lead to system instability (Gandomkar et al., 2005; Lund, 2006; Wang et al., 2014), on the other hand, increase the economic cost of grid-connection (Moradi and Abedini, 2016; Ogunjuyigbe et al., 2016; Meena et al., 2017). According to statistics, more than 80% of power failure accidents are closely related to the distribution network, so it is extremely urgent to choose an appropriate DG access way to the distribution network (Devi and Subramanyam, 2007; Mehleri et al., 2012; Paterakis et al., 2015). Therefore, it is necessary to study the optimal location and sizing of DG.
Nowadays, DG connected to the distribution network is mainly the intermittent power source whose output is related to the natural environment, such as wind power (Kansal et al., 2013; Murty and Kumar, 2015; Liu et al., 2020). The randomness of its output adds greater uncertainty to the load prediction, planning and operation of the power network, and increases the difficulty of the planning and design of the distribution network with DG (El-Zonkoly, 2011; Ameli et al., 2014; Poornazaryan et al., 2016). The problem of location and capacity of distributed power supply access to distribution network is an optimization problem that needs to consider the cooperation of multiple factors (Afzalan et al., 2012; Song et al., 2018, 2020). Thus, it is necessary to comprehensively consider various technical indicators to obtain a practical and feasible solution in line with the planning area (Mitra et al., 2013; Naik et al., 2013; Iqbal et al., 2017). Literature (Lin and Bie, 2018) constructed a distribution network expansion planning model aiming at economic and environmental benefits. Literature (Kaur et al., 2014) proposes a method considering the load characteristics and regenerated DG probability to improve the voltage stability margin. Literature (Hung et al., 2010) proposes a location selection method based on node pricing that takes profit, network losses reduction and voltage improvement of DG as optimization objectives.
In the research of DG planning, the solution of a large number of planning models is relatively complex, so the study and selection of solving algorithms directly affect the choice of planning schemes (Gayme and Topcu, 2013; Calderaro et al., 2014; El-Fergany, 2015). At present, there are mainly mathematical optimization and meta-heuristic algorithm to solve the objective function (Zhu et al., 2006; Hedayati et al., 2008; Acharya et al., 2016). However, the mathematical optimization has been abandoned by the majority of scholars due to its low computational efficiency and only applicable to small-scale distribution networks, and meta-heuristic algorithm has been developed rapidly (Das et al., 2016; Hamida et al., 2018; He et al., 2020). Literature (Abri et al., 2013) applied genetic algorithm (GA) to optimize this problem for newly added load nodes in the expansion planning of distribution network, and then simulated annealing algorithm was used to optimize individual schemes generated in the process of genetic algorithm, thus reducing the load sizing of DG access to distribution lines and the influence of power flow of distribution network. Literature (Varesi, 2011) proposed an improved particle swarm optimization algorithm based on hybrid simulated annealing method to optimize the location and volume of distributed power supply. However, the convergence speed of the above algorithm is relatively slow, the efficiency is low, and the result is easy to appear in the local optimal situation.
Therefore, an objective function considering power losses, voltage profile and pollution emission is proposed in this paper, and which is solved by swarm moth flame optimization (SMFO). Finally, the method is verified based on IEEE-33 bus, and the results verify the effectiveness of the method.
The remaining of this paper is organized as follows: section “Problem Formulation” develops the objective function. In section “Swarm Moth-Flame Optimizer Moth Flame Optimization,” SMFO is described. Comprehensive case studies are undertaken in section “Case Studies.” And section “Conclusion” summarizes the main contributions of the paper.
Problem Formulation
Objective Function
DG planning is an optimization problem with multiple optimization objectives and multiple constraints. Through the study on the influence of the distribution network connected with DG, this paper takes the losses reduction index, environmental emission reduction index and voltage profile index as the optimization objectives, so as to minimize the power loss of the distribution network.
Power Losses
When DG planning is carried out in the distribution network, the corresponding network losses calculation formula should be selected according to the characteristics of load in the distribution network to be planned to calculate the active power losses of the distribution network. The connection of DG will change the power losses of the distribution network, and the change effect on the power losses is related to the grid-connected location and sizing, so the losses reduction index is established to measure the influence of DG grid-connected on the active power losses. The losses reduction index is expressed as (Home-Ortiz et al., 2019):
where E_P represents the power losses reduction index, PPloss and PDGlossrepresent the active power losses of the distribution network before installing DG and after installing DG, respectively. The larger the losses reduction index E_P is, the greater the role of DG in reducing the line losses of the distribution network after DG planning. R_l is the resistance on the lth line; I_l is the current on the lth line.
Environmental Emission Reduction Index
Since the vast majority of electric energy in the power grid is generated by thermal generators, power generation releases a variety of polluting gases into the atmosphere at the same time. The three gases that are more destructive to the environment are CO2, NOx, and SO2. Because the three gases have great differences in their destructiveness to the environment, NOx and SO2 will cause acid rain and do more serious harm to the environment, so they cannot be treated equally. Therefore, the corresponding weight coefficient is introduced into the formula to distinguish their destructiveness. Thus, the environmental protection emission reduction index can be expressed as (Varesi, 2011):
where EE is the environmental emission reduction index.wC, wN, and wS represent the weight coefficients of environmental pollution of CO2, NOx, and SO2, which are set as 0.5, 0.25, and 0.25, respectively.MDGC, MDGN, and MDGS represent the quality of reducing CO2, NOx, and SO2 emissions after DG planning, respectively. MPC, MPN, and MPS, respectively, represent the quality of CO2, NOx, and SO2 emitted by the distribution network before installation of DG. The higher the EE is, the greater the role of DG in reducing the emission of polluting gases. In addition, Table 1 lists the emissions of three types of DG and thermal power generation (Home-Ortiz et al., 2019).
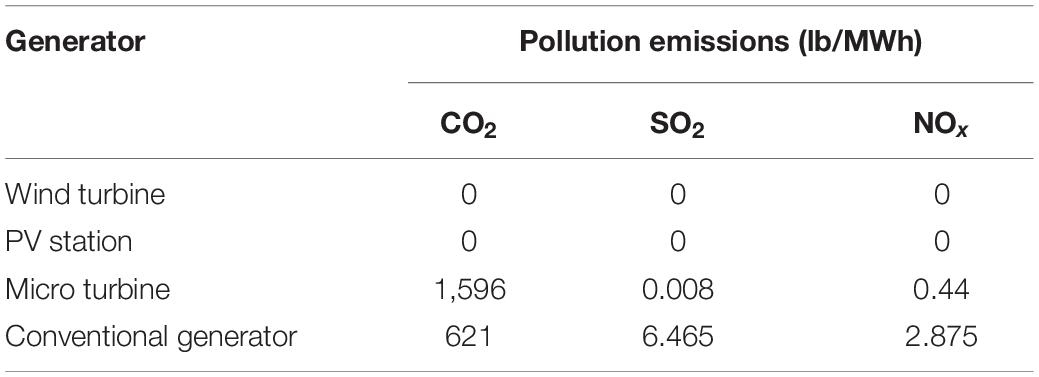
Table 1. Four types of power generation emissions.
Voltage Profile Index
The voltage profile index of each node in the distribution network is an important symbol to measure the power quality of the distribution network. The addition of DG will support the node voltage. The voltage profile index is established to measure the improvement effect of DG on the node voltage profile, and its expression is as follows (Home-Ortiz et al., 2019):
where, EV is the node voltage profile index. N represents the total number of nodes in the planned distribution; VPi represents the voltage of the ith node in the distribution network before installing DG; V_N denotes the rated voltage of distribution network; VDGi represents the voltage at the ith node after DG is incorporated into the distribution network. The greater the voltage profile index EV is, the greater the effect of DG grid-connection on reducing the voltage offset of each node of the distribution network.
Objective Function
where ωP = 0.5 represents the weight coefficient of the losses reduction index, ωE = 0.25 represents the weight coefficient of the environmental emission reduction index, ωV = 0.25 represents the weight coefficient of the voltage profile index. Besides, the weight coefficient can be reselected by engineers based on the actual application.
Constraint
Power Balance
where PGi and QGi respectively represent the active power output and reactive power output of the power supply at ith node in the distribution network. PDGi and QDGi are, respectively, the active power and reactive power of DG output at ith node. U_i is the voltage of the ith node; Gij and Bij represent the admittance and susceptance between the ith node and the jth node; θij is the power angle between ith node and the jth node; PLi and QLi, respectively, represent the active power and reactive power required by the load on ith node in the distribution network (Home-Ortiz et al., 2019).
DG Sizing
Due to the limitation of the working principle, structure and production model of the production DG, and the influence of environmental factors on the operation of the production DG, the power dispatching cannot be completely controlled, which will have a great impact on the power flow, relay protection, voltage and waveform of the original power grid. Therefore, the power allowed to access the power grid DG is limited (Home-Ortiz et al., 2019).
where PiDGmin represents the minimum sizing of the DG connected by the ith node; PiDG represents the active power sent to the power grid by DG connected to the ith node; PiDGmax represents the maximum sizing of the DG connected by the ith node. Piload is the total load on the ith node.
Swarm Moth-Flame Optimizer Moth Flame Optimization
Inspiration
Moths, a close relative of butterflies, belong to the order Lepidoptera of the class Insects. There are many kinds of moths, but most of them are nocturnal and phototropic (Mirjalili, 2015). Therefore, there is a folk saying that “moths burn themselves in the fire,” and the inspiration of the optimization algorithm of moths in the fire is also derived from the biological behavior of “moths in the fire.”
However, according to biologists, “moth to the fire” is not a suicide behavior, but the moth itself has a navigation mechanism. While moths have compound eyes, they have poor vision. At night, when they cannot see the road clearly, they can only determine their current position and the next direction of flight by evaluating the relative position of themselves and the light source (usually moonlight). This Orientation method is called Transverse Orientation (Yıldız and Yıldız, 2017). However, if artificial light, such as streetlights, is considered, moths are always observed approaching light in a spiral shape due to such a short distance. As shown in Figure 1, SMFO has two main features:
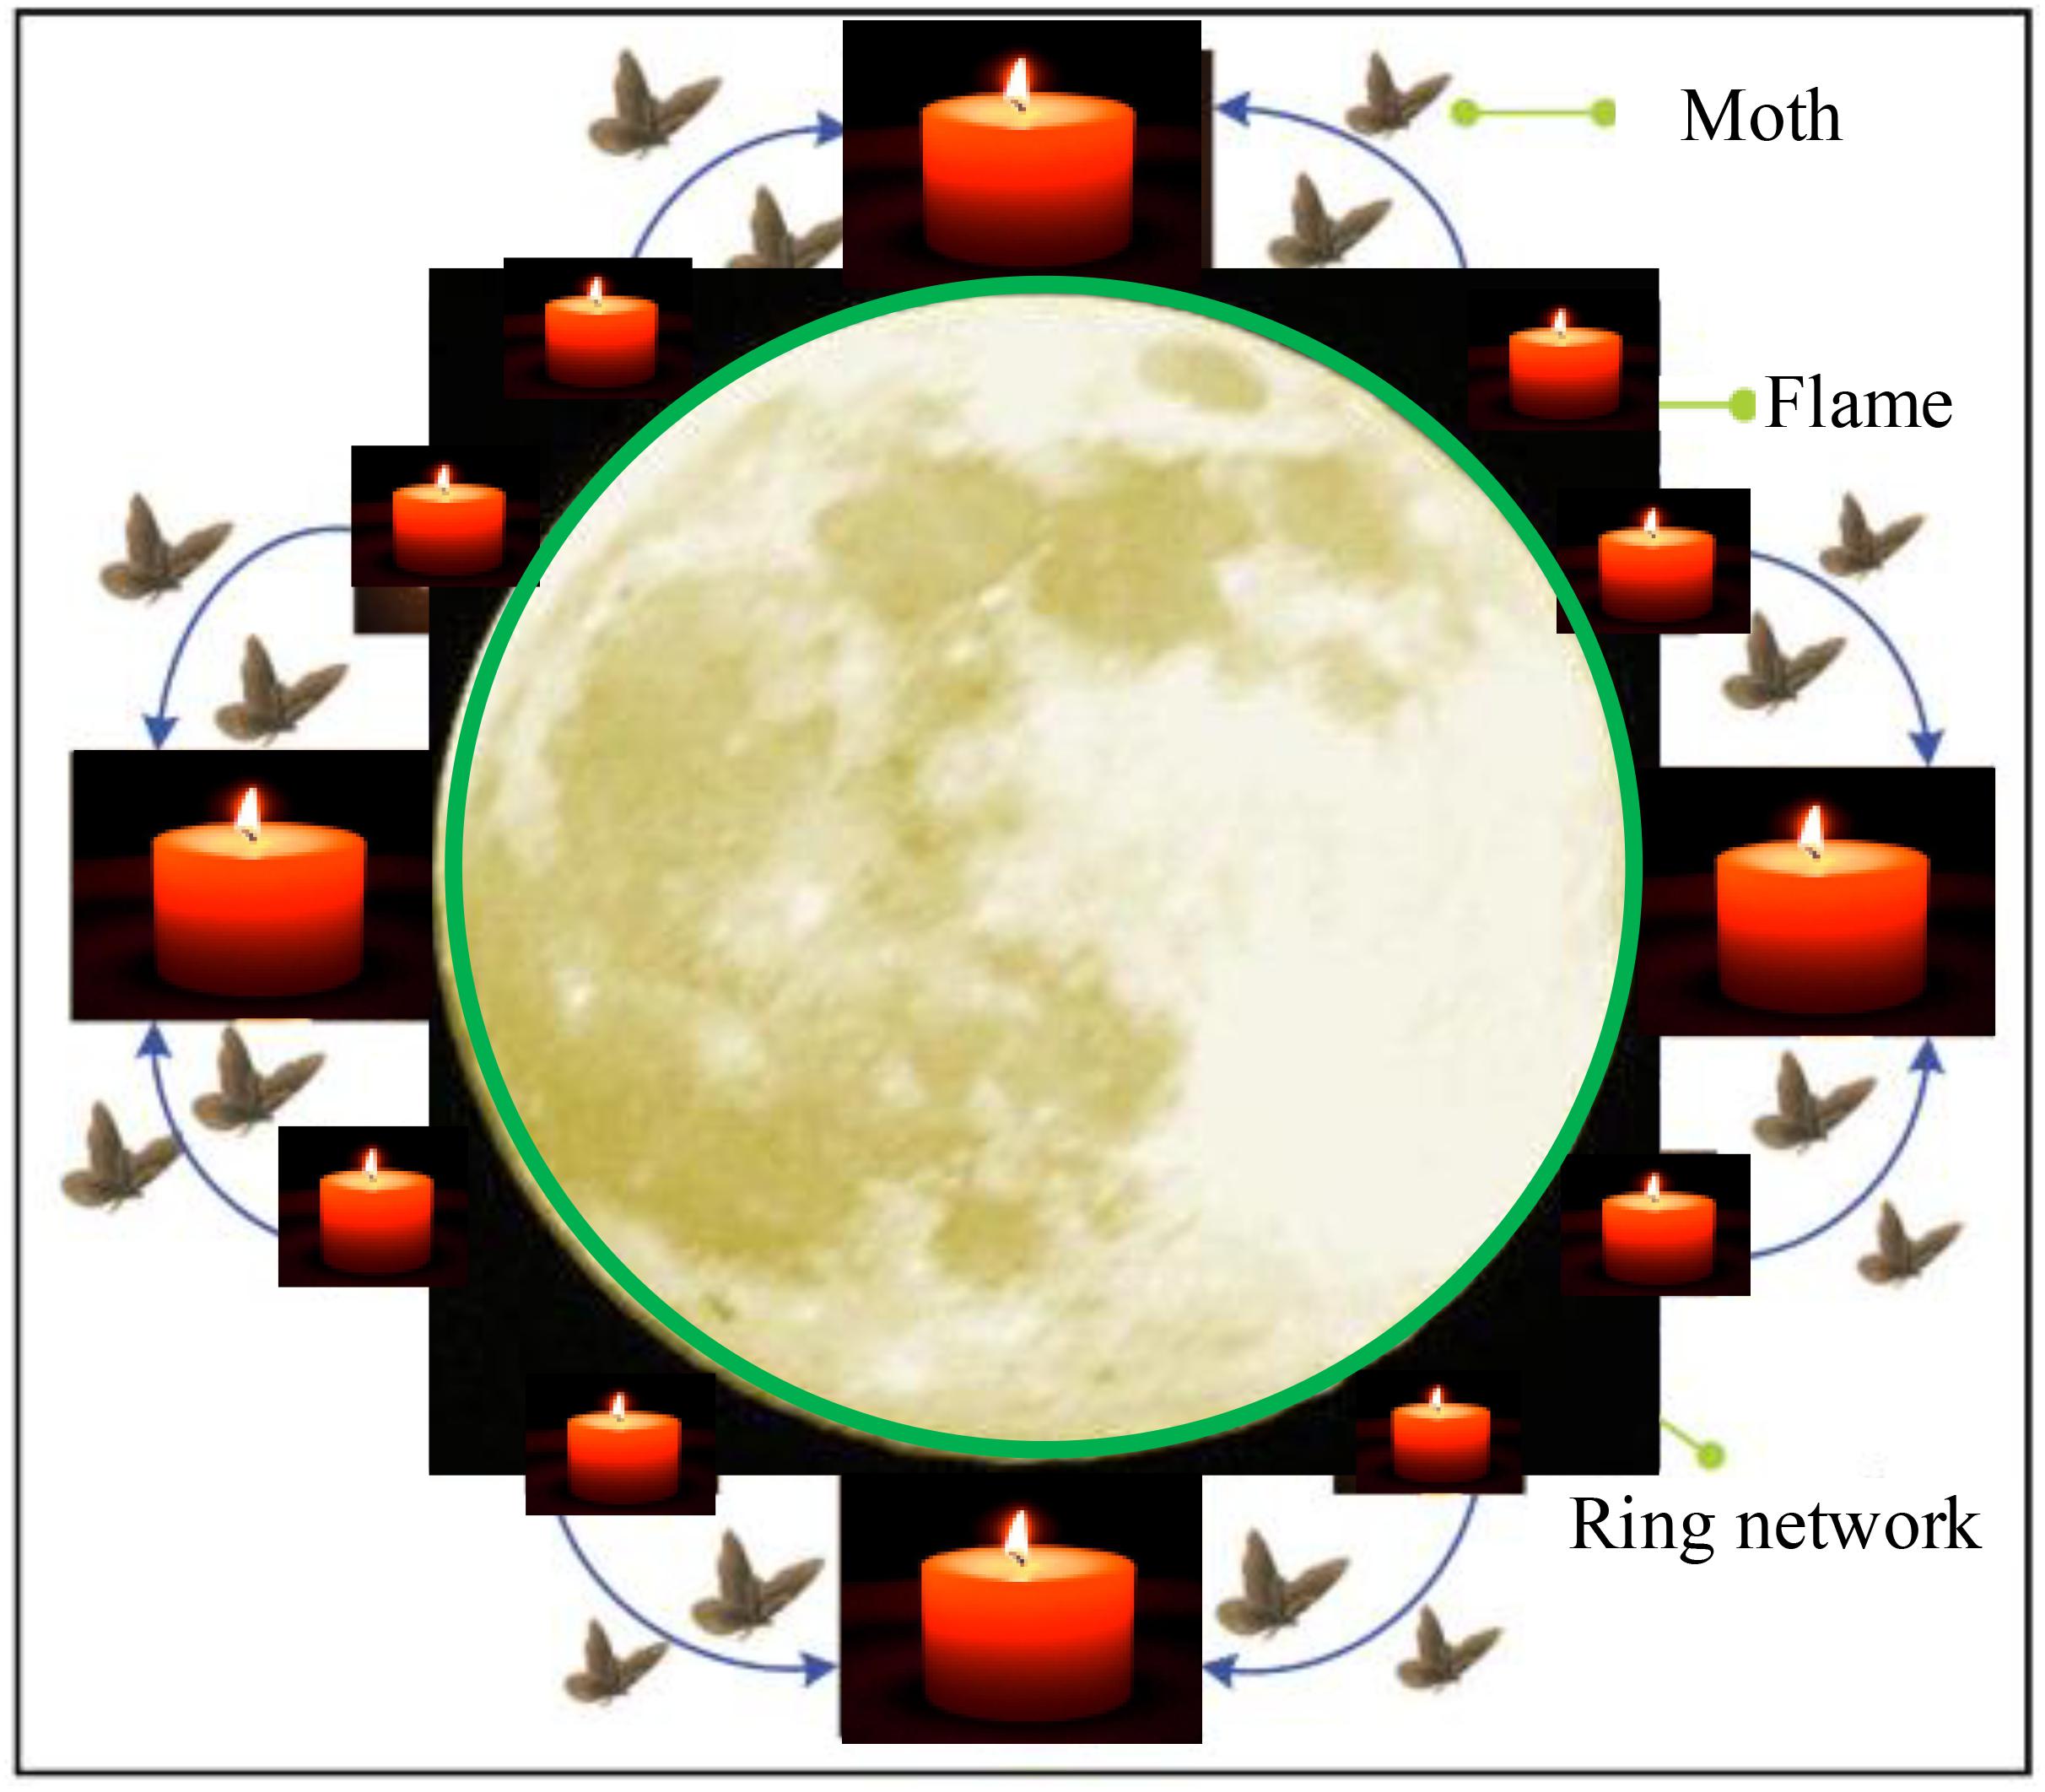
Figure 1. Conceptual model figure of transverse orientation.
A. Each flame is surrounded by multiple moths at the same time for greater utilization, and the flame with higher brightness (i.e., smaller fitness function) will attract more moths;
B. A ring network is constructed between the flames so that moths can be guided to look for brighter flames more effectively, which may lead to broader exploration, that is, there is a higher possibility to avoid local optima.
Mathematical Model
There are two important components in SMFO, namely moth and flame. Both essentially are the solution, the difference is that the moths in the main body of the actual search algorithms of spiral flight and the flame are moths to search the optimal position so far, so better to search in moths to a flame position, will mark the fire, and of the surrounding spiral movement. When a moth spirals around a flame, it needs to meet three conditions: the initial position of the flight is the current position of the moth, the terminal position of the flight is the position of the flame, and the spiral flight follows a logarithmic spiral curve.
The SMFO can be regarded as a triplet approximate to the global optimal in the optimization problem, which can be represented by the following formula (Abd El Aziz et al., 2017):
where I represent a function that randomly generates the position of the moth and its corresponding fitness value, and its description is shown in Equation (9). M represents the set of moth positions and OM represents the set of moth fitness values.
P represents the main function that the moth follows when flying in the search space. When the moth flies to a new position, it updates its own position and returns to M, which is described in Equation (10). In Equation (10), the updated position set of moths is represented by ∗M to distinguish them (Yıldız and Yıldız, 2017).
T is an end judge function that returns a Boolean value. When the return value is true, the algorithm stops running and prints the current global optimal value. When the return value is false, the function continues. Its description is shown in Equation (11):
Meta-heuristic algorithm is usually initialized by random generation of population, and SMFO is no exception. Suppose M is an M by n matrix, as shown in Equation (12). Where M represents the number of individual moths and N represents the number of variables (dimensions) in the optimization problem (Abd El Aziz et al., 2017).
Meanwhile, the array OM stores fitness values corresponding to individual moths, as shown in Equation (13). M is the number of moths.
The SMFO has another important component, the flame. It is also assumed that F is an m∗n matrix for storing the flame, as shown in Equation (14). Where M represents the number of individual moths and N represents the number of variables (dimensions) in the optimization problem.
Similarly, an array OF stores the fitness value corresponding to flame F, as shown in Equation (15).
Hence, the brightness of each flame may be calculated based on the normalization of their fitness functions, as follows:
where BF_i denotes the brightness of the ith flame, OF_i represents the fitness function of the ith flame.
In SMFO, a brighter flame (which has a smaller fitness function) will attract more moths than those of its adjacent flames via the ring network. The comparison of each flame’s brightness and movement of moths to a brighter flame usually leads to a continuous variation of population size of each moth swarm to achieve a wider exploration. However, the participation of too many flames for moth swarm attraction may result in a local optimum. Based on the above, the brightness of a flame is compared with that of only two adjacent flames in SMFO, and thus a proper trade-off between a wider exploration and deeper exploitation may be obtained through construction of a ring network among all flames. For the pth individual of the ith moth swarm, it will immigrate to its adjacent moth swarm, i.e., the (i−1) moth swarm or the (i+1) moth swarm, according to their brightness.
A moth will gradually approach to the corresponding flame with a logarithmic spiral, which may be calculated as (Abd El Aziz et al., 2017):
In the process of SMFO search, moths individual M_i is a phototropism, will lock the flame F_j the flight movement of conforms to logarithmic spiral function, began to the location of the screw flight behavior is moths the current position, end position is the position of the fire, at the same time in the process of flight moths can’t fly out of the specified area (the search space), description of the process is using a mathematical formula (Yıldız and Yıldız, 2017):
where M_i is the ith a moth individual, F_j is the jth flame. Dpi is the distance between the pth moth and the ith flame in the ith moth swarm. b is the spiral shape constant determining the shape of the logarithmic spiral, and distance coefficient r is a random number uniformly distributed in [−1, 1]. In addition, individual optimization track is shown in Figure 2.
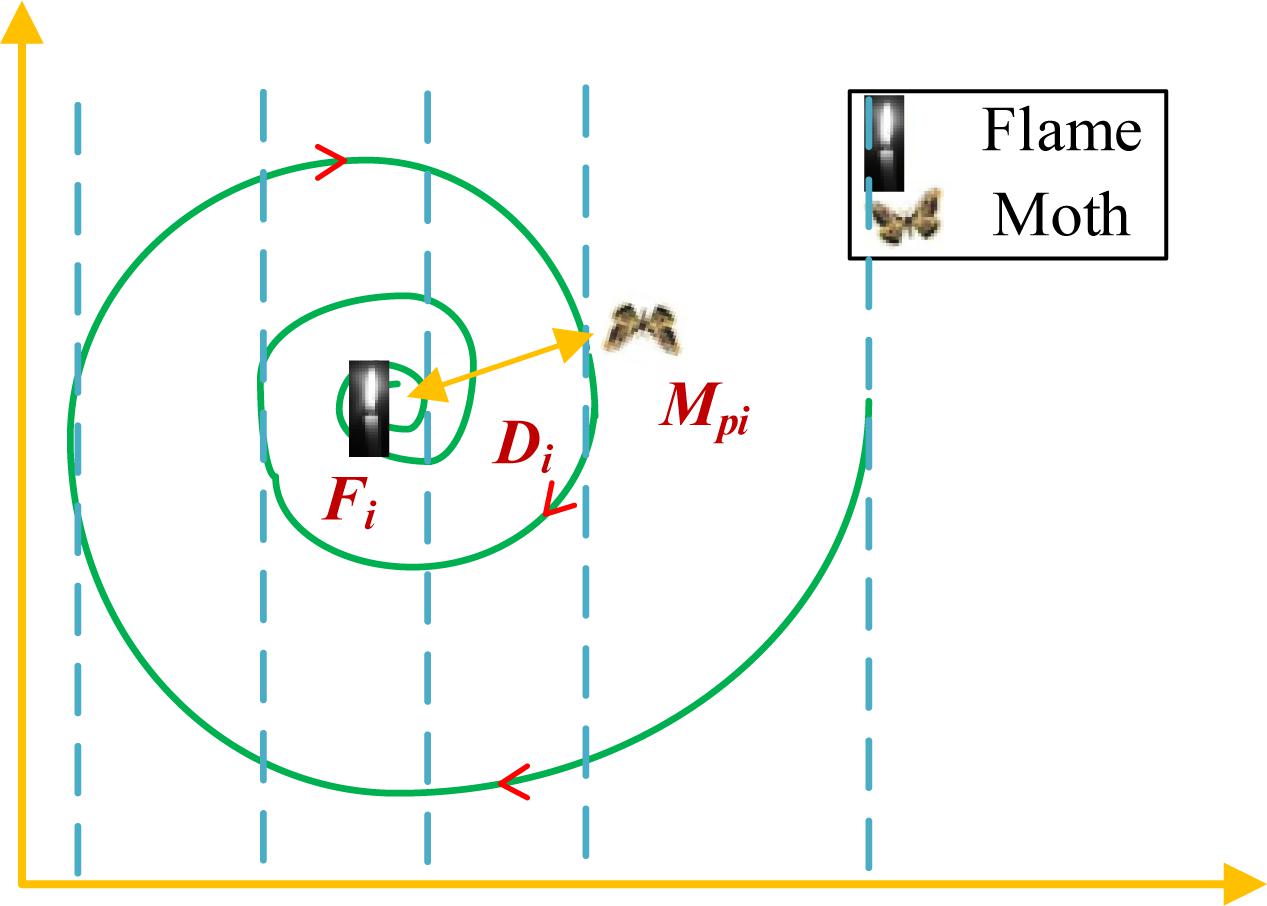
Figure 2. Individual optimization track.
Case Studies
In this paper, IEEE-33 bus is selected to verify the effectiveness of the algorithm, and the topology structure of the system is shown in Figure 3. The system consists of 32 branches. In addition, the system voltage UN = 12.66 kV, the base capacity Sb = 10 MW, the active load PΣ = 715 kW, the reactive load QΣ = 450 kVar. Proposed project: three types of DG are connected in IEEE-33 bus, that is photovoltaic (PV) station, wind turbine and micro turbine. In addition, GA is used in this paper for comparison. In order to make a fair comparison, the population size of the two algorithms is set as 50 and the maximum number of iterations is 80. And the proposed method was coded in MATLAB 2017b.
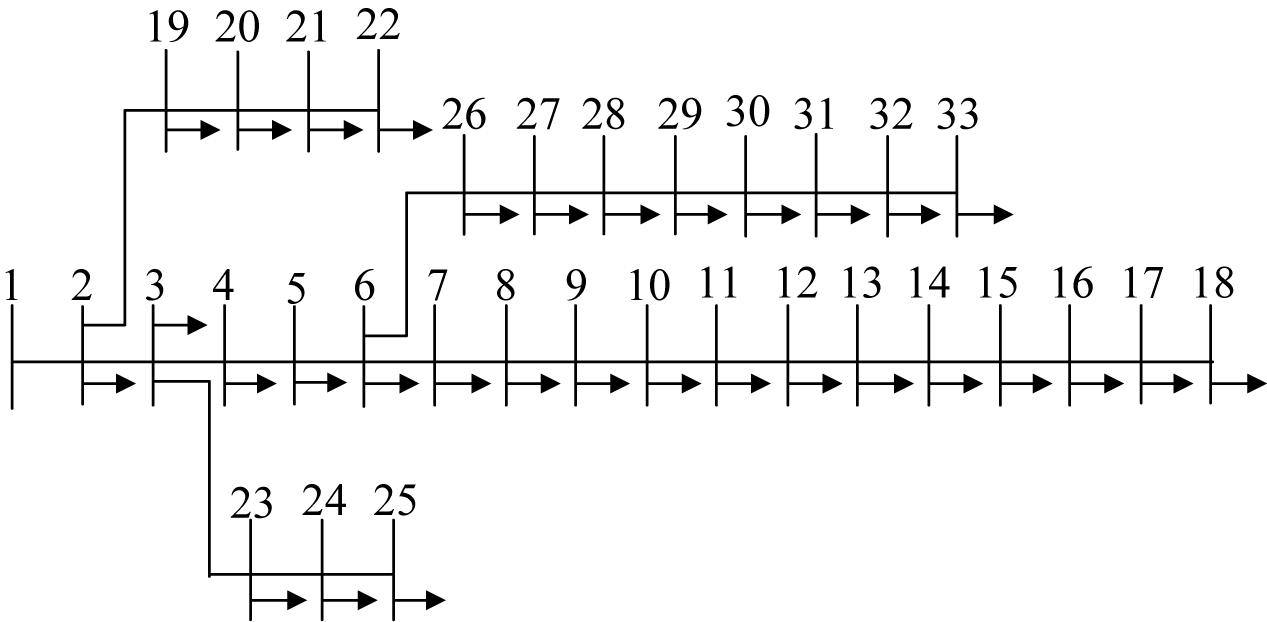
Figure 3. IEEE 33 bus test system.
Figure 4 shows the convergence curves of the four algorithms. It can be seen that SMFO has an excellent search mechanism and can converge to the minimum value with fewer iterations to avoid falling into the local optimum. Table 2 for both algorithms after 100 iterations run results, as you can see, after installing DG, can reduce the power losses of system to some extent, the obtained high economic benefits, among them, SMFO to obtain the total power consumption of the prior to the introduction of DG decreased by 58.63%, and obtain the total power consumption of the GA was down 36.63% from before the installation of DG, thus, SMFO has strong search result, better quality can be acquired in less number of iterations of the solution. In addition, Figure 5 shows the voltage profile curves of the two algorithms with and without DG installation, which effectively proves that DG has a significant optimization effect on improving the voltage profile of the distribution network, because DG is always installed near the load.
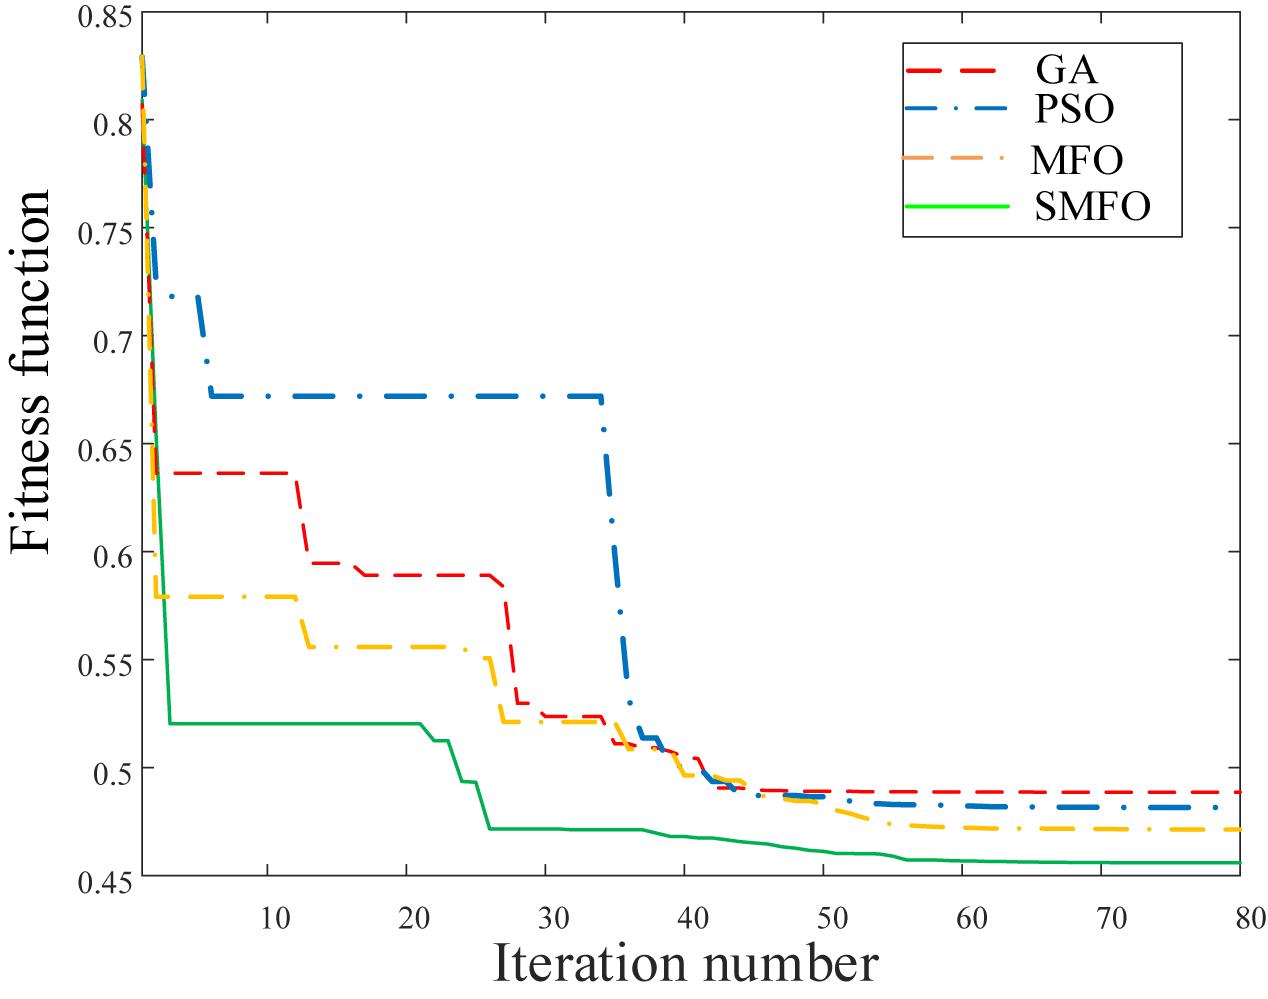
Figure 4. Convergence curves.
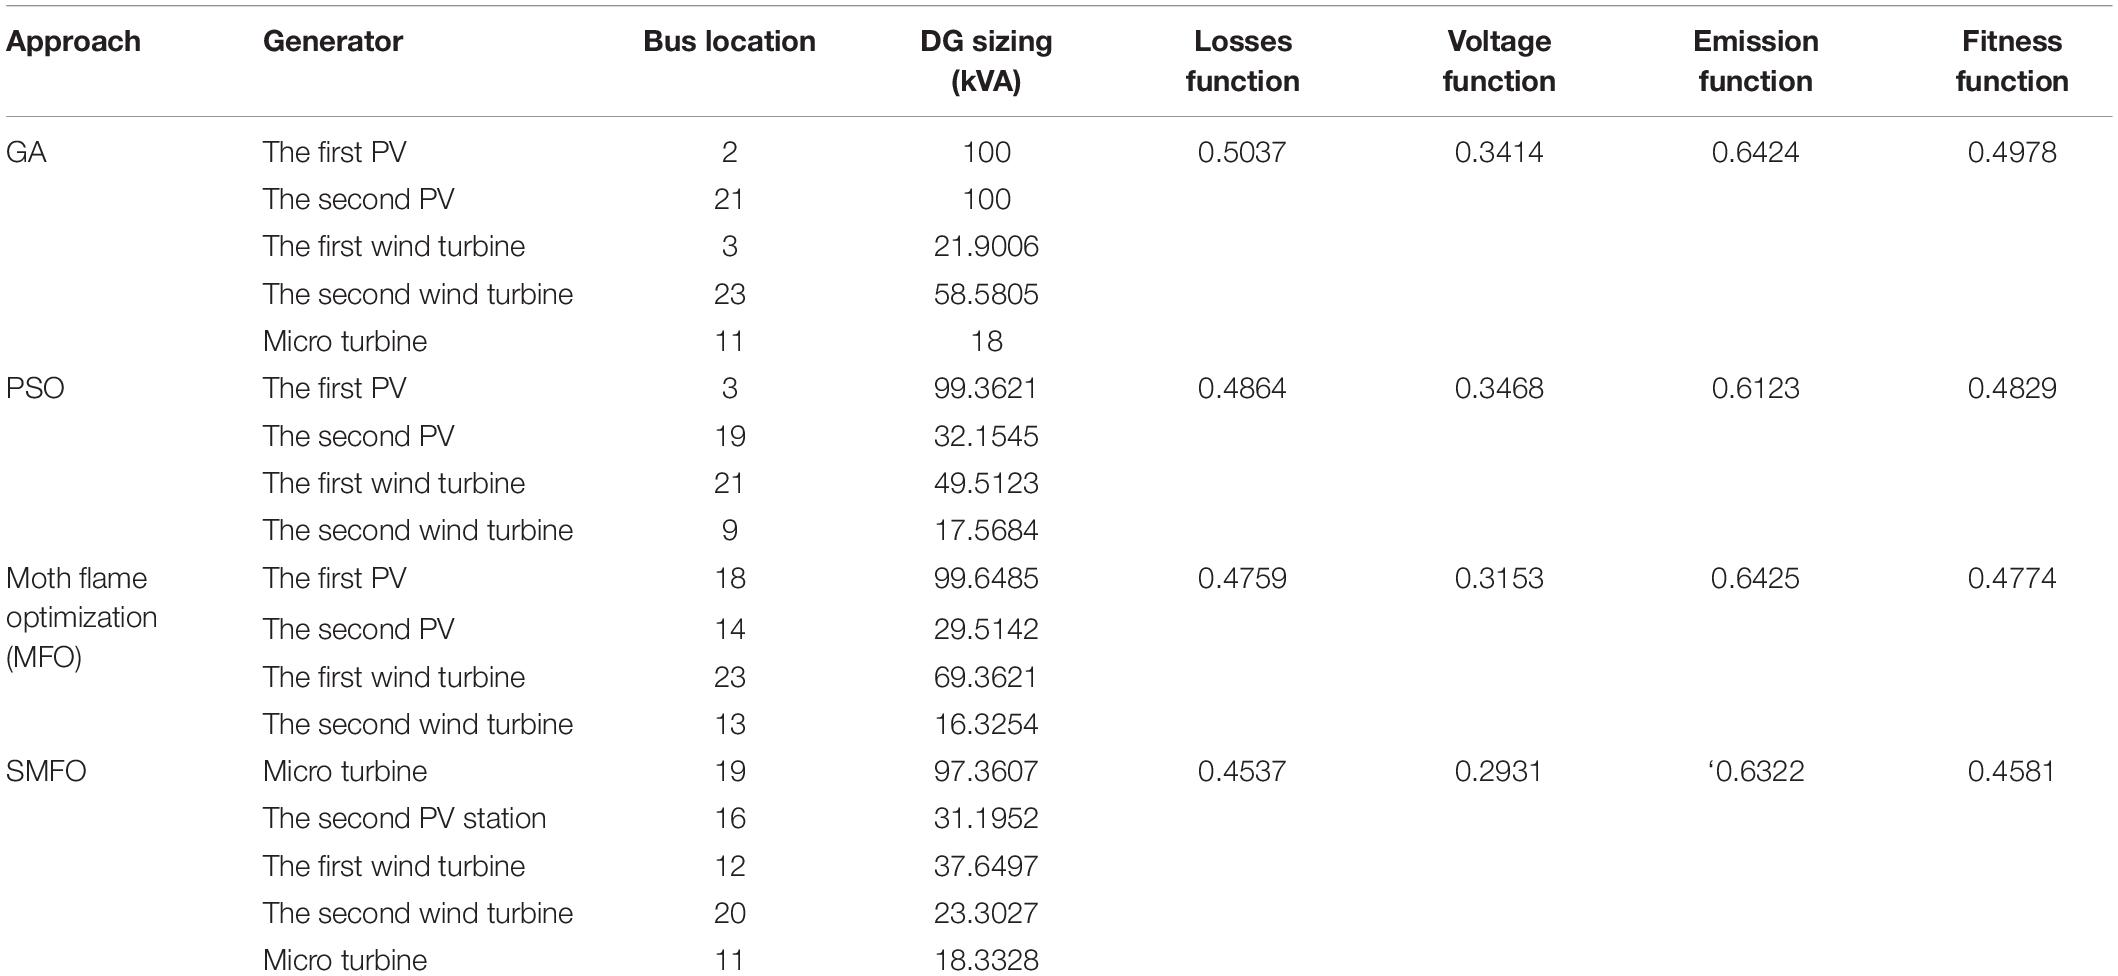
Table 2. Optimization results of two algorithms.
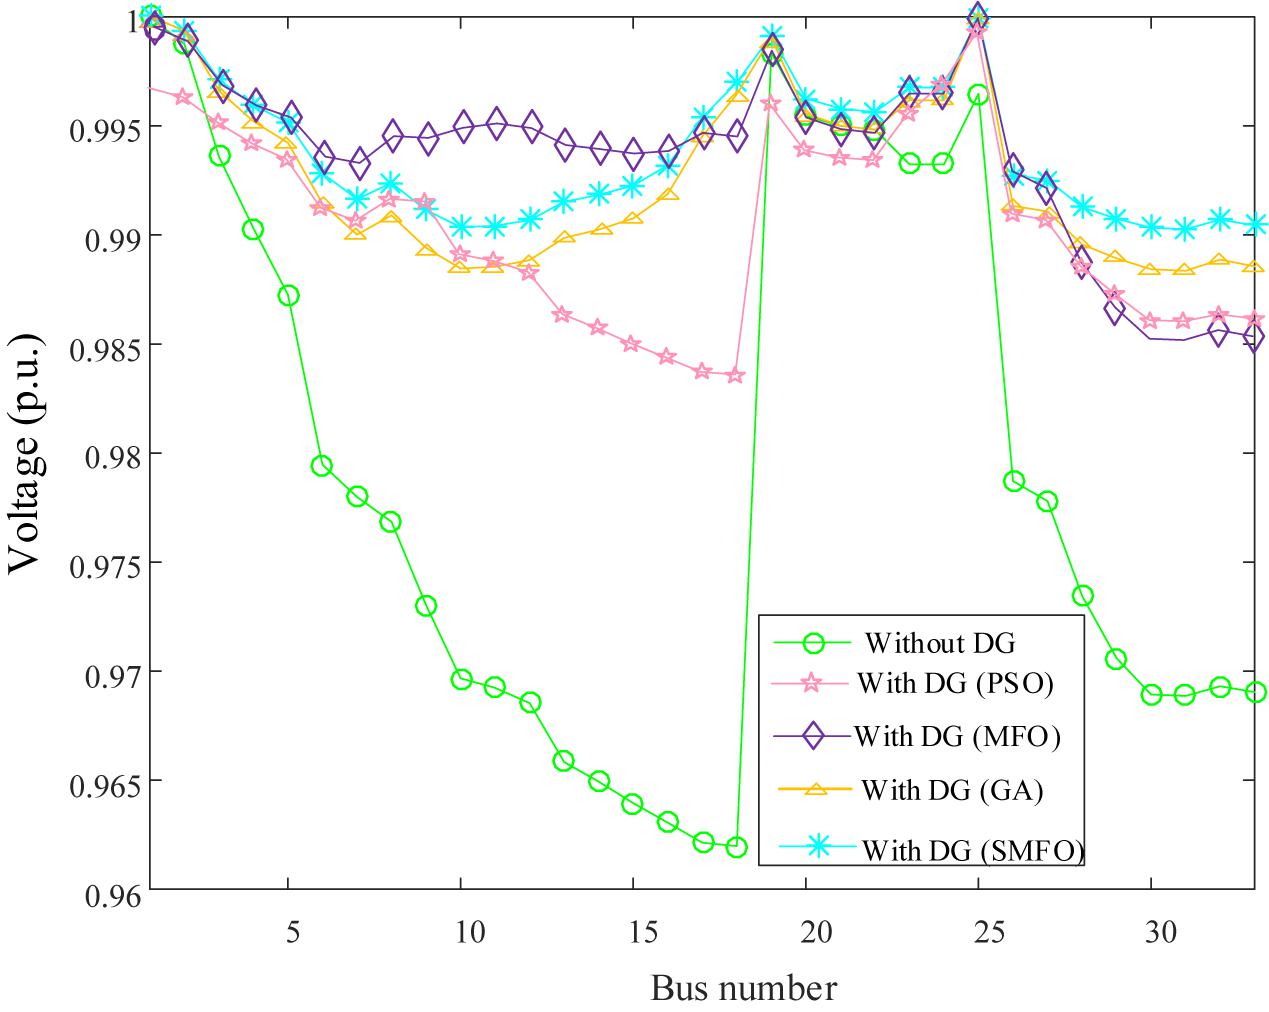
Figure 5. Voltage profile improvement of the IEEE 33-bus.
Conclusion
In this paper, SMFO is used to optimize the location and sizing of DG, and its contributions are as follows:
1. The objective function with three indexes of distribution network losses reduction index, voltage profile index and environmental emission reduction index is established to optimize the distribution network comprehensively;
2. Through IEEE-33 bus test, it is effectively verified that SMFO has a strong global search effect and convergence ability, and can avoid falling into local optimum under complex objective function;
3. After installing three types of DG, PV station, wind turbine and micro turbine, the connection of micro turbine can stabilize the instability of PV station and wind turbine. The results show that the power losses of the distribution network optimized by SMFO decreases by 50.37% and GA decreases by 45.37%, which effectively verifies the effectiveness of the algorithm. Besides, voltage profile is significantly improved.
In the future, a more advanced multi-objective decision making method will be used to solve this problem.
Data Availability Statement
The original contributions presented in the study are included in the article/supplementary material, further inquiries can be directed to the corresponding author/s.
Author Contributions
ZT: conceptualization, data curation, methodology, and writing—original draft. MZ: formal analysis, visualization, and resources. LS: writing—review and editing.
Funding
The authors gratefully acknowledge the project supported by Major Program of National Social Science Fund of China (19ZDA081).
Conflict of Interest
LS was employed by the company Guangzhou Shuimutech Co. ZT was employed by the Guizhou Power Grid Co., Ltd.
The remaining author declares that the research was conducted in the absence of any commercial or financial relationships that could be construed as a potential conflict of interest.
References
Abd El Aziz, M., Ewees, A. A., and Hassanien, A. E. (2017). Whale optimization algorithm and moth-flame optimization for multilevel thresholding image segmentation. Expert Syst. Appl. 83, 242–256. doi: 10.1016/j.eswa.2017.04.023
Abri, R. S. A., El-Saadany, E. F., and Atwa, Y. M. (2013). Optimal placement and sizing method to improve the voltage stability margin in a distribution system using distributed generation. IEEE Trans. Power Syst. 28, 326–334.
Acharya, N., Mahat, P., and Mithulananthan, N. (2016). An analytical approach for DG allocation in primary distribution network. Int. J. Electr. Power Energy Syst. 28, 669–678. doi: 10.1016/j.ijepes.2006.02.013
Afzalan, E., Taghikhani, M. A., and Sedighizadeh, M. (2012). Optimal placement and sizing of DG in radial distribution networks using SFLA. Int. J. Energy Eng. 2, 73–77. doi: 10.5923/j.ijee.20120203.03
Ameli, A., Bahrami, S., Khazaeli, F., and Haghifam, M. R. (2014). A multiobjective particle swarm optimization for sizing and placement of dgs from dg owner’s and distribution company’s viewpoints. IEEE Trans. Power Deliv. 29, 1831–1840. doi: 10.1109/tpwrd.2014.2300845
Calderaro, V., Conio, G., Galdi, V., Massa, G., and Piccolo, A. (2014). Optimal decentralized voltage control for distribution systems with inverter-based distributed generators. IEEE Trans. Power Syst. 29, 230–241. doi: 10.1109/tpwrs.2013.2280276
Das, B., Mukherjee, V., and Das, D. (2016). DG placement in radial distribution network by symbiotic organisms search algorithm for real power loss minimization. Appl. Soft Comput. 49, 920–936. doi: 10.1016/j.asoc.2016.09.015
Devi, A. L., and Subramanyam, B. (2007). Optimal DG unit placement for loss reduction in radial distribution system-a case study. ARPN J. Eng. Appl. Sci. 2, 57–61.
El-Fergany, A. (2015). Study impact of various load models on DG placement and sizing using backtracking search algorithm. Appl. Soft Comput. 30, 803–811. doi: 10.1016/j.asoc.2015.02.028
El-Zonkoly, A. M. (2011). Optimal placement of multi-distributed generation units including different load models using particle swarm optimisation. IET Gener. Transm. Distrib. 5, 760–771. doi: 10.1049/iet-gtd.2010.0676
Gandomkar, M., Vakilian, M., and Ehsan, M. J. E. P. C. (2005). A genetic–based tabu search algorithm for optimal DG allocation in distribution networks. Electr. Power Compon. Syst. 33, 1351–1362. doi: 10.1080/15325000590964254
Gayme, D., and Topcu, U. (2013). Optimal power flow with large-scale storage integration. IEEE Trans. Power Syst. 28, 709–717.
Hamida, I. B., Salah, S. B., Msahli, F., and Mimouni, M. F. (2018). Optimal network reconfiguration and renewable DG integration considering time sequence variation in load and DGs. Renew. Energy. 121, 66–80. doi: 10.1016/j.renene.2017.12.106
He, X., Chu, L., Qiu, R. C., Ai, Q., Ling, Z., and Zhang, J. (2020). Invisible units detection and estimation based on random matrix theory. IEEE Trans. Power Syst. 35, 1846–1855. doi: 10.1109/tpwrs.2019.2935739
Hedayati, H., Nabaviniaki, S. A., and Akbarimajd, A. A. (2008). Method for Placement of DG units in distribution networks. IEEE Trans. Power Deliv. 23, 1620–1628. doi: 10.1109/tpwrd.2007.916106
Home-Ortiz, J. M., Pourakbari-Kasmaei, M., Lehtonen, M., and Mantovani, J. R. S. (2019). Optimal location-allocation of storage devices and renewable-based DG in distribution systems. Electr. Power Syst. Res. 172, 11–21.
Hung, D. Q., Mithulananthan, N., and Bansal, R. C. (2010). Analytical expressions for DG allocation in primary distribution networks. IEEE Trans. Energy Convers. 25, 814–820. doi: 10.1109/tec.2010.2044414
Iqbal, F., Khan, M. T., and Siddiqui, A. S. (2017). Optimal placement of DG and DSTATCOM for loss reduction and voltage profile improvement. Alex. Eng. J. 57, 755–765. doi: 10.1016/j.aej.2017.03.002
Kansal, S., Kumar, V., and Tyagi, B. (2013). Optimal placement of different type of DG sources in distribution networks. Int. J. Electr. Power Energy Syst. 53, 752–760. doi: 10.1016/j.ijepes.2013.05.040
Kaur, S., Kumbhar, G., and Sharma, J. (2014). A MINLP technique for optimal placement of multiple DG units in distribution systems. Int. J. Electr. Power Energy Syst. 63, 609–617. doi: 10.1016/j.ijepes.2014.06.023
Lin, Y., and Bie, Z. (2018). Tri-level optimal hardening plan for a resilient distribution system considering reconfiguration and DG islanding. Appl. Energy 210, 1266–1279. doi: 10.1016/j.apenergy.2017.06.059
Liu, J., Yao, W., Wen, J. Y., Fang, J. K., Jiang, L., He, H. B., et al. (2020). Impact of power grid strength and PLL parameters on stability of grid-connected DFIG wind farm. IEEE Trans. Sustain. Energy 11, 545–557. doi: 10.1109/tste.2019.2897596
Lund, H. (2006). Large-scale integration of optimal combinations of PV, wind and wave power into the electricity supply. Renew. Energy 31, 503–515. doi: 10.1016/j.renene.2005.04.008
Meena, N. K., Swarnkar, A., Gupta, N., and Niazi, K. R. (2017). Multi-objective Taguchi approach for optimal DG integration in distribution systems. IET Gener. Transm. Distrib. 11, 2418–2428. doi: 10.1049/iet-gtd.2016.2126
Mehleri, E. D., Sarimveis, H., Markatos, N. C., and Papageorgiou, L. G. (2012). A mathematical programming approach for optimal design of distributed energy systems at the neighbourhood level. Energy 44, 96–104. doi: 10.1016/j.energy.2012.02.009
Mirjalili, S. (2015). Moth-flame optimization algorithm: a novel nature-inspired heuristic paradigm. Knowl. Based Syst. 89, 228–249. doi: 10.1016/j.knosys.2015.07.006
Mitra, S., Sun, L., and Grossmann, I. E. (2013). Optimal scheduling of industrial combined heat and power plants under time-sensitive electricity prices. Energy 54, 194–211. doi: 10.1016/j.energy.2013.02.030
Moradi, M. H., and Abedini, M. (2016). A novel method for optimal DG units capacity and location in microgrids. Int. J. Electr. Power Energy Syst. 75, 236–244. doi: 10.1016/j.ijepes.2015.09.013
Murty, V. V., and Kumar, A. (2015). Optimal placement of DG in radial distribution systems based on new voltage stability index under load growth. Int. J. Electr. Power Energy Syst. 69, 246–256. doi: 10.1016/j.ijepes.2014.12.080
Naik, S. G., Khatod, D. K., and Sharma, M. P. (2013). Optimal allocation of combined DG and capacitor for real power loss minimization in distribution networks. Int. J. Electr. Power Energy Syst. 53, 967–973. doi: 10.1016/j.ijepes.2013.06.008
Ogunjuyigbe, A. S. O., Ayodele, T. R., and Akinola, O. A. (2016). Optimal allocation and sizing of PV/wind/split-diesel/battery hybrid energy system for minimizing life cycle cost, carbon emission and dump energy of remote residential building. Appl. Energy 171, 153–171. doi: 10.1016/j.apenergy.2016.03.051
Paterakis, N. G., Erdinc, O., Bakirtzis, A. G., and Catalao, J. P. S. (2015). Optimal household appliances scheduling under day-ahead pricing and load-shaping demand response strategies. IEEE Trans. Industr. Inform. 11, 1509–1519. doi: 10.1109/tii.2015.2438534
Poornazaryan, B., Karimyan, P., Gharehpetian, G. B., and Abedi, M. (2016). Optimal allocation and sizing of DG units considering voltage stability, losses and load variations. Int. J. Electr. Power Energy Syst. 79, 42–52. doi: 10.1016/j.ijepes.2015.12.034
Song, D. R., Fan, X. Y., Yang, J., Liu, A. F., Chen, S. F., and Joo, H. Y. (2018). Power extraction efficiency optimization of horizontal-axis wind turbines through optimizing control parameters of yaw control systems using an intelligent method. Appl. Energy 224, 267–279. doi: 10.1016/j.apenergy.2018.04.114
Song, D. R., Zheng, S. Y., Yang, S., Yang, J., Dong, M., Su, M., et al. (2020). Annual energy production estimation for variable-speed wind turbine at high-altitude site. J. Mod. Power Syst. Clean Energy doi: 10.35833/MPCE.2019.000240
Varesi, K. (2011). Optimal allocation of dg units for power loss reduction and voltage profile improvement of distribution networks using PSO algorithm. World Acad. Sci. Eng. Technol. 60, 1938–1942.
Wang, Z., Chen, B., Wang, J., Kim, J., and Begovic, M. M. (2014). Robust optimization based optimal DG placement in microgrids. IEEE Trans. Smart Grid 5, 2173–2182. doi: 10.1109/tsg.2014.2321748
Yıldız, B. S., and Yıldız, A. R. (2017). Moth-flame optimization algorithm to determine optimal machining parameters in manufacturing processes. Mater. Test. 59, 425–429. doi: 10.3139/120.111024
Zhu, D., Broadwater, R. P., Tam, K.-S., Seguin, R., and Asgeirsson, H. (2006). Impact of DG placement on reliability and efficiency with time-varying loads. IEEE Trans. Power Syst. 21, 419–427. doi: 10.1109/tpwrs.2005.860943
Nomenclature
| EP | power losses reduction index |
| PPloss | active power losses before installing DG |
| PDGloss | active power losses after installing DG |
| R_l | resistance on the lth line |
| I_l | current on the lth line |
| EE | environmental emission reduction index |
| EV | voltage profile index |
| VPi | voltage of the ith node before installing DG |
| V_N | rated voltage |
| PGi | active power output at ith bus |
| QGi | reactive power output at ith bus |
| PiDGmin | minimum sizing of DG |
| PiDG | active power sent to the power grid by DG connected to the ith bus |
| BF_i | brightness of the ith flame |
| PiDGmax | maximum sizing of DG |
| OF_i | fitness function of the ith flame |
| M_i | the ith a moth individual |
| F_j | the jth flame. |
Keywords: DG, optimal placement and sizing, renewable energy, IEEE 33 bus, SMFO
Citation: Tan Z, Zeng M and Sun L (2021) Optimal Placement and Sizing of Distributed Generators Based on Swarm Moth Flame Optimization. Front. Energy Res. 9:676305. doi: 10.3389/fenrg.2021.676305
Received: 05 March 2021; Accepted: 22 March 2021;
Published: 15 April 2021.
Edited by:
Yaxing Ren, University of Warwick, United KingdomReviewed by:
Jiawen Li, South China University of Technology, ChinaYixuan Chen, The University of Hong Kong, Hong Kong
Kai Shi, University of Warwick, United Kingdom
Copyright © 2021 Tan, Zeng and Sun. This is an open-access article distributed under the terms of the Creative Commons Attribution License (CC BY). The use, distribution or reproduction in other forums is permitted, provided the original author(s) and the copyright owner(s) are credited and that the original publication in this journal is cited, in accordance with accepted academic practice. No use, distribution or reproduction is permitted which does not comply with these terms.
*Correspondence: Liming Sun, ODkyNDQ3ODVAcXEuY29t