 Surasit Sangob1,2
 Somporn Sirisumrannukul1*
- 1Department of Electrical and Computer Engineering, Faculty of Engineering, King Mongkut’s University of Technology North Bangkok, Bangkok, Thailand
- 2Power System Control Department, Metropolitan Electricity Authority (MEA), Bangkok, Thailand
There has been a growing presence of electric vehicles in many countries including Thailand, where many forms of incentives have been provided to build integrated infrastructure, and to encourage drivers to switch to electric vehicles (EVs). Because the immediate entry of EVs unavoidably can alter household load profiles, reinforcement on the existing system based on traditional planning may not be sufficient and can introduce over or under capital and operating expenditure over the time horizon. Therefore, if distribution systems are unreadily prepared for such an uptake, three obvious problems can be expected: 1) voltage regulation, 2) overloads of the distribution feeders and the distribution transformers, and 3) high energy loss. In this paper, an activity-based, time-sequential Monte Carlo Simulation algorithm was comprehensively developed for uncontrollable and smart charging, given annually updated information of EV locations and number of EVs, their energy consumption, hourly average vehicle speed, number of daily trips, travel distance per trip, size of EV batteries, time to arrive home and time to leave home. Minimizing the annual sum of investment and operating costs over a planning period could then be sequentially solved by a Particle Swarm Optimization (PSO) algorithm. The results from a practical 122-bus, 24 kV/400 V distribution system with different scenarios of uncontrollable and smart charging show that the sequential optimization embedded with deterministic decision can help improve customer voltage profile, keep feeder and transformer loading within acceptable operating limits and offer significant cost savings from energy loss. As far as a large number of low-voltage networks, and the associated large sum of cost savings are concerned, the proposed planning framework is practical to be applied and expected to be served as a new guideline for future implementation in Thailand.
Introduction
Many countries around the world have been implemented numerous financial and nonfinancial policies to promote widespread adoption of electric vehicles (EVs) and sets strict rules for auto manufacturers to support clean technology into the market (Al-Alawi and Bradley, 2013). The rapid growth of the use of EVs is mainly driven by rising gas prices, environmental pollution, and fossil fuel exhaustion. Because the main source of EVs is rechargeable batteries, urgent development of many peripherals and supporting technology for EVs has been made (Tie and Tan, 2013). The main benefits of the link between electricity and transportation sectors through EVs include, for example, more efficient use of power plants and power grid infrastructure, less dependence on fossil fuels, carbon footprint reduction, and energy efficiency enhancement.
In Thailand, electric cars are receiving a lot of attention from public, private and public sectors. An EV policy was first introduced in 2016 (EPPO, 2016) and only state agencies began small-scale projects such as prototype charging outlets and EV facility management platforms. The government has established the National Electric Vehicle Policy Committee (NEVPC) to better drive the policy forward. In March 2020, the NEVPC announced an EV roadmap to help the domestic car industry manufacture 1.2 million units in 10 years. Among recent developments is a move by the Energy Regulatory Commission (ERC) to apply more appropriate charging rates for EVs. Other state agencies including Electricity Generating Authority of Thailand (EGAT), Metropolitan Electricity Authority (MEA) and Provincial Electricity Authority (PEA) have been active in the development of electric ferries, buses, motorcycles, three-wheeled vehicles and electric charging stations. A proposal to impose a higher excise tax on oil-powered vehicles as part of efforts to promote EVs and reduce air pollution has been under discussion and review (Bangkok Post, 2020).
Although EVs has introduced many advantages to the economy and society, they are mainly composed of batteries and need recharging. They can be treated like conventional electrical loads, but the power system can be terribly affected by their high-power consumption due to the tendency of drivers to charge at the time when the electricity grid already has high loads (Moon and Kim, 2017). Because residential loads supplied by a distribution transformer do not generally change much over time, conventional planning criteria with some reserve margin on the transformer can sufficiently accommodate future increasing use of household appliances. For an existing low-voltage network delivered by a distribution transformer, customers are supplied in a radial scheme and therefore a sudden increase in EVs can contribute negative effects on the system. Obvious examples are voltage drop, and transformer and feeder overload when the grid with high loads is connected to uncontrolled EV charging loads (Apostolaki-Iosifidou et al., 2019).
High penetration of EVs accelerates the need for system investment in capacity expansion and network reinforcement to support the infrastructure of EV applications and therefore directly affects utilities’ investment and operational costs. The main question for this issue to be addressed is when and how the low-voltage network should be reinforced in a systematic, optimal manner. Conventional planning in electric distribution systems may not be practical enough because increased loads from EVs are random in nature. That is, it is quite difficult to predict the number of EVs and their corresponding locations that would enter the system each year. Consequently, such a traditional layout that has been used by electric power utilities may lead to overinvestment for an underestimated number of EVs or underinvestment for an overestimated number of EVs.
The main contribution of this paper is dedicated to optimal planning of low-voltage distribution, where EV loads as part of residential energy consumption are located. The proposed planning model involves two main stages: load forecast and resource optimization to meet the load forecast while respecting network operational constraints. In the load forecast model, the reinforcement of existing low-voltage network to accommodate the increased EV loads can be efficiently achieved by yearly sequential decision making, given annually updated information of the EV locations and the amount of the loads to be served by the system. Two EV charging consumption models are comprehensively developed using Monte Carlo Simulation: uncontrollable charging (also known as dump charging) and smart charging. Load curves can be generated, given probability distribution functions obtained from car user surveys, and reports from local and international agencies. The amounts of loads for these two charging schemes will be later combined with the household loads of conventional appliances to form the final load profiles.
The parameters required in the load simulation include number of daily trips, distance per trip, sizes of battery, average car velocity, arrival time at home, and departure time from home. The mechanism of uncontrollable charging assumes that car owner recharges their EVs as soon as they have arrived home. With the help of modern sensors and actuators and communications links, smart charging mechanism with direct load control become feasible. The algorithm of smart charging is based on the concept given in (Quiros-Tortos et al., 2018) for My Electricity Avenue (MEA) project in the United Kingdom (UK). The EV management solution for smart charging uses the EV charging time as a proxy of the unknown State of Charge (SoC) to determine the most suitable EVs that should be disconnected when the system is stressed and reconnected when the system is healthy. The concept of “First Out and First In” has been introduced, indicating that disconnections occur first on customers with higher charging times because it is assumed that their EVs have reached a higher SoC. Reconnections, on the other hand, occur first on EVs that have been disconnected for longer times (e.g., those who disconnected first will be reconnected first). Note, however, that whenever there are newcomers in any time slots (e.g., half hour), who have never been charged before, they will be prioritized over those ready for reconnection regardless of how long they have been waiting for.
The resource optimization model minimizes the yearly total cost arising from equipment, installation and demolition costs, and the cost of energy loss over a planning horizon. The model is formulated as a nonlinear combinatorial optimization problem, where decision variables are the sizes and the locations of distribution and capacitors, subject to constraints on power balance of three phase unbalanced network, bus voltage limits, and thermal loading of distribution transformers and feeders. This combinatorial optimization problem can be efficiently solved by Particle Swarm Optimization (PSO). The obtained solution to this problem can chronologically upgrade the system by indicating when, where and what size distribution transformers should be added, and capacitors should be added/replaced over the planning period. The proposed method was tested on a practical 122 bus, 24 kV/400 V distribution system with analysis and discussion.
The remainder of the paper is organized as follows. Related Work reviews the details of EV load modeling, EV charging strategies, distribution system planning, and evolutionary algorithms. Electric Vehicle Model provides the data sources and the procedure used for the proposed EV load model. In Problem Description, the objective function and the constraints are formulated. This section also explains the framework of a three-phase unbalanced power flow model. In Proposed Sequential Optimization, the proposed optimization procedure is presented. Case Study details the test system. Results and Discussion for the test system are given, looking first at EV load profile simulations, and then considering low-voltage distribution planning. Conclusion summarizes the main contribution of the paper.
Related Works
EV Load Modeling
A variety of methods for EV load modeling have been proposed, and because the use of EV loads is random in nature, probabilistic models have been deemed the most suitable way to capture their uncertainty. Two groups of models can be derived: analytical techniques and stochastic simulation. The former represents the system by mathematical models, which are often simplified for complex systems, and evaluate the parameters of interest using mathematical solutions. The latter mimics the random behavior of a real system and estimates the parameters of interest by a series of experiments (Billinton and Allan, 1992).
A comprehensive collection of primary and secondary data for EV usage patterns was reported (Shi Y. et al., 2020). Three main groups of data set were graphically represented: traveling characteristics, charging characteristics, and electricity consumption. The data in the first group included, for example, single-trip distance daily distance traveled, duration per trip, number of trips per day, travel start time, and travel speed in the morning and evening rush hour. Weekly charging frequency, and charging start time were in the second group. The last one contained electricity consumption such as charging duration, travel distance since last charge, battery state of charge before/after travelling.
The charging patterns of four types of EV were investigated (Shi Z. et al., 2020): bus, state-financed vehicle taxi private vehicle. Four random parameters were used in Monte Carlo Simulation to generate load profiles: initial charging time, charging duration, daily charging frequency, and initial state of charge. The simulation results revealed that it was likely that the peak demand from EVs would coincide with that of the system. Because personal vehicles accounting for about 80% contributed to the system demand, coordinated charging would be necessary in the future for the system operator to maintain system reliability and stability.
The article by (Crozier et al., 2021) sought to detect diversity more accurately in individual consumer behavior for a better and more accurate estimates of charging loads. The model combines readily available travel survey data with high-resolution data from an EV trial, using clustering and conditional probabilities. It was shown that peak demand could be 50% overestimated compared to existing methods, indicating reinforcements in the distribution system could be deferred. The result emphasized the importance of using locally representative vehicle usage data but doing so came with a cost of collection.
To be specific, some rules for EV charging were established with stochastic parameters. The most common parameters are the initial and final charging times. Additional conditions may also be considered; for example, charging will occur as soon as EVs reach homes, offices or destinations. In addition, there can be more complex conditions, such as the amount of remaining energy enough for the journey or the shortest distance to the nearest charging location.
EV Charging Strategies
Although there have been numerous academic documents on EV charging strategies with different techniques, the purpose of those works was to minimize the effects of increased loads from EVs. For example, smart charging was introduced by (Crozier et al., 2020) to mitigate the impact of EVs on transmission and distribution systems using a conditional probability-based method to model uncontrolled charging demand, and convex optimization to model smart charging. Test results with Great Britain’s power system highlighted the importance of smart charging strategies that could eliminate the need for additional generation infrastructure even with 100% EV adoption. Without smart charging, the existing distribution networks would have required a 28% upgrade for uncontrollable charging compared to only 9% for smart charging.
Two different management strategies were suggested in (Solanke et al., 2020) for load management to mitigate the impact of EVs and renewable energy integration: decentralized and centralized charging. The former was simpler and more straightforward for reducing variability and stability issues but requires the accuracy of the EV travel pattern. The latter, although more complex in computation and less customer-stratified, reduces load variance, voltage variations and power losses. It was found that centralized coordination was more compelling in solving EV integration issues and renewables could help improve the hosting capacity of EVs and reduce power losses.
Several controlled charging–discharging techniques were thoroughly discussed in detail in (Borray et al., 2021), classified as a controlled charge–discharge method, intelligent charging–discharging method, bi-directional charge–discharge method, and multistage hierarchical controlled charge–discharge method. The performance for each method was dictated by the system performance described in forms of overloading, deteriorating power quality and power loss. Among these methods. multistage hierarchical controlled charging–discharging outperformed the others and could be applied to future V2G integration, which could help to avoid excessive charging costs, improve power quality, and enhance the power factor.
Day-ahead EV scheduling in low voltage networks was another form of controllable charging for cost minimization subject to a linearized power flow constraint (Hussain et al., 2021). Mobility behaviors such as daily trip distances, arrival and departure times were considered and represented by probability distributions. These stochastic parameters were used to hedge risks against the cost of charging, network overloading, voltage violation, and charging reliability. A test on an LV network stressed the impact of uncertainty addressing aspects of risk throughout optimization process. To be specific, coming up with a lot of conservative estimates of initial battery charge levels would increase the reliability and technical feasibility of optimized schedules.
A Linear Programming (LP)-based optimization method for a decentralized charging was described in (Sun et al., 2020). A combination of photovoltaic and EV batteries was served as an extra resource for voltage regulation. A bilevel optimization was formulated, subject to a constraint on an energy balance of connected EVs. A new energy-bound model was proposed, in which the optimization process aimed to maximize power delivered to all EVs for a given period while minimizing their charging rate. The voltage and feeder loading constraints were satisfied by a network sensitivity analysis technique. The simulation test from a real LV feeder demonstrated the effectiveness of the charging strategy for energy planning studies.
From load management point of view, great attention has been paid towards coordinate charging that plays a vital role in addressing the issue of thermal loading and voltage violation. The proper strategy to manage EV loads is coordinated (or smart) charging in both central and distributed patterns. That is, their efforts are to improve the load factor, which resulted in greater utilization of existing assets and delay investment in the power system.
Distribution System Planning
A different number of methodologies for solving traditional distribution planning have been proposed in the literature. Wide adoption of EVs has changed the traditional way of distribution expansion planning, and new models and strategies to address this problem needs to be developed to obtain proper system reinforcement options. For example, the most recent, comprehensive review was given in (Abdi-Siab and Lesani, 2020). This paper presented a bilevel model with different objective functions for distribution expansion planning with plug-in EVs. The upper-level model considered the total annual investment costs plus the expected annual production and maintenance costs. The lower problem tried to minimize the cost of energy purchased from the main grid to arrive at the daily optimal schedule. By using primal-dual formulation, this bilevel optimization was recast as a Mixed-Integer Linear Programming problem, which was efficiently solved by standard solvers. The test results of a 24-node distribution system showed that the proposed smart charging strategy provided lower investment costs than a dump charging strategy. In addition, the two-tier problems provided a better optimal solution than that obtained from the original problem when it was separately solved.
An integrated expansion planning framework was formulated as a mixed-purpose nonlinear programming (Fan et al., 2020). The objective function was to minimize the net present value of the investment subject to feeder routing, substation alterations and construction while maximizing the utilization of proposed charging stations. To account for the uncertainties of distributed generation like wind and solar and load like charging demand of EVs, Two-Stage Stochastic Programming was employed and solved by a Multiobjective Tchebycheff Decomposition-Based Evolutionary Algorithm. A test on a modified 54 bus distribution network and 25 transportation node system showed the main strength of the framework that could handle the uncertainty for some parameters. However, the effectiveness of the method heavily relied on large historical databases of load and weather data at small temporal resolution, together with distribution system and traffic flow information.
A distribution expansion planning problem was solved by an adaptive robust optimization approach (Baringo et al., 2020). The objective function was to minimize the sum of both investment and operation costs. The decision variables involved the construction of renewable generating units, storage units, and charging stations for EVs. The problem was reformulated into two-stage stochastic models, where the uncertainty parameters could be incorporated. The short-term uncertainty included the demand, the production of stochastic units, and the price of electricity while the long-term uncertainty involved the future peak demands, the future value of electricity exchanged with the transmission grid, and the number of EVs. A case study based on a 69-node distribution network revealed the effectiveness of this technique. Because the problem was a stage-wise treatment, relationship between decision variables in the optimal solution could be revealed such as the revenues from selling electricity to the EVs, the degree of independence from the transmission system, and the role played by the investment budget availability.
From the aforementioned literature review, the distribution system planning problem is normally established by single-or multi-stage optimization models over a fixed time horizon and solved, given specific assumptions, with the aid of heuristic approaches or traditional optimization techniques. The objective function is usually minimization of one or more cost terms related to capital investments, energy losses, reliability and operation and maintenance, whilst constraints on thermal and voltage limits, full connectivity and radial configuration, as well as individual equipment capabilities define the feasible solution space. Because network reinforcement in LV networks can be achieved with shorter lead time than in MV networks, and some of the assumptions especially the number of EVs would not be valid as expected when time elapses. Therefore, sequential planning would be more attractive and reduce risk of uncertainty for overinvestment or underinvestment.
Evolutionary Algorithms
Because solving for optimal solutions in distribution planning problems involves a mixed integer optimization, which can be solved by heuristic approaches or conventional optimization techniques, numerous conventional techniques have been designed to solve a wide range of optimization problems, such as Linear Programming, Integer Programing, Nonlinear Programming. However, when applied to real world problems, they may suffer from many problems such as: difficulties to find a global solution; risk of divergence; difficulties in handling constraints, requirement of first or second order derivatives (Gavrilas, 2010). To overcome these drawbacks, metaheuristic techniques have been evolved and developed to arrive at a good solution, primarily using searching strategies in forms of exchange values of decision variables in systematic or random fashion (Winston and Venkataramanan, 2002). Such intelligent searching strategies play a vital role and can be based on evolutionary principles.
Particle Swarm Optimization (PSO) is an example of efficient searching techniques and was originally introduced by Ebarhart and Kennedy in 1995 (Lazinica, 2009). Since then, it has been successfully applied in many research and application areas including power systems. PSO is a population-based search algorithm that originally intended to simulate the movement of social behavior of organisms in a bird flock. Each individual within the swarm is represented by a vector in multidimensional search space. The movement of these particles in the search-space is given by simple mathematical formula over the particle’s position and velocity. Each particle’s movement is influenced by its local best-known position and guided toward the global best-known positions in the search-space. This updated position is expected to move the swarm toward the best solutions.
Optimizing the charging and discharging behaviors of EVs with security and economy issues of the grid operation was addressed in (Yang et al., 2014). Solved by an Improved Particle Swarm Optimization (IPSO) algorithm based on genetic variation and simulated annealing, the EV charging model included optimal power flow, statistic characteristics of EVs, EV owners’ degree of satisfaction, and the power grid cost. The performance of the proposed charging strategy was illustrated by a 10-bus distribution system. Some interesting results were presented: significance in operational cost reduction, decrease in the gap between peak-to-valley difference, active power loss reduction and less frequencies for adjustment of the on-load tap change. It was also claimed that better performance on the global search capability was successfully obtained.
Firefly algorithm is another swarm-based metaheuristic algorithm with a random search mechanism and was introduced by (Yang, 2008). The algorithm mimics how fireflies interact using their flashing lights. The movement of the solution is dependent on 1) the attractiveness directly proportional to its brightness, or light intensity, that decreases through distance based on inverse square law, 2) the step length of the local search, and 3) the random vector of appropriate dimension randomly generated from a uniform distribution. Because the search quality heavily relies on parameter setting, there have been different modified versions to improve performance. Described in (Tilahun et al., 2019), continuous optimization problems were reviewed with a critical analysis and modifications with a comparative study forty benchmark problems with different dimensions based on ten base functions.
In (Hamed et at., 2018), a hybrid method called FAPSOTVAC (a combination of Firefly Algorithm and Time Varying Acceleration based Particle Swarm Optimization) was proposed to solve dynamic economic dispatch problem to minimize the total fuel cost considering all practical constraints. It was an extension of static economic dispatch by including highly complex and nonlinear constraints of generating units such as valve point effect, prohibited zones, ramp rate limits and total power losses. The robustness of the proposed hybrid method was validated on power systems with 10 and 30 generating units. The simulation results proved the efficiency of the FAPSOTVAC in terms of solution quality and convergence characteristics.
Proposed by Holland (Holland, 1975), an evolutionary algorithm solves problems by employing processes that mimic biological evolution, such as reproduction, mutation and recombination (Cognizant, 2020). Genetic Algorithm (GA) is a well-known example of this Darwinian-like natural selection process and is based on the principle that stronger candidate solutions with high fitness values will survive and become parents for next generation while weaker ones tend to be eliminated. The candidate selection will be re-evaluated via the biological mechanism until an optimal solution has been found.
As automated LV network planning based on a GA was developed (Wruk et al., 2021) to yield the optimal reinforcement strategy with a minimum sum of the capital and operational expenditures. Such costs were caused by additional lines, substation upgrades and line voltage regulators. The simulation tested on Norwegian low voltage networks with different penetration rates of EVs of the status quo EV mix in Norway in 2018 indicated that the further integration of electric mobility in rural networks would lead to transformer overloads and voltage constraints.
The above examples of algorithms use different searching mechanisms with different levels of exploration and exploitation. Given the fact that no single search algorithm can fit all problems, combining two or more algorithms can improve solution quality or computation efficiency. Hybridization is an attractive option for a particular problem and also offers another research area that has been studied extensively, with the primary objective to compensate for the weaknesses of one algorithm by the strengths of the others.
Electric Vehicle Model
It was reported in (IEA, 2020) that about 80–90% of EV drivers tended to charge their cars at their residence in the evening or late at night because of convenience and cost efficiency whereas the rest (10–20%) charged their EVs at workplaces, shopping malls, charging stations. The main advantage of home charging is cost savings over the course of a year and the associated energy consumption can be less than using an air conditioner (Office of Energy Efficiency and Renewable Energy, 2020). Electric vehicle supply equipment (EVSE) level 1 and level 2 are commonly used for EVs with on-board devices that convert alternating current (AC) to direct current (DC) for batteries (Weston, 2016). Level 1 is for overnight or all-day charging at work (8–10 h) using a standard house plug. Level 2 chargers are generally the preferred option for home and workplace installations and suitable in public locations where cars mostly park for one or more hours, which lets EV owners top up their charge while shopping or working. Level 2 charging uses a dedicated circuit like those used for washing machines and clothes driers. In both cases, single-phase home charging of EVs can cause unbalanced loads and may cause the violation of bus voltage and transformer and feeder loading.
EV load profiles of interest are those of home charging. To simulate a load profile with a resolution of half-hour resulting from home charging, an activity-based Monte Carlo Simulation algorithm was developed to capture the random behavior of each EV. It is assumed that 90% of EV users are charged every day at their residential areas after returning from work, and the other 10% are charged at their workplaces. Two types of data set are required. The deterministic data consist of the number of EVs, their energy consumption (0.2368 kWh/km) (KMUTT and MTEC, 2015), and hourly average vehicle speed (Longdo, 2016). The following probabilistic parameters obtained from surveys, research report and literature include number of daily trips [National Household Travel Survey of United States (Federal Highway Administration, 2017)], travel distance per trip (KMUTNB, 2020), size of EV batteries [Electric Vehicle Association of Thailand, 2020 (EVAT, 2020)], time to arrive home (Leou et al., 2014), and time to leave home (Leou et al., 2014).
Figure 1A shows the hourly average vehicle speed over time used to analyze arrival time at home and departure time from the office. Lower speeds have been observed in daytime while car drivers are able to pick up higher speeds in nighttime. Morning and evening rush hours occupy the lowest speeds during the day. The hourly average speed parameter is used to calculate arrival time at and the departure time from workplaces, in conjunction with random parameters of departure time from home, arrival times at home and travel distance per trip. Most people take two trips in a day accounting for almost 30%, as shown in Figure 1B. The distance traveled per trip is quite spread, ranging from 1 to 60 km (Figure 1C) and a journey below 20 km is most likely for Bangkokians. Given the information registered at Department of Land Transport, the Thailand EV market has seen a most used battery size of 44.5 kWh (Figure 1D), followed by 11.8 and 80 kWh respectively. The frequency distributions of departure time from home (Figure 1E) and arrival time at home (Figure 1F) can be expected as people tend to leave their homes for work relatively concentrated between 3.00 and 8.00 am. while returning to their homes with a wide range of time but most likely between 5.00 and 7.00 pm.
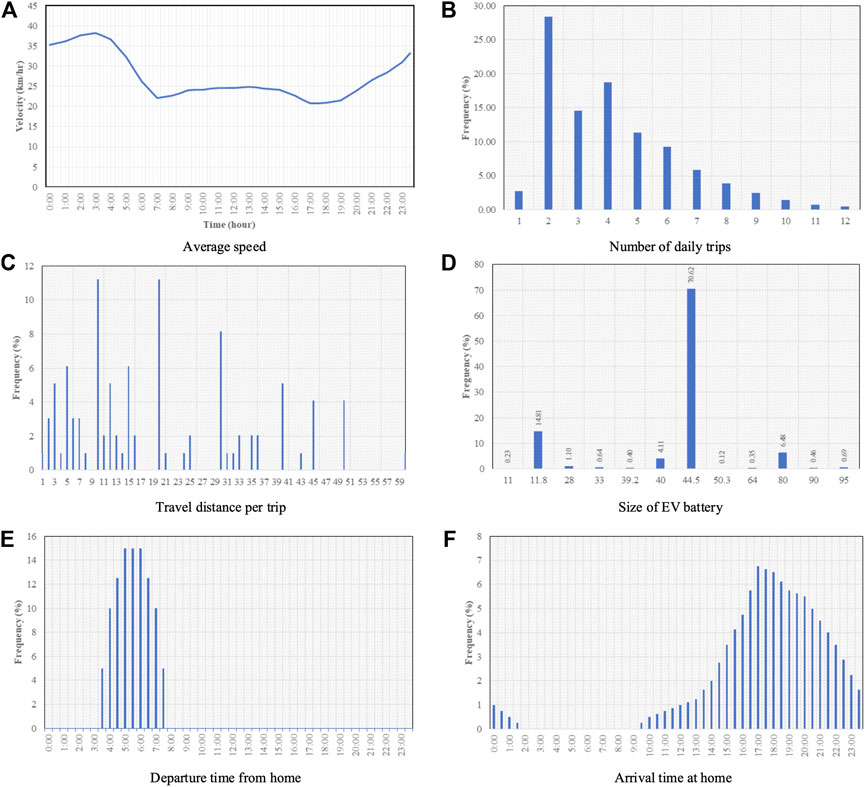
FIGURE 1. Data sets used in Monte Carlo-based load profile simulation.
The simulation of uncontrollable charging is straightforward. That is, as soon as EV owners have arrived home, their cars can start recharging. In such a case, the system allows every EV car to have an equal opportunity to access the grid and obviously can turn stressful if there are many EVs being charged simultaneously. Therefore, limiting the amount of power that users can consume at the same time and allocating a time slot for each car to be charged at different times offer an attractive alternative to uncontrollable charging. This allocation process is called smart charging with direct control. Its simulation requires a predefined upper limit that the total load cannot exceed. This upper limit can be set, for example, as a percentage of the distribution transformer (e.g., 80% of kVA rating).
The principle of the smart charging algorithm follows that of the uncontrollable charging model with a new added stage for EV allocation process in each period of half hour. In each period, the number of EVs that need recharging is compared with available charging slots. If their total demand is less than or equal to the available capacity, every EV is allowed to access the grid. On the other hand, if it is not the case, the criterion of “First Out First in” previously described is adopted based on the concept from My Electricity Avenue (Quiros-Tortos et al., 2018). “First Out” indicate that customers with higher charging times (assuming that they already have a high SoC) will be disconnected before those with lower ones.
For example, in a timeslot, the first EV has been charged for 3 h and the second EV for only 1 h. If there is the third EV that has come in and never been charged before, it will take over the first EV position. On the other hand, higher priority is given to those with lower previous charging durations for reconnection. As an example, in a timeslot where there are first and fourth EVs, having been waiting for 3 and 2 h respectively for reconnection, the algorithm will place the first EV in this timeslot. Note, however, that if there is a newcomer from, say, the fifth EV that has never been charged before and there is only one time slot available in this period, the fifth will have a higher priority over the first. Because of the priority of newcomers, there may be a case that they have higher SoCs than the existing cars. Let assume that the system can accommodate only one EV at any time slot of half hour. if an EV (called EV1) having been charged for 2 h has a SoC of 40%, and another EV (called EV2) arrives with an SoC of 60%, EV2 will be given a priority and allowed to charge its battery. At this stage, the SoCs of the two EVs does not follow our established assumption. Therefore, the developed algorithm has added a remedial action by only allowing EV2 being charged for 2 h before being disconnected. EV1 will occupy the place for the next half hour before being taken over by EV2 again for the next time slot. Both cars will be alternately charged until their batteries are full or either of them leave home for next day. With this process, it is likely that both cars will have their batteries full before their journeys.
Because peak demands play an important role in distribution planning, of interest is an EV representative peak load profile for 1 day with 48 half hours (48 time slots) in each planning year. The simulation procedure to obtain the peak demand in each period is given by the following steps:
Step 1: Set year = 1.
Step2: Obtain deterministic input data (e.g., maximum number of EVs (Max no. EV), maximum number of iterations (Max Iterations), energy consumption, hourly average car speed and stochastic input data (e.g., number of daily trips, travel distance per trip), and define charging management scheme (e.g., uncontrollable charging or smart charging).
Step 3: Set iteration = 1.
Step 4: Generate uniform random numbers to obtain the five stochastic parameters of each EV.
Step 5: Determine the status of each EV in each time slot.
Step 6: If an EV in any time slot is running, calculate energy consumption and its remaining SoC. If the EV is parking, check whether its SoC is not full; flag this EV for the need of recharging.
Step 7: Perform recharging for each EV according to one of the charging management schemes (uncontrollable or smart)
Step8: Combine all one half-hourly load profiles for 5 consecutive weekdays of all EVs to obtain an aggregated one half-hourly load profile for 5 consecutive weekdays.
Step9: Compare the peak demand in each half hour among five weekdays (Monday to Friday equivalent to 240 time slots) to find the one with the highest power demand in each half hour, giving an aggregated one half-hourly load profile for one weekday.
Step 11: If iteration = Max iteration (e.g., 100), compare the peak demand in each half hour among each iteration to find the one with the highest power demand in each half hour. This eventually gives the one half-hourly load profile for one weekday that represents the worst possible scenario of this year (that is year 1). The final half-hourly load profile will be used in the optimization process for low-voltage distribution planning.
Step 12: Set year = year +1; repeat Steps 2–12 or stop if the final planning year has been reached.The comprehensively detailed algorithm for load profile simulation by Monte Carlo is shown in Figure 2.
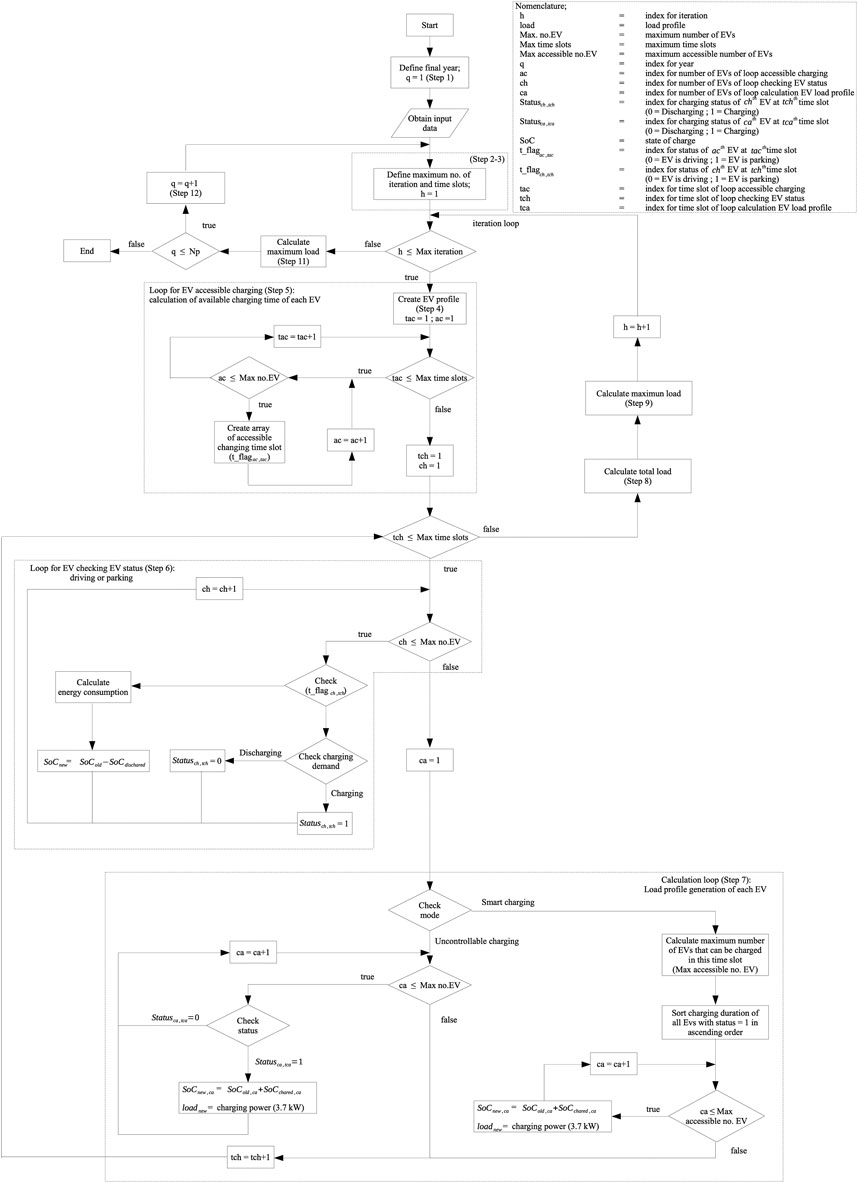
FIGURE 2. Detail of activity-based EV load profile simulation.
Problem Description
Objective Function
Given a system configuration of year
The objective function in Eq. 1 combines the annual cost of equipment (distribution transformers and capacitors), the annual cost of equipment installation, the annual cost of equipment demolition and the annual cost of energy loss.
Constraints
The above objective function is subject to the following constraints.
Distribution transformer loading
Voltage magnitude at bus
Current limit in feeders
Three phase power balance, which will be described in Eqs 5, 6 where
Transformer loading in kVA must be less than the kVA rating of the distribution transformer given in Eq. 2. Voltage magnitude at each bus is limited by Eq. 3 and current flow in each feeder in the system cannot exceed the feeder rating, given in Eq. 4.
Three Phase Unbalanced Power Flow
Equations 2–4 are verified by a three phase unbalanced power flow calculation. Because loads in distribution systems are mostly of the single-phase type fed from single-phase feeders and the systems exhibits a high degree of unbalance and need to be analyzed by three phase power flow. Figure 3 shows a generic three-phase diagram of a distribution line connected between buses
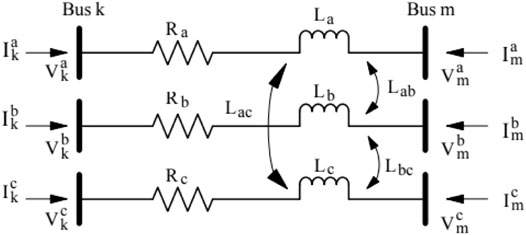
FIGURE 3. Three phase power distribution system.
The equation of active power and reaction power injected at bus k and bus m from Figure 3 can be derived from the following complex power expression in Eq. 5 (Acha et al., 2004).
where
Equation 5 represents the apparent power balance between supply and demand for all the three phases of each bus and can be separated as Eq. 6 for the real part known as active power and as Eq. 7 for the imaginary part known as reactive power.
The two separate equations for the active power and the reactive power being injected into phases a, b and c at bus k are derived by
where
The problem of unbalanced three-phase power flow can be linearized and solved using the method of iterative Newton-Raphson. The power, the mismatch, and the variable become a vector with a size of 3 × 1 and the value in Jacobian will become a matrix of 3 × 3, calculated from Eq. 8, the left-hand side of which represents the mismatch vector of active and reactive powers and the right one is the correction vector of phase voltage and magnitude voltage. In each iteration, the Jacobian matrix and the mismatch vector are updated, and the process is repeated until the value of the mismatch vectors is less than a given tolerance (e.g., 0.001).
where
The mismatch vector of active and reactive powers takes the following form:
The correction vector of phase voltage and magnitude voltage takes the following form:
The elements in the Jacobian matrix of Eq. 8 are calculated by taking the partial derivative of Eqs 6, 7 respect to the state variables of phase voltage,
The initial conditions for the voltage angle of phases a, b and c are assigned as 0,
where
Proposed Sequential Optimization
The objective function and constraints described in Problem Description can be minimized and satisfied by two main resources: capacitors and distribution transformers. The use of capacitors is one common method to solve the voltage drop problem (i.e., customer voltage level must stay with the limits given by Eq. 3. For capacitor installation planning, the number of capacitors, their positions and sizes need to be determined. It is possible that the capacitors that were installed in previous years is demolished if placing new capacitors in the current year reduces the overall system cost.
Alleviating the effects of transformer and feeder overloading can only be achieved by adding new distribution transformers; that is, Eqs 2, 4 must be satisfied. Note that adding a new distribution transformer indirectly helps improve voltage profiles of customer load points because the original network is broken into shortened subnetworks. The question is: at what time will these new distribution transformers be added to the system with the identification of their optimal locations and sizes? Unlike capacitors, new distribution transformers are much more expensive and therefore after having been installed, they will continue to be used for many years. Hence, the planning of this stage involves comparison between the costs associated with acquiring new transformers and their installation, and the cost of energy loss after the year of installation onwards. The combination between the capacitor and distribution transformer problems, where the decision variables are integer variables, can be efficiently solved by a Particle Swarm Optimization (PSO) algorithm. As already discussed, PSO is a metaheuristic that can find a near optimal or optimal solution from search spaces of candidate solutions. PSO is attractive in that it does not use the gradient, which means it does not require that the optimization problem be differentiable as is required by classic optimization methods. Furthermore, it is computationally efficient from real coding.
For the optimization problem given in Problem Description, each particle swarm represents the size of distribution transformers and their positions in the distribution transformer subproblem and the size of capacitors and their positions in the capacitor subproblem. The fitness value of particle is evaluated to determine the best position of each particle and also the best position explored so far (Abido, 2002). The velocities of all particles are updated from the current iteration to the next iteration by an inertia weight (e.g.,
The optimization procedure for capacitor and distribution transformer subproblems, which are given in detail in Figure 4, is of the following three cases:
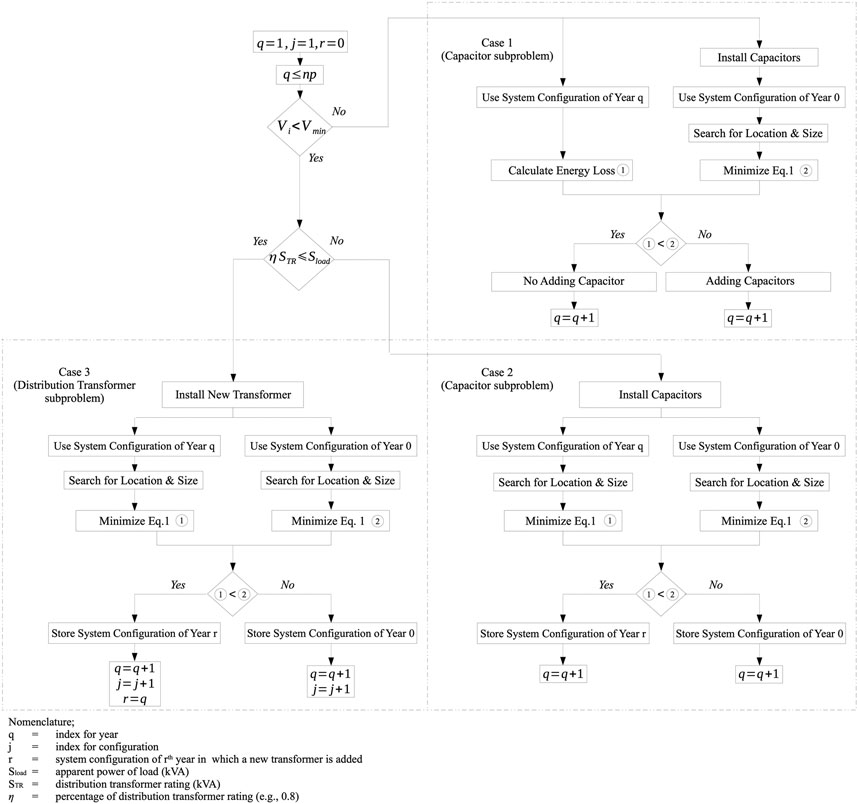
FIGURE 4. Proposed optimization procedure for capacitor and distribution transformer subproblems.
Case 1: If the voltage constraint of all buses is satisfied, do the following steps:
a) Calculate the cost of energy loss;
b) Perform the PSO algorithm to obtain the sizes and locations of capacitors and then calculate the sum of the installation cost of capacitors and the cost of energy loss;
c) Compare the total cost of (a) and (b) and choose the lower one as an optimal solution.
Case 2: If the voltage constraint is violated on any buses, and the system peak load is less than or equal to a percentage of a distribution transformer rating (e.g., 80%), do the following steps:
d) Perform the PSO algorithm based on the original network to obtain the sizes and locations of capacitors and then calculate the sum of the installation cost of capacitors, the cost of energy loss and the cost of demolition for the capacitors installed in the previous years.
e) Perform the PSO algorithm based on the resulting network of (c) of Case 1 to obtain the sizes and locations of capacitors and then calculate the sum of the installation cost and the cost of energy loss.
f) Compare the total cost of (d) and (e) and choose the lower one as an optimal solution.
Case 3: If the voltage constraint is violated on any buses and the system peak load is greater than a percentage of the distribution transformer rating, do the following steps:
g) Perform the PSO algorithm based on the original network to obtain the sizes and locations of distribution transformers and then calculate the sum of the installation cost of transformers, the cost of energy loss, and the cost of demolition of the capacitors installed in the previous years.
h) Perform the PSO algorithm based on the resulting network of (f) of Case 2 to obtain the sizes and locations of capacitors and then calculate the sum of installation cost and the cost of energy loss.
i) Compare the total cost of (g) and (h) and choose the lower one as an optimal solution.
Case Study
The practical low-voltage distribution system used for testing the proposed optimization algorithm consists of 122 buses (or load points) supplied by a distribution transformer of 500 kVA with a power factor of 0.9. This system with 13 feeders is supplied from a 24 kV/400 V distribution transformer located at bus 1. There are in total 120 customers (or 120 load points) connected to the buses shown in the single line diagram of Figure 5. In each year over a 10-years planning horizon, it is assumed that 6 EV loads will be coming into the system at six different buses; Therefore, there are a total of 60 EVs to be added to the following 60 buses over the course of the planning period: 4, 5, 6, 7, 10, 13, 17, 18, 19, 21, 23, 24, 25, 26, 28, 29, 32, 33, 38, 39, 40, 41, 45, 46, 47, 50, 52, 53, 54, 55, 56, 60, 65, 67, 68, 75, 78, 79, 80, 82, 83, 87, 88, 89, 91, 92, 93, 94, 100, 103, 104, 105, 106, 109, 112, 113, 116, 117, 119 and 120. Each EV has a charging power of 3.7 kW with different sizes of kWh as given by Figure 1D.
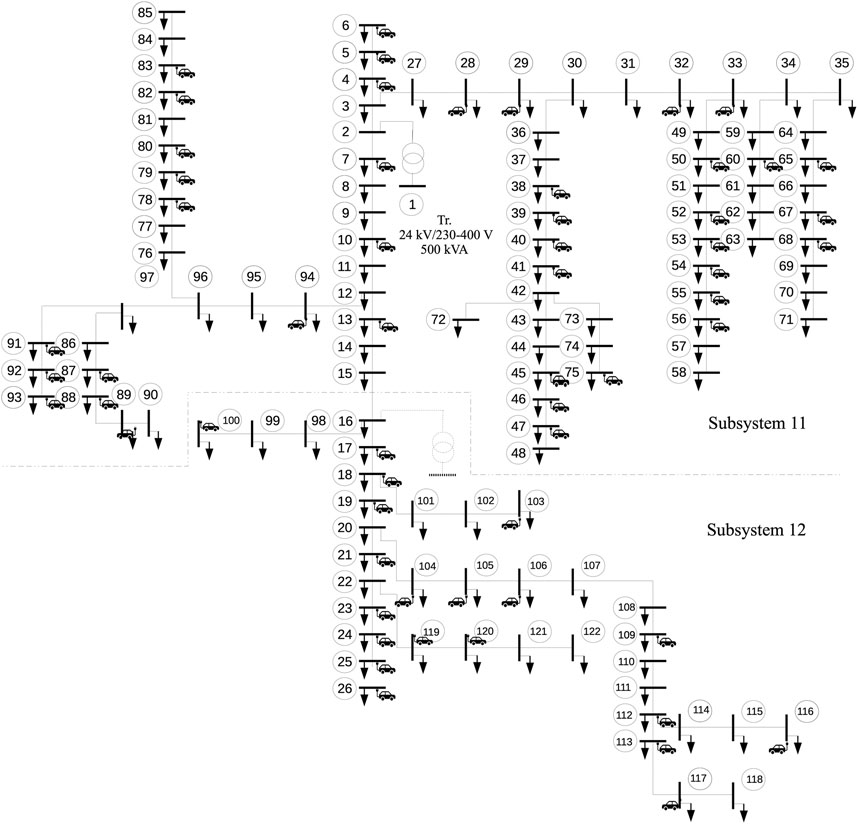
FIGURE 5. Low-voltage distribution system with 122 buses with EV loads.
The system base voltage and power are 240 V and 500 kVA, respectively. The impedance of the feeders is 0.342 + j0.0854 Ω/km and the shunt capacitances of the feeders are neglected. The upper and lower bounds of bus voltage magnitude are 0.95 and 1.05 per unit respectively. The ampere feeder loading is limited at 400 A. Obtained from a power flow result, the initial energy loss of the system is 136.17 kWh/day. With the volume-weighted average cost of energy is at 2.84 Baht/kWh (approximately 0.094 $/kWh) of the wholesale electricity market, the total cost of loss is 12.86 $/day or about 4,696 $/year.
Table 1 shows the available size and price of capacitors with associated installation costs. The wage for capacitor installation and demolition is assumed the same. The available size and price of distribution transformers for new installation are shown in Table 2.
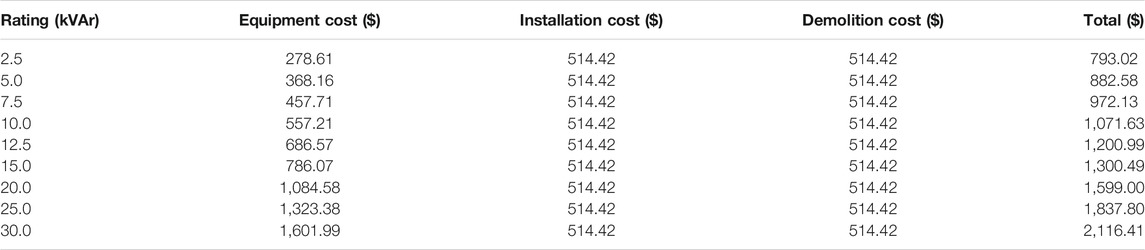
TABLE 1. Size, price, installation and demolition cost of three-phase capacitor.
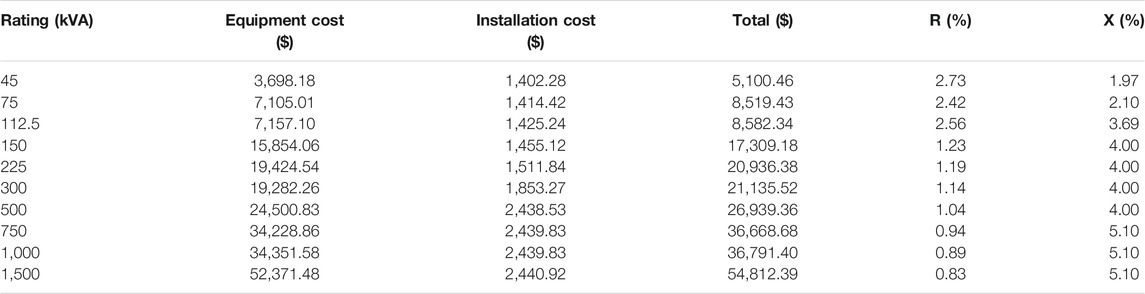
TABLE 2. Size, price and installation cost of distribution transformer.
Results and Discussion
EV Load Profile Simulation
It is assumed that a 48-half-hourly load profile of each of the individual households for weekdays remains the same over 10 years. The accumulated half-hourly load curve of 120 customers without EVs seen by the transformer located at bus 1 has a total daily energy consumption of 317 kW, 6001.42 kWh. Monte Carlo Simulations of 1,000 iterations for each year were performed using the data in Figure 1 and the algorithm in Figure 2 to generate a representative of half-hourly load curve, which would be added to the yearly base load curve to form the yearly total load.
Figure 6 shows ten representative daily load curves for uncontrollable charging. Each of the curves represents the worst scenario of peak load in each year. The system load keeps increasing because new 6 EVs are added annually. The maximum load in the first year is about 333 kW, while that in the last year is about 444 kW. Note that the load profiles between 8.00–10.00 a.m. over the 10 years of Figure 6 are not changed because during these periods, people tend to charge their batteries at workplaces and therefore these amounts of loads were not included in the household load profiles. The load factor gradually decreases from 0.793 in the first year to 0.733 in the final year.
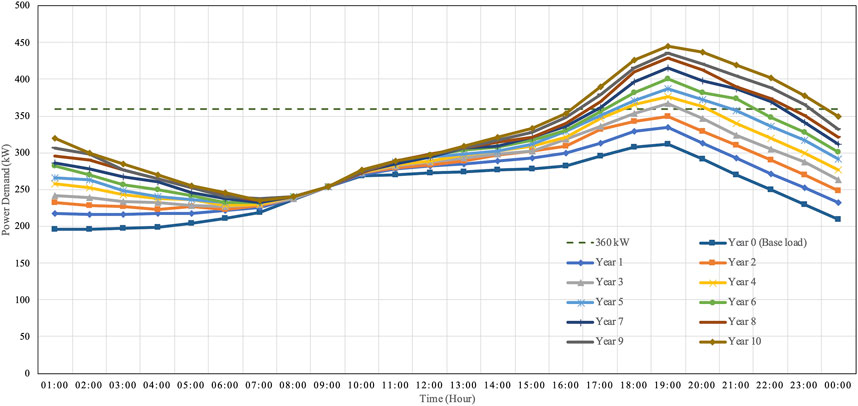
FIGURE 6. Power demand as a function of time for uncontrollable charging over 10 years.
Figure 7 shows a simulation of the total system load of the smart charging with direct control. It is obviously seen that the maximum load in the system can be kept below 360 kW, especially during late evening. The smart charging with direct control increases the percentage utilization of distribution transformers, while the final SoCs of all the EVs remain the same as for both uncontrollable and smart charging. The load factor rises from 0.793 in the first year to 0.862 in the last. The smart charging managed to control sequence of charging developed algorithm of Figure 2 can lead to better utilization of existing networks, thus being able to accommodate a high penetration of EVs on existing residential networks with little or no need for upgrading network infrastructure.
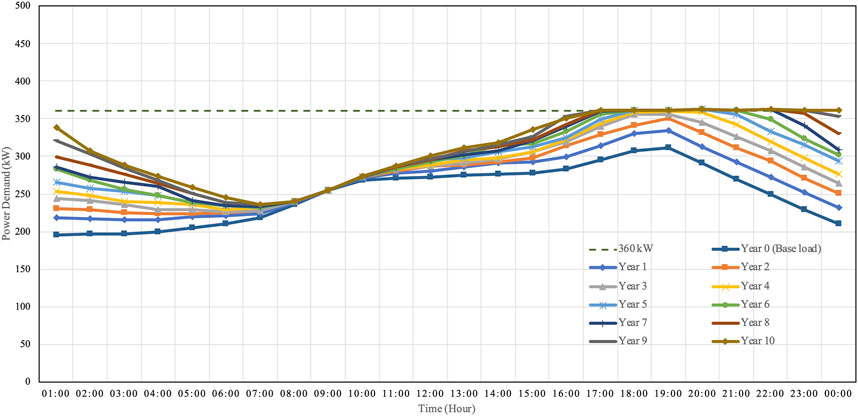
FIGURE 7. Power demand as a function of time for smart charging with direct control over 10 years.
Note that the load factor of the load curves in the first 3 years is the same as that of uncontrollable charging because the peak demand in the smart charging scenario still stays below 360 kW. Load shifting is obvious seen in Figure 7 as the smart charging managed to move energy from evening till midnight to some periods after midnight. In fact, this system can still host up to 152 EVs from a test run without violating the distribution transformer rating while the EV users can recharge their batteries as much as possible, depending on their arrival time at home. In other words, the total energy of each year between uncontrollable and smart chargings is the same. The load profiles in Figures 6, 7 provide very useful information for system planners for resource optimization in the planning stage to appropriately respond to increase usage of EVs.
Low-Voltage Distribution System Planning
Four different planning scenarios are of interest, one with existing planning criteria and the other three are proposed:
1) Uncontrollable charging with conventional planning (existing), which has long been applied in electric power utilities in Thailand: According to planning criteria, if the loading of a distribution transformer exceeds 80% of its rated capacity, a replacement of the existing transformer with a larger capacity is required on the same location. With reference to Figure 6, a 750 kVA transformer (one step higher size than the existing one) with a specification given in Table 2 is needed in Year 3 because the system peak load has exceeded 360 kW during 4–11 pm. In addition, if the voltage of any customer load points along an LV feeder drops below 0.95 p.u., a capacitor with an appropriate size shall be installed at the first load point along that feeder that has a voltage drop problem. The maximum allowable size of capacitors to be installed is limited by the voltage upper bound given in Eq. 3. The process is repeated until the voltage drop problem for all the downstream customers from the first load point has been solved.
2) Uncontrollable charging with PSO-based planning for capacitor and distribution transformer placement: This scenario is similar to the first one except that instead of replacing the existing distribution transformer with a lager one at the same location, a second transformer can be located at the most suitable location. Its appropriate size and location of the transformer are identified by the developed PSO. The PSO also helps to determine the most appropriate location and the size of capacitors if the system has seen voltage drop.
3) Smart charging with PSO-based planning for capacitor placement: Because the smart charging is introduced in this scenario and can keep the system load to stay below the transformer rating (see Figure 2), installing a new distribution transformer is not required and only the voltage drop problem needs to be deal with the PSO.
4) Smart charging with deterministic decision and PSO-based planning for capacitor and distribution transformer placement: This last scenario is investigated because energy loss is involved. Although the smart charging with direct control can improve the utilization of distribution transformers, a trade-off analysis between with and without a new distribution transformer is worthwhile. To be specific, it is interesting to compare the total cost of one transformer supplying a long network with two transformers delivering two or more shorter subnetworks that are separated from the original one.
The optimal planning schedule over the planning horizon of 10 years for the first two scenarios is shown in Table 3 and for the others in Table 4. The developed PSO was simulated with 30 iterations and 30 particles in Scenarios 2–4. The analysis and the discussion of the results of each scenario are given as follows.
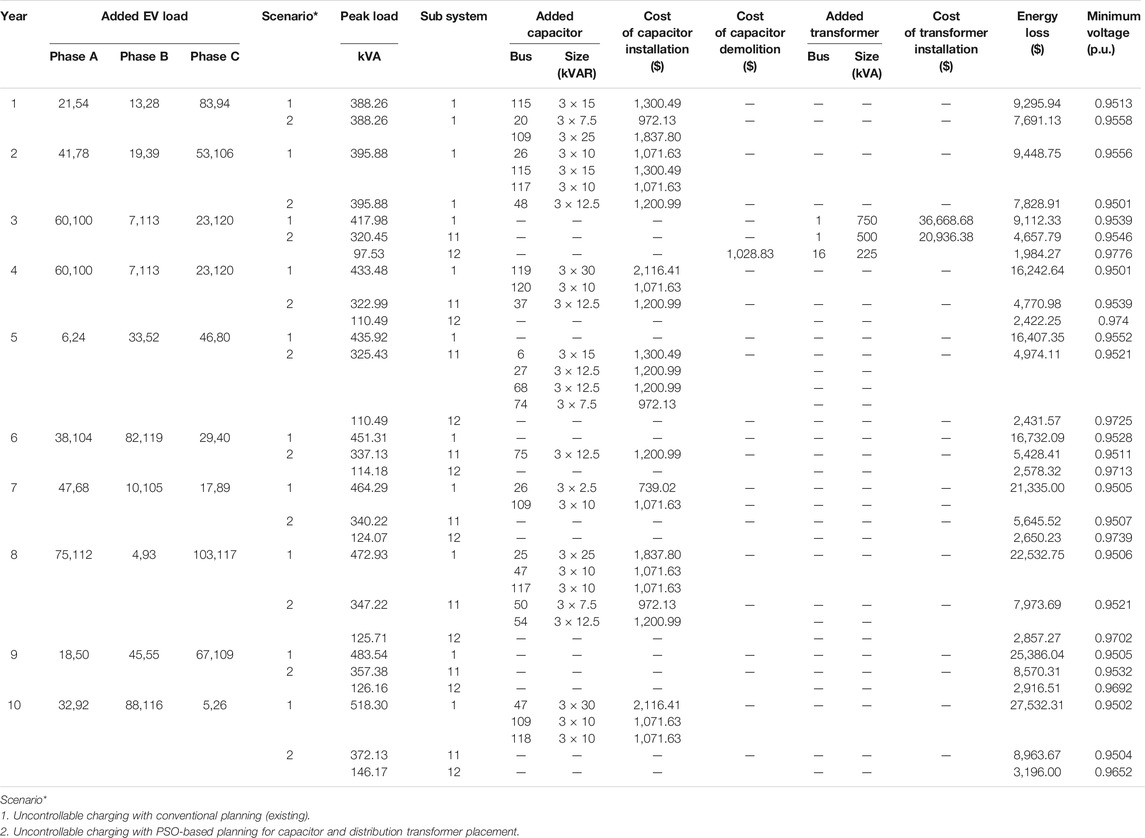
TABLE 3. Optimal planning schedule for scenarios 1 and 2.
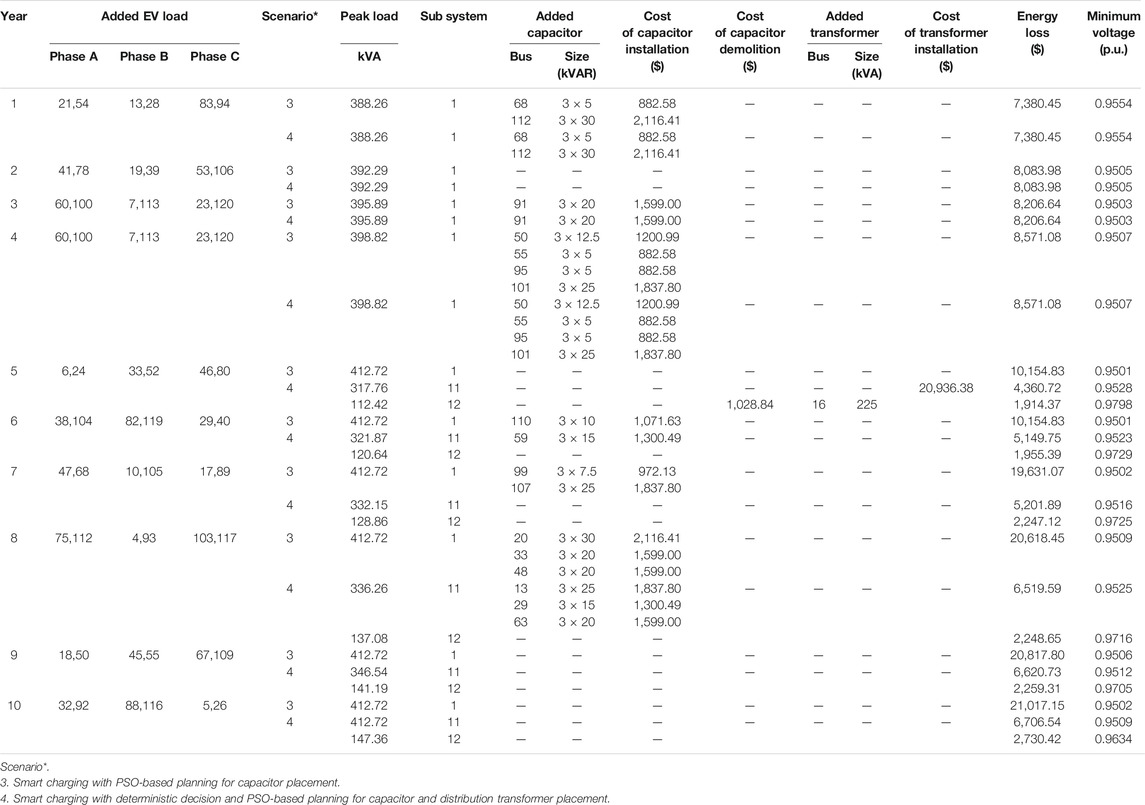
TABLE 4. Optimal planning schedule for scenarios 3 and 4.
In Scenario 1, the system has encountered a voltage drop problem since the first year, and capacitors were added in Years 1, 2, 4, 7, 8 and 10. The more entry of EV loads, the more capacitors were required. Because the peak load in the third year surpassed 80% of the transformer rating, the existing transformer was then replaced by a 750 kVA in the third year with an equipment cost of $36,668.68. The cumulative total cost was $228,677, about 76% of which was contributed by the energy loss. The total capacitors of 592.5 kVAr were added into the system with no removal of the already-installed capacitors.
In Scenario 2, PSO for Volt/Var control helped identify capacitor and distribution transformer replacement. The capacitors installed in Year 1 were removed in Year 3 with a demolition cost of $1,028.84 and a new 225 kVA distribution transformer was needed at Bus 16 in Year 3. The cumulative total cost of this scenario was $122,766. Adding the transformer of 225 kVA at Bus 16 in Year 3 broke the existing network into two subnetworks (designated as subnetworks 11 and 12 in Table 3); one supplied by the existing transformer and the others by the new one. As a result, the overall coverage length of the two subnetworks was shorter. The system has seen capacitors installed in six different years (i.e., 1, 2, 4, 5, and 6, and 8).
In Scenario 3, transformer addition is unnecessary due to the implementation of the smart charging with direct control, which shows the merit of smart charging. Therefore, only installing capacitors of 645 kVA to mitigate the voltage drop problem was required in six different years (i.e., 1, 3, 4, 6, 7 and 8), giving the cumulative total cost of $157,307. It is remarkably interesting to note that this scenario has a greater total cost than the second scenarios by $34,540 despite a high utilization of the transformer.
In Scenario 4, which is an extension of Scenario 3 by including a deterministic decision into the planning period. Table 4 shows that the insertion of a new transformer of 225 kVA at Bus 16 was required in Year 5 and two subnetworks were formed. The capacitors of 90 kVAr installed in Year 1 and of 75 kVAr installed in Year 5 needed demolition and a new set of capacitors of 225 kVAr came in Years 6 and 8 for Subnetwork 11. This scenario has a cumulative total cost of $117,562.
Figure 8 shows the cumulative total cost over 10 years for the four scenarios. Comparing the conventional planning (Scenario 1) with sequential planning (Scenarios 2–4), the cumulative total cost of each year for Scenario 1 is highest from the first year to the last. This shows the main advantage of sequential planning. The figure also reveals that replacing the existing transformer with a new one with a size of 750 kVA in year 3 sees a jump, which eventually reaches $228,677 in the final year and significantly higher than that of Scenario 4. If a size of 1,000 and 1,500 kVA had been selected instead of the 750 kVA, the accumulated total cost would have been $221,887 and $225,421 respectively. Therefore, a 1,000 kVA transformer would have been a better choice for the conventional planning concept. However, without the exact knowledge of EV loads, it would have been difficult to select an appropriate size of a new distribution transformer as the costs of transformer replacement and energy losses became involved in subsequent years after installation.
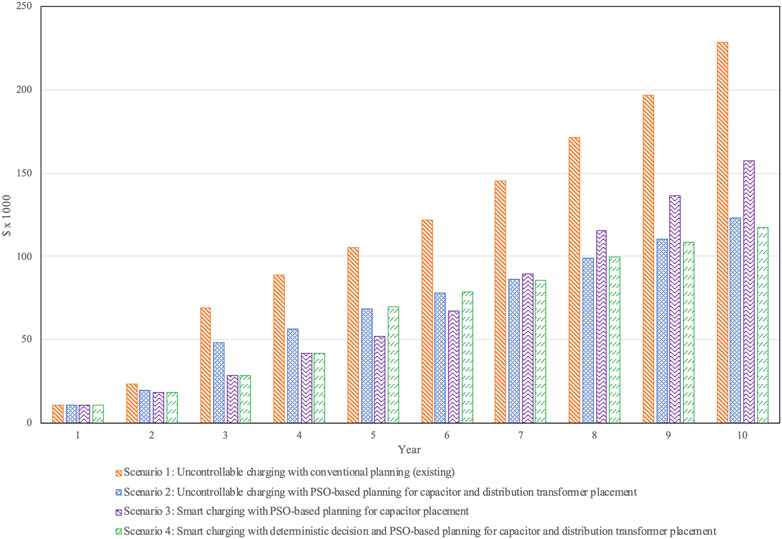
FIGURE 8. Yearly cumulative total cost in 122 bus low-voltage distribution system.
When comparing Scenarios 3 with 4, the total cumulative cost of Scenario 3 is lower for the first 6 years, but after that, continuing doing so seems to be uneconomically justified because of higher accumulated energy losses originated from the existing transformer and the feeders. The smart charging with deterministic decision (Scenario 4) can fix this future blind problem as a new 225 kVA transformer was added into the system at bus 16 in the fifth year, at which the total load surpassed 80% of the transformer kVA rating (i.e., 400 kVA). This method not only offers a better asset management but also yields lowest energy losses and give the lowest cumulative total cost among the four scenarios. It is very interesting to note that Bus 16 was selected by the PSO to place the new transformers in Scenarios 2 and 4, implying that this bus is a strategic location that provides a good balance of the total kW loading and the total circuit length in each of the two subnetworks.
Without consideration of time values of money (i.e., zero discount rate) for the sake of simplicity in comparison, the difference in the cumulative total cost between the uncontrollable charging of Scenario 1 and the smart charging of Scenario 4 is $111,116 (about 3,357,121 THB) for this small-sized LV network. For a moderate- or large-sized distribution system with tens or hundreds of thousands of LV networks, cost savings obtained from the proposed optimization model can become extremely large.
Before the EV loads were gradually entered into the system, the initial time-dependent bus voltage for some representative buses located at the end of the feeders is shown in Figure 9A. In general, two factors influence bus voltage levels: amounts of loads during the day and bus location. Reduction in voltage level will be accompanied by a rise in load current level in the circuit and therefore the bus voltage profiles follow the household baseload pattern without EVs (see Figure 6). Bus 118 has seen the lowest voltage magnitude because it is furthest away from the supply point (i.e., Bus 1). Figure 9B confirms that the planning schedule for the four scenarios can maintain the bus voltage at the end of feeders above 0.95. Although the conventional planning in Scenario 1 managed to solve the voltage drop problem using a point-by-point technique, it did not attempt to solve a system-wide voltage problem while succeeding in reactive voltage control for loss minimization as in the other three PSO-based scenarios.
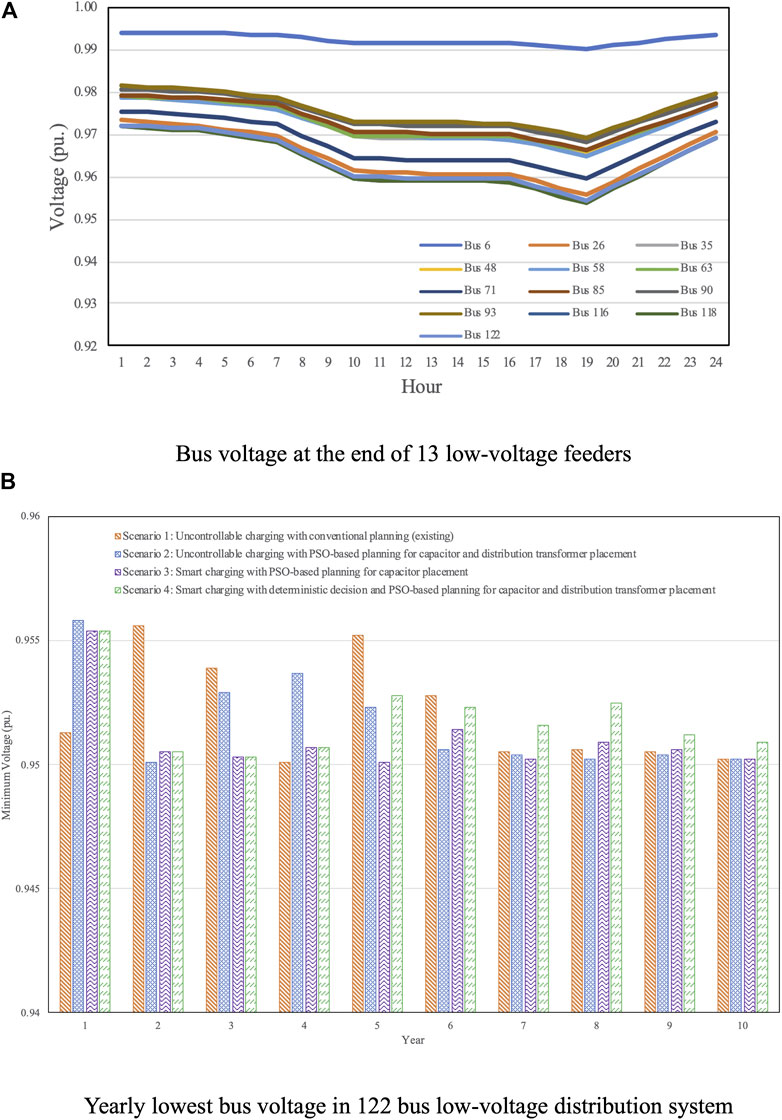
FIGURE 9. Bus voltage in 122 bus LV distribution system.
The convergence report, as illustrative purpose, for Years 5 and 8 of Scenarios 2, 3, and 4, where the PSO was simulated, is shown in Figure 10. The optimal results in these 2 years could be found after four iterations. The statistical report for different simulation runs of the PSO is shown in Table 5. The small standard deviation compared to the mean of about 1–2% in each scenario indicates the quality of the optimal solutions.
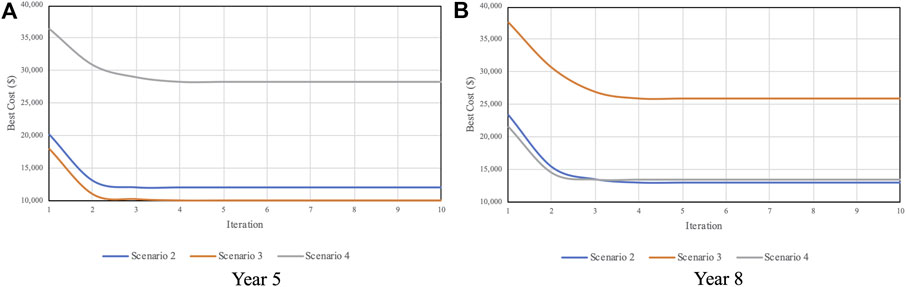
FIGURE 10. PSO convergence for the best total cost in Years 5 and 8.
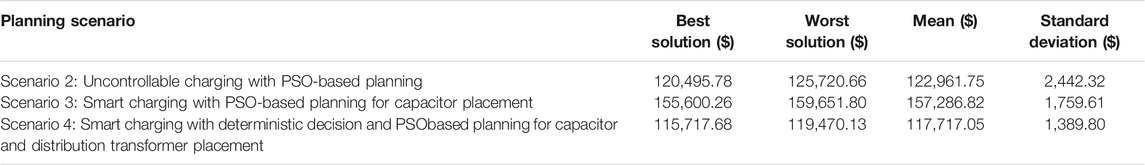
TABLE 5. Best solution, worst solution, mean and standard deviation for each planning scenario.
Discussion
Based on the simulation results, integrating optimization over the planning period has benefited greatly from lower total costs as can be seen from Scenario 1 when compared with the PSO-based scenarios. The use of smart charging may not guarantee a lower total cost than uncontrollable charging (comparison between Scenarios 2 and 3). The reason is that although the smart charging with direct control can effectively delay investment in low-voltage network reinforcement, it is possible that the smart charging may fail to capture annual higher operating costs in later years due to the accumulated cost of energy loss (comparison between Scenarios 3 and 4). The smart charging by direct control can limit the maximum allowable loading capability of a distribution transformer and can dissipate the power generated by EV consumption over time. Doing so significantly improves the transformer utilization (i.e., better load factor) but causes an increase in energy loss. To resolve this future blind problem, a deterministic decision has been introduced considering that in any year of the planning horizon, if the overall maximum peak demand supplied by anyone of the distribution transformers in the system exceeding a certain amount of transformer loading, for example 80%, of its capacity, the system requires adding new distribution transformers in that year. Having the extra transformers will, therefore, eventually lower the annual operating costs in terms of energy loss, thus decreasing the cumulative total cost. The developed combined sequential and deterministic techniques can introduce a considerable cost-savings, while helping electric utilities to accommodate extensive use of EVs from customers.
Conclusion
This research paper has presented a practical methodology for low-voltage distribution system planning to support the extensive use of EVs based on approaches of Monte Carlo Simulation and a Sequential Planning algorithm using PSO. The proposed method can be efficiently applied and implemented to accommodate gradual or immediate increase of EV loads in the future. The great benefit of the proposed activity-based Monte Carlo Simulation algorithm, where the uncertainty of charging behavior of the EVs is considered and incorporated with real probabilistic data, is that it can capture the worst possible peak demand in each year caused by existing EVs. Uncontrollable and smart charging are of interest. The smart charging algorithm embedded in the Monte Carlo model based on the concept of “First Out First in” with a priority constraint was comprehensively developed. With this very useful information of load curves, a PSO was developed to optimally identify the optimal schedules of distribution transformers and capacitors.
It is confirmed from the case study of a 122-node distribution system with the four different scenarios that the developed PSO can identify when, where and what size distribution transformers should be added, and capacitors should be added/replaced. Another key interesting finding in this research is that although smart charging offers an effective solution in delaying transformer installation/replacement time and improve the utilization factor of distribution transformers, it can cause the overall high accumulated energy loss over the planning period. Such a future blind problem can be resolved by the suggested deterministic decision. In addition, as far as high uncertainty for long-term planning is concerned, the conventional low-voltage distribution planning may lead to overinvestment or underinvestment. Therefore, the method of sequential decision proposed in this research offers more adaptive solutions, taking advantage of short lead time for LV reinforcement and can reasonably tackle uncertain penetration levels of EV loads. The proposed method is strongly recommended as a practical useful guideline for electric utilities to support widespread EV adoption in the future.
Data Availability Statement
Publicly available datasets were analyzed in this study. This data can be found here: https://web.dlt.go.th/statistics/; https://traffic.longdo.com/averagespeed; http://www.evat.or.th/attachments/view/?attach_id=242668; https://nhts.ornl.gov/downloads.
Author Contributions
SoS contributed to conception and design of the research. SuS organized the database, coded the simulation software and performed simulations in the case study. SoS and SuS wrote the first draft of the manuscript. SoS and SuS contributed to manuscript revision, read, and approved the submitted version.
Conflict of Interest
The authors declare that the research was conducted in the absence of any commercial or financial relationships that could be construed as a potential conflict of interest.
Publisher’s Note
All claims expressed in this article are solely those of the authors and do not necessarily represent those of their affiliated organizations, or those of the publisher, the editors and the reviewers. Any product that may be evaluated in this article, or claim that may be made by its manufacturer, is not guaranteed or endorsed by the publisher.
Acknowledgments
The authors would like to express their sincere thanks to Department of Land Transport (DLT) and Office of Transport and Traffic Policy and Planning (OTP) of Thailand for the data used in this research work. Part of this research work for the comprehensive EV load simulation was financially supported by Research and Development Department of Metropolitan Electricity Authority (MEA), Thailand.
References
Abdi-Siab, M., and Lesani, H. (2020). Distribution Expansion Planning in the Presence of Plug-In Electric Vehicle: A Bilevel Optimization Approach. Int. J. Electr. Power Energ. Syst. 121, 106076. doi:10.1016/j.ijepes.2020.106076
Abido, M. A. (2002). Optimal Power Flow Using Particle Swarm Optimization. Int. J. Electr. Power Energ. Syst. 24 (7), 563–571. doi:10.1016/S0142-0615(01)00067-9
Acha, E., Fuerte-Esquivel, C., Ambriz-Pérez, H., and Angeles-Camacho, C. (2004). FACTS: Modelling and Simulation in Power Networks. England: John Wiley & Sons. doi:10.1002/0470020164
Al-Alawi, B. M., and Bradley, T. H. (2013). Review of Hybrid, Plug-In Hybrid, and Electric Vehicle Market Modeling Studies. Renew. Sust. Energ. Rev. 21, 190–203. doi:10.1016/j.rser.2012.12.048
Apostolaki-Iosifidou, E., Woo, S., and Lipman, T. (2019). “Challenges and Opportunities for Electric Vehicle Charging Detection Using Utility Energy Consumption Data,” in proceeding of the Transportation Research Board Annual Meeting. (Washington DC, USA).
Bangkok Post (2020). Charging Ahead with EVs. Available at: https://www.bangkokpost.com/auto/news/2004427/charging-ahead-with-evs (Accessed October 19, 2020).
Baringo, L., Boffino, L., and Oggioni, G. (2020). Robust Expansion Planning of A Distribution System with Electric Vehicles, Storage and Renewable Units. Appl. Energ. 265, 114679. doi:10.1016/j.apenergy.2020.114679
Billinton, R., and Allan, R. N. (1992). Reliability Evaluation of Engineering Systems: Concepts and Techniques. 2nd edition. Boston: Springer. doi:10.1007/978-1-4899-0685-4
Felipe Cortés Borray, A., Garcés, A., Merino, J., Torres, E., and Mazón, J. (2021). New Energy Bound-Based Model for Optimal Charging of Electric Vehicles with Solar Photovoltaic Considering Low-Voltage Network's Constraints. Int. J. Electr. Power Energ. Syst. 129, 106862. doi:10.1016/j.ijepes.2021.106862
Cognizant (2020). Evolutionary Algorithm. Available at: https://www.cognizant.com/glossary/evolutionary-algorithm (Accessed April 16, 2021).
Crozier, C., Morstyn, T., and McCulloch, M. (2020). The Opportunity for Smart Charging to Mitigate the Impact of Electric Vehicles on Transmission and Distribution Systems. Appl. Energ. 268, 114973. doi:10.1016/j.apenergy.2020.114973
Crozier, C., Morstyn, T., and McCulloch, M. (2021). Capturing Diversity in Electric Vehicle Charging Behaviour for Network Capacity Estimation. Transportation Res. D: Transport Environ. 93, 102762. doi:10.1016/j.trd.2021.102762
Electric Vehicle Association of Thailand (2020). Summary of Battery Electric Vehicle Models in Thailand. Available at: http://www.evat.or.th/attachments/view/?attach_id=242668 (Accessed August 16, 2020).
EPPO (2016). Resolution of the National Energy Policy Council 1/2016.(No. 6) Available at: http://www.eppo.go.th/index.php/th/eppo-intranet/item/10185-nepc-prayut11-3-59 (Accessed March 15, 2020).
Fan, V. H., Dong, Z., and Meng, K. (2020). Integrated Distribution Expansion Planning Considering Stochastic Renewable Energy Resources and Electric Vehicles. Appl. Energ. 278, 115720. doi:10.1016/j.apenergy.2020.115720
Federal Highway Administration (2017). National Household Travel Survey. Available at: https://nhts.ornl.gov/downloads/ (Accessed April 23, 2019).
Gavrilas, M. (2010). “Heuristic and Metaheuristic Optimization Techniques with Application to Power Systems,” in International Conference on Mathematical Methods and Computational Techniques in Electrical Engineering - Proceedings, 13.
Hamed, M., Mahdad, B., Srairi, K., and Mancer, N. (2018). Application of a Novel Modified Hybrid Algorithm for Solving Dynamic Economic Dispatch Problem with Practical Constraints. Aeee 16, 459–470. doi:10.15598/aeee.v16i4.2877
Holland, J. H. (1975). Adaptation in Natural and Artificial Systems. Michigan: University of Michigan Press.
Hussain, M. T., Sulaiman, D. N. B., Hussain, M. S., and Jabir, M. (2021). Optimal Management Strategies to Solve Issues of Grid Having Electric Vehicles (EV): A Review. J. Energ. Storage 33, 102114. doi:10.1016/j.est.2020.102114/
IEA (2020). IEA Global EV Outlook 2020 Entering the Decade of Electric Drive? International Energy Agency. Paris: IEA.
KMUTT and MTEC (2015). Assessment of Electric Vehicle Technology Development and its Implication in Thailand. Bangkok: King Mongkut's University of Technology Thonburi and National Metal and Materials Technology Center.
KMUTNB (2020). Draft Final Report, Preparation of Electrical Infrastructure to Support Electric Vehicle. Bangkok. King Mongkut’s University of Technology North Bangkok.
Leou, R.-C., Su, C.-L., and Lu, C.-N. (2014). Stochastic Analyses of Electric Vehicle Charging Impacts on Distribution Network. IEEE Trans. Power Syst. 29 (No. 3), 1055–1063. doi:10.1109/TPWRS.2013.2291556
Longdo (2016). Vehicle Average Speed in Bangkok. Thai ITS Association. Available at: https://traffic.longdo.com/averagespeed (Accessed August 23, 2020).
Moon, S. K., and Kim, J. O. (2017). Balanced Charging Strategies for Electric Vehicle on Power Systems. Appl. Energ. 44, 54. doi:10.1016/j.apenergy.2016.12.025
Office of Energy Efficiency and Renewable Energy (2020). Charging at home. Available at: https://www.energy.gov/eere/electricvehicles/charging-home (Accessed August 15, 2020).
Quiros-Tortos, J., Ochoa, L., and Butler, T. (2018). How Electric Vehicles and the Grid Work Together: Lessons Learned from One of the Largest Electric Vehicle Trials in the World. IEEE Power Energ. Mag. 16 (6), 64–76. doi:10.1109/MPE.2018.2863060
Shi, Y., Zhang, Q., He, A., Pan, A., Zhang, M., Li, C., et al. (2020). A Real-World Investigation into Usage Patterns of Electric Vehicles in Shanghai. J. Energ. Storage 32, 101805. doi:10.1016/j.est.2020.101805
Shi, Z., Han, P., Li, Y., Guo, T., Wang, J., and Wang, Y. (2020). “Monte-Carlo-Based Modeling and Simulation for Charging Operation of the Electric Vehicles,” in 39th Chinese Control Conference (CCC). (Shenyang, China). 6033–6036. doi:10.23919/CCC50068.2020.9189297
Solanke, T. U., Ramachandaramurthy, V. K., Yong, J. Y., Pasupuleti, J., Kasinathan, P., and Rajagopalan, A. (2020). A Review of Strategic Charging-Discharging Control of Grid-Connected Electric Vehicles. J. Energ. Storage 28, 101193. doi:10.1016/j.est.2020.101193
Sun, W., Neumann, F., and Harrison, G. P. (2020). Robust Scheduling of Electric Vehicle Charging in LV Distribution Networks under Uncertainty. IEEE Trans. Ind. Applicat. 56 (5), 5785–5795. doi:10.1109/TIA.2020.2983906
Tie, S. F., and Tan, C. W. (2013). A Review of Energy Sources and Energy Management System in Electric Vehicles. Renew. Sust. Energ. Rev. 20, 82–102. doi:10.1016/j.rser.2012.11.077
Tilahun, S. L., Ngnotchouye, J. M. T., and Hamadneh, N. N. (2019). Continuous Versions of Firefly Algorithm: A Review. Artif. Intell. Rev. 51, 445–492. doi:10.1007/s10462-017-9568-0
Weston, L. (2016). “Residential Electric Vehicle Charging,” A Guide for Local Government. AES Engineering. Vancouver: C2MP and Fraser Basin Council.
Winston, W. L., and Venkataramanan, M. (2002). Introduction to Mathematical Programming: Operations Research. in 4th Edition, Vol. 1. United States: Thomson Learning.
Wruk, J., Cibis, K., Resch, M., Sæle, H., and Zdrallek, M. (2021). Optimized Strategic Planning of Future Norwegian Low-Voltage Networks with a Genetic Algorithm Applying Empirical Electric Vehicle Charging Data. Electricity 2, 91–109. doi:10.3390/electricity2010006
Keywords: electric vehicles, load profile simulation, particle swarm optimization, Monte Carlo simulation, low-voltage distribution system planning
Citation: Sangob S and Sirisumrannukul S (2021) Optimal Sequential Distribution Planning for Low-Voltage Network With Electric Vehicle Loads. Front. Energy Res. 9:673165. doi: 10.3389/fenrg.2021.673165
Received: 26 February 2021; Accepted: 16 July 2021;
Published: 30 July 2021.
Edited by:
Rakibuzzaman Shah, Federation University Australia, AustraliaReviewed by:
Amirreza Naderipour, University of Technology Malaysia, MalaysiaUmer Akram, The University of Queensland, Australia
Copyright © 2021 Sangob and Sirisumrannukul. This is an open-access article distributed under the terms of the Creative Commons Attribution License (CC BY). The use, distribution or reproduction in other forums is permitted, provided the original author(s) and the copyright owner(s) are credited and that the original publication in this journal is cited, in accordance with accepted academic practice. No use, distribution or reproduction is permitted which does not comply with these terms.
*Correspondence: Somporn Sirisumrannukul, c29tcG9ybi5zQGVuZy5rbXV0bmIuYWMudGg=