 Masoom Fatima1,2
 Rakel W. Lindström
- 1Department of Biosciences, COMSATS University, Islamabad, Pakistan
- 2Department of Chemical Engineering, KTH Royal Institute of Technology, Stockholm, Sweden
- 3Department of Chemical Engineering, COMSATS University, Islamabad, Pakistan
A flow through anaerobic microbial fuel cell (MFC) was designed and optimized for efficient treatment of recalcitrant textile wastewater. The membrane-less MFC was first time fabricated with a unique combination of electrodes, a novel bioanode of synthesized lignin-based electrospun carbon fiber supporting a biofilm of Geobacter sulfurreducens for acetate oxidation and an air-breathing cathode, consisting of a pyrolyzed macrocycle catalyst mixture on carbon bonded by polytetrafluoroethylene (PTFE). The effects of different organic loadings of acetate along with Acid Orange (AO5), operation time and ionic strength of auxiliary salts (conductivity enhancers) were investigated and responses in terms of polarization and degradation were studied. In addition, the decomposition of the organic species and the degradation of AO5 along with its metabolites and degraded products (2-aminobenzenesulfonic acid) were determined by chemical oxygen demand (COD) analysis, UV-Vis spectrophotometry and high-performance liquid chromatography (UV-HPLC) techniques. SEM and TEM images were also used to find out the biocompatibility of the microbes on lignin-based electrospun carbon felt anode and the morphology of the cathode. Reduction and breakage of the azo bond of AO5 occurs presumably as a side reaction, resulting in the formation of 2-aminobenzenesulfonic acid and unidentified aromatic amines. Maximum current density of anode 0.59 Am−2 and power density of 0.12 Wm−2 were obtained under optimized conditions. As a result, decolouration of AO5 and chemical oxygen demand (COD) removal efficiency was 81 and 58%, respectively. These results revealed that the low-cost MFC assembly can offer significant potential for anaerobic decolouration of recalcitrant textile wastewater.
Highlights
Electrospun lignin based single chambered air-cathode MFC is able to breakdown azo bond of AO5 dye along significant electricity generation.The color removal and COD reduction by the MFC was upto 81 and 58%. Azo dye competes for electrons with electrospun lignin anode as a result low performance of MFC.Azo bond is cleaved, results in 2-aminobenzenesulfonic acid and unknown aromatic amines are appeared.
Introduction
With growing concerns on freshwater, human health, aquatic life, climate change and environmental pollution, textile wastewater is receiving significant attention for cost-effective treatment and as a resource than waste (Javed et al., 2019; Maaz et al., 2019). More than 2,000 different azo dyes are used yearly in the textile, paper and food industries (Vijaykumar et al., 2007). Many of these dyes are toxic, carcinogenic and mutagenic (Carliell et al., 1998; Selvam et al., 2003; Fatima et al., 2017; Ahmad et al., 2018).During dyeing process, about 15% of the dye is not absorbed by the fabrics, therefore, is spilled into hydrosphere. The azo dyes may result in significant and irreversible health and environmental problems even at a ppm level in the effluent (Tan et al., 2000). The presence of azo linkages with highly substituted aromatic rings makes these dyes stable and persistent in the natural environment. In this study, Acid Orange-5 (AO5) is selected as a model azo dye due to its stable molecular nature. During a conventional physicochemical treatment processes, the complex recalcitrant dye such as AO5 may not be removed effectively, e.g., microfiltration, flocculation, coagulation, precipitation and different sorption techniques (Haug et al., 1991; Lee et al., 2015; Fatima et al., 2017). In addition, the conventional aerobic processes are unable to reduce COD substantially. MFC technologies are able to convert chemical energy directly to electricity through a biological pathway (Zhang et al., 2020). In MFC microbes, e.g., Geobacter sulfurreducens, Rhodopseudomonas palustris, Shewanella putrefaciens, Pseudomonas aeruginosa (Vilela et al., 2020) and their enzymes can be used for electricity generation from the oxidation of organic matter into electrical energy and have emerged as a sustainable solution for both electricity or hydrogen generation (Zheng et al., 2015). Therefore, the MFCs are emerging worldwide driven by the promise of clean and renewable energy with lower sludge production and energy consumption from various wastewaters particularly from textile and dyeing industry (Fazal et al., 2019). In biological treatment, the reductive cleavage of azo bond occurs via bacterial enzyme azoreductase (Fernando et al., 2018). In AO5, the azo bond exists in the para-phenyl position to a sulphonated electron withdrawing group (Figure 1). This configuration helps to withdraw of electrons from dye compound during redox reactions. Cleavage of azo bond to the corresponding aromatic amines occurs by the electrophilic attack of the electrons supplied from the oxidation of organic substrates (Eq. 1).
In this study, electrons generated from acetate oxidation by a Geobacter Sulfurreducens biofilm in MFC (Eq. 2) are either transferred by its respiratory chain to the biofilm support and used in the oxygen reduction reaction (ORR) at the cathode (Eq. 3) or is consumed by the AO5 reduction reaction (Eq. 1). The azo dye reduction under anaerobic conditions with the help of azoreductase involves transfer of four-electrons (reducing equivalents), i.e., proceed through two stages at the azo linkage and in each stage two electrons are transferred to the azo dye. Therefore, the azo dye acts as a competitor electron acceptor, resulting in dye degradation.
An alternative route of reaction proposed (Liu et al., 2009) is reduction of dye at the cathode, is triggered by the peroxide produced from incomplete ORR. The process is inefficient due to loss of available electrons during transfer of electrons from anode to cathode. Moreover, the distance between membrane and cathode enhances substantial increase in the internal resistance of MFC. However, the use of MFC for degradation of azo dyes at the anode in a single chamber MFC is not direct as the cleavage of the azo bond is a reduction reaction (Madigan and Martinko, 2006; Sun et al., 2011; Kong et al., 2015). Hence, azo bond is cleaved at the bioanode by a side reaction consuming electrons released by the oxidation of the substrate (Lovley, 2006)
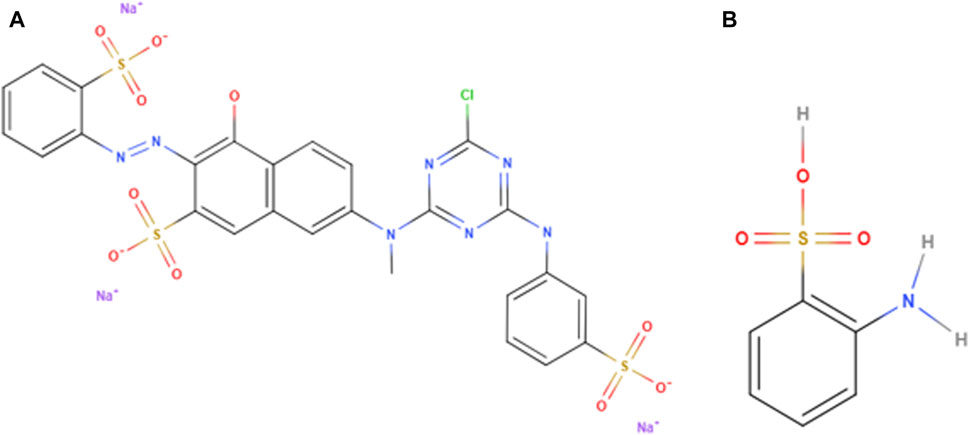
FIGURE 1. Chemical structures of model pollutant dye.(A)Acidic orange 5 and its degraded product (B) 2-aminobenzenesulfonicacid.
To the best of our knowledge a novel electrospun lignin based bioanode has not been investigated for anaerobic bioelectrochemical degradation for complex ring structure of AO5 so far (Baker and Hosseinaei, 2014). Therefore, in current study the anaerobic degradation of AO5 and reduction in COD using EL bioanode based MFC was examined. The air cathode was prepared by a pyrolyzed macrocycle mixture (PMM) serving as a catalyst layer and a highly wet-proofed carbon with polytetrafluoroethylene (PTFE) as a diffusion layer supported on Ni mesh, commonly called GDE, gas diffusion electrode (Kiros et al., 2004; Kiros et al., 2006). To further reduce cost and internal resistances, a membrane was not used. In contrast, a conventional glass fiber separator was used to separate the electrodes and hinder a biofilm to be formed directly at the cathode. In the single chamber MFCs, cathodes did not require active aeration during degradation of the dye. It was operated in a continuous-flow and oxygen in the air can passively diffuse through the cathode and involve in the reaction of oxygen reduction. Therefore, these reactions are considered to be one of the most interesting approaches for textile wastewater treatment. Geobacter sulfurreducens, a gram negative metal reducing bacterial strains was selected for the anodic biofilm because it is capable of exchanging electrons with its extracellular environment (Fernando et al., 2013; Illergård et al., 2015). Extracellular electron transfer was accomplished by means of electrically conductive pili on the surface of the Geobacter that can be attached to the electrode surface and enhanced current generation. Furthermore, these microbes (Illergård et al., 2015) completely oxidized the organic compound to carbon dioxide and recovered over 90% of the available electrons from these compounds as electricity in MFC (Fernando et al., 2014). There are many factors affecting the MFC performance. In this study, the impact of various operating conditions was investigated to enhance the bioelectrochemical treatment of textile wastewater. The effects of dye and carbon substrate (acetate) concentration as well as conductivity enhancers (auxiliary salts) on current generation were investigated by polarization curves. In addition, the decomposition of the organic species and the degradation of AO5 along with its degraded products (2-aminobenzenesulfonic acid) were determined by chemical oxygen demand (COD) analysis, UV-Vis spectrophotometry and high-performance liquid chromatography (UV-HPLC) techniques. SEM and TEM images were also used to find out the biocompatibility of Geobacter sulfurreducens on lignin-based electrospun carbon felt anode and the morphology of the cathode.
Materials and Methods
Chemicals and Bacterial Strains
The dye AO5 (Cibacron Brilliant Orange AldrichCPR) and analytical grade aromatic amine 2-aminobenzenesulfonic acid were purchased from Sigma Aldrich (United States) and was used without further purification. The chemical structures are shown in Figure 1. The reagent kit for COD analysis was purchased from Christian Berner AB (Sweden). The bacterial strain Geobacter sulfurreducens (DSM No. 12127) was procured commercially from DSMZ collection (Germany).
MFC Design and Operation Conditions
An air-cathode single-chamber MFC was designed and fabricated. The cell house was fabricated by Plexiglas having a capacity of total volume 72 ml (6 × 6 × 2 cm inner volume). The observed volume of the MFC was 62 ml after fabrication with electrodes and configuration as shown in Figure 2. The anode consisting of a lignin-based electrospun carbon fiber felt was used for the first time in this application. The electrospun carbon fibers were made from a solvent extracted LignoBoost softwood kraft lignin (Baker and Hosseinaei, 2014). The sequential solvent extraction was used to separate high molecular weight fraction of the lignin which is suitable for electrospinning of lignin, without using any additive. The lignin was dissolved in a solvent mixture of dimethylformamide/methanol (80/20 v/v) at concentration of 42% (w/w). The electrospinning voltage was 18 kV which was generated by a Glassman high voltage power supply. The feeding rate of the dope solution was 1 ml/h and the distance between needle and collector was 16 cm. A MTI tube furnace (OTF-1200X) was used for conversion of lignin fibers to carbon fibers. The as-spun lignin fibers were first oxidatively thermo stabilized by heating to 250°C at a rate of 0.5°C/min and then holding for 30 min at 250°C. The stabilized fibers were carbonized by heating from room temperature to 250°C at a rate of 10°C/min, followed by heating from 250 to 600°C at a rate of 3°C/min, and finally heating from 600 to 1,000°C at a rate of 10°C/min and holding for 15 min at the final temperature, under a nitrogen flow of 0.3 L/min. The average diameter of the resulted carbon fibers was 560 ± 125 nm.
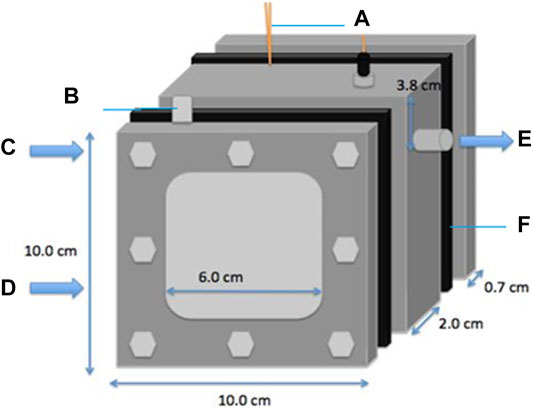
FIGURE 2. Air cathode single chamr fuel cell reactor having (A) Lignin based carbon anode (B) Catalyst on carbon-PTFE cathode (C) hole for capilary reference electrode (D) hole for inflow of anolyte (E) hole for outflow of anolyte (F) Rubber gaskets.
The felt had a geometrical surface area of 36 cm2 and Brunauer-Emmett-Teller surface area (BET) of 1.72 ± 0.038 m2g−1 with a thickness enough to sustain for long period of MFC operation (6 months); and was placed in the center of the cell. A titanium wire (99% purity, diameter 0.25°mm, and resistivity 42.0 µΩcm−1 at 20°C, Sigma-Aldrich) was used to connect it to the external circuit. Lignin-based carbon felt was soaked in ionized water for 24 h prior to its introduction into the cell. The anode was faced to the cathode in which oxygen, passively diffused from air, was reduced. The cathode was composed of PMM, acting as a catalyst layer and a wet proofed carbon with PTFE was used as the diffusion layer (Kiros et al., 2004; Kiros et al., 2006). The 0.7 mm thick diffusion layer was made up from a mixture of activated carbon black (40 wt. %) and PTFE (60 wt. % dispersion). The GDE with the active layer, having a thickness of 0.5 mm, was composed of 20 wt. % PPM on Vulcan XC-72 and to 15 wt. % of PTFE (60 wt%). Nickel wire screen (60 mesh) was used as an electrically conductive collector and the diffusion layer was first rolled on it followed by the active layer, both compressed at 150 kg/cm2 and sintered at 320°C for 30 min in nitrogen atmosphere. A glass fiber separator (Glass Microfiber Filters, borosilicate glass circles, diameter 90 mm, thickness 0.26 mm, pore size 1.6 µm, Whatman TM 1820-090) was used between the electrodes to reduce cathode biofouling and oxygen intrusion as well as to avoid short-circuiting. The cell was made to be leak-tight and sealed with rubber gaskets. A two-channel peristaltic pump (Watson-Marlow 400FD/D2) was also used to provide a constant flow rate of 0.2 ± 0.05 ml/min (hydraulic retention time (HRT): 5 h) of anolyte solution through two tubes made of bioprene (0.5 mm inner d, 1.0 mm wall). The cell was kept at a constant temperature of 30°C at a neutral pH, stirred at 150 rpm and provided with N2 bubbling (0.1 ml/min, 1.013 bar) in the reactor solution.
Biofilm and Medium
Geobacter sulfurreducens is a rod shaped exoelectrogenic bacterial strain and is used as a catalyst in the microbial fuel cell with Geobacter nutrient media (DSMZ medium no. 826) as the anolyte solution. Nutrient medium was composed of 1.50 g NH4Cl, 0.60 g Na2HPO4, 0.10 g KCl, 0.80 g NaC2H3O2, 10 ml trace element solution (DSMZ medium no. 141), 10 ml vitamin solution (DSMZ medium no. 141), 2.50 g NaHCO3, and 8.00 g Na2C4H2O4 in 980 ml distilled water. The prepared medium was autoclaved at 120°C for 20 min. After autoclaving the bicarbonate, fumarate and vitamins were added in the medium in an anaerobic chamber and its pH was adjusted to 7. Before use in the MFC, the medium was purged with 100% N2 (0.1 ml min−1) for 30 min to make it anoxic. Different organic load of AO5 were added and responses in terms of polarization and degradation were studied in MFC. The effect of ionic strength was studied by adding common auxiliary salts, e.g., Na2SO4.10H2O and NaCl (2% w/v, 1:1 ratio) to the anolyte solution (Fernando et al., 2013).
Prior to inoculation in the electrochemical cell, Geobacter sulfurreducens was cultured in the fumarate-containing growth medium and 10 mM acetate under anaerobic conditions at 30°C in the nutrient growth medium DSMZ 826 under continuous bubbling of nitrogen gas for 2 weeks (2 subcultures) until an optical density (OD620) of acclimatized bacterial culture reached 0.8 absorbance. Thereafter, Geobacter culture was acclimatized and adapted to the dye in the presence of AO5 (5 ppm) before inoculation in the MFC. The biofilm was allowed to develop on the electrode and the open circuit potential (OCP) was monitored for about 2 months. The anode solution was refreshed when the voltage dropped to 0.1 V by the addition of fresh nutrient medium having 10 mM acetate as a substrate.
The biofilm was examined after MFC operation by scanning electron microscopy (SEM). A piece of 1.0 × 1.0 cm2 of anode sample was cut and fixed for 2 h at room temperature in 5% glutaraldehyde in PBS buffer solution. After that, the sample was dried by submerging it for 10 min in 70 and 95% ethanol and finally in acetone for 15 min at 4°C (Illergård et al., 2015). After drying, the sample was coated with 22 nm thick layer of Pt/Pd and morphology was analysed using SEM (Hitachi S-4800).
Electrochemical Analysis
The voltage difference between the anode and cathode across an external resistance (decade resistor box, Swema) was measured for every 10 min using a Hewlett-Packard Multimeter (3468B). Polarization was performed once the voltage stabilized after feeding the MFC. The polarization curves were obtained for variable anolyte composition by switching external resistance from 1,100 to 10 Ω. The voltage of the MFC was recorded and the current was calculated from the resistances according to Ohm’s law I = V/R. The power densities and current densities were calculated based on the geometrical area of the electrodes, i.e., 36 cm2. The MFC performance with time was measured at a constant load of 100 Ω external resistance. The MFC was operated in a continuous flow rate of 0.2 ± 0.05 ml min−1 having HRT of 5 h. The concentrations of textile dye were investigated as 20, 40, and 80 ppm. However, the effect of carbon substrate (acetate) with different concentrations (800, 1,200, 1,600, and 2,000 ppm) were analysed along with the extra conductive salt concentration in Geobacter nutrient growth medium. An MFC reactor was operated in an open circuit configuration without load before each experiment for 3 h to avoid the effect of previous experiment in order to attain the active biofilm.
COD Removal and Decolourization of Wastewater
The samples from the MFC effluent were collected every day. Before analysis of the effluent, the solution samples were first centrifuged (6,500 rpm, 10 min) and filtered through a PTFE membrane filter (0.42 µm) in order to eliminate the suspended biomass. The decolourization of AO5 chromophore was measured using an ultraviolet-visible spectrophotometer (UV-2550) by measuring absorbance at maximum wavelength of 483 nm. The AO5 concentration of the sample at 483 nm was determined using a standard calibration curve. The percentage of dye decolourization is measured by Eq. 4.
where AC is the absorbance of the control sample and AT is the absorbance of the test samples. The changes in the absorption peaks in the wavelength range between 200 and 800 nm was recorded and analysed further by UV-HPLC.
COD of the samples was determined by using the photometric method. Test reagent kit C4/25, 25–1,500 mg.L−1 (Weilheim, Germany, WTW) for COD measurement was purchased from Christian Berner AB (Sweden). It contained 2.8 ml of standard concentration of sulphuric acid, potassium dichromate, mercury (II) sulphate. The COD analysis was performed by appropriate dilutions of the test samples in deionized water. Diluted sample (100 times) of 3 ml was inoculated in COD test vial and was allowed to digest at 150°C for 2 h in COD digester (CR4200, WTW). After cooling at room temperature, absorbance and concentration of total carbon were measured in COD spectrophotometer. The formula for COD measurement is shown in Eq. 5 (Photolab 6600UV-vis, WTW) [Haug et al. 1991].
Identification of Metabolites Using UV-HPLC
For the UV-HPLC analysis, the supernatant was adjusted to pH 2 for precipitating the protein content before centrifugation and filtering to get the metabolite extracts. The metabolites in these samples were extracted into an equal volume of ethyl acetate. The extract was concentrated by rotary evaporation for 2 h at 50°C and dried over anhydrous sodium sulphate in desiccators to obtain crystals. The crystals were then dissolved in 1 ml of methanol (Fernando et al., 2014). The extracted metabolites were analysed by using UV-HPLC (Ultimate 300). The HPLC system was equipped with a Hamilton PRP-C18 HPLC column 5 µm particle size (L*I.D = 150 *2.1 mm, stainless steel). Detection of metabolites was performed at 290 nm using a variable wavelength detector (ultimate 3000). The mobile phase was 0.05% (v/v) formic acid in acetonitrile (mobile phase-A) and HPLC grade water (mobile Phase-B). A linear gradient of 10–90% mobile phase-A (0.05% formic acid in acetonitrile) was used over 20 min after equilibration for 1 min prior to injection (Fernando et al., 2014). The sample injection volume was 20 μl at a flow rate of 0.8 ml min−1. Quantification of the reductive degradation products of AO5 were subjected to HPLC along with external standard such as 2-aminobenzene sulfonic acid. The retention time (Rt) of the standard compound was compared with the retention time (Rt) of the degraded sample to find similarity in metabolites with aromatic amines.
Results and Discussion
Electrode Structure and Biofilm Development
In Figure 3A, a SEM image of the electrospun lignin-based carbon fiber anode shows the surface morphology with densely packed fibers and elongated thread like structure with highly porous texture, acting as a substrate to host microbial growth. The morphology of the active catalyst with PPM on carbon in Figure 3B by TEM shows nanoscale sizes and agglomerated particles of both the pyrolyzed cobalt tetraphenylporphyrin (CoTPP) and perovskite (La0.1Ca0.9 MnO3) of the mixed catalysts on well-distributed porous carbon. Particle sizes range from 15 to 120 nm, where the bigger particles are mainly ascribed to the perovskite.
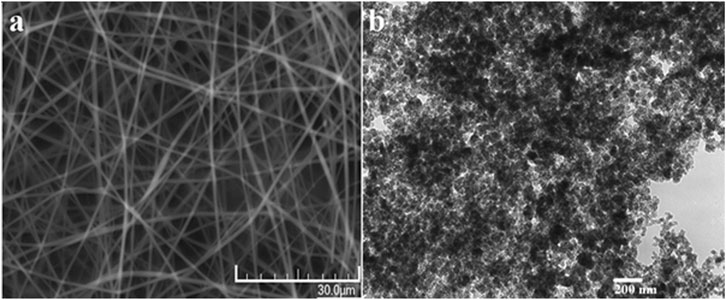
FIGURE 3. Microscopy of electrodes (A) SEM image of electrosorum lignin anode before biofilm development (B) TEM image of catalyst on carbon.
The bacterial culture of acclimatized Geobacter sulfurreducens culture (10%) is added in the reactor solution to develop a biofilm on electrospun lignin anode under controlled anaerobic conditions. For the carbon–based anode, the direct electron transfers from the exoelectrogenic microbe to the anode occurred via extracellular conductive microbial pili (electrically conductive nanowires). Microbes grown on electrospun lignin anode were monitored by measuring open circuit potential (OCP). The maximum cell voltage in the MFC was obtained at open circuit because the external resistance was infinite. The MFC was allowed to develop a biofilm during the period of 80°days at 30°C as shown in Figure 4. During this period, the addition of acetate led to the increase of voltage. Maximum 0.76 V was achieved at 24th days of inoculation. This voltage dropped continuously and reached 0.1 V at 43rd day. In order to regain voltage and keep biofilm activated on 42nd and 62nd days, acetate was added. At each cycle of substrate addition and consumption, maximum growth peaks were observed, which was evident from corresponding voltages of 0.76, 0.59, and 0.6 V. The trend for the OCP peaks were observed quite similar to a previous study, where the peaks were likely to be generated by the suspended bacteria while consuming substrates (Sato et al., 2009). The open circuit potential (OCP) was around 0.0.76 V in the presence of acetate and bacteria; which was better than typical value for MFCs using a carbon-based anode (Cao et al., 2010). The biofilm of Geobacter have nanowires that act as a conductor by electron delocalization due to π-π orbitals of aromatic amino acids of the pili proteins (Sato et al., 2009). Therefore, as the bacterial biofilm was formed electrons, protons and CO2 were generated during oxidation of the acetate (Song and Jiang, 2011; Malvankar and Lovley, 2014).
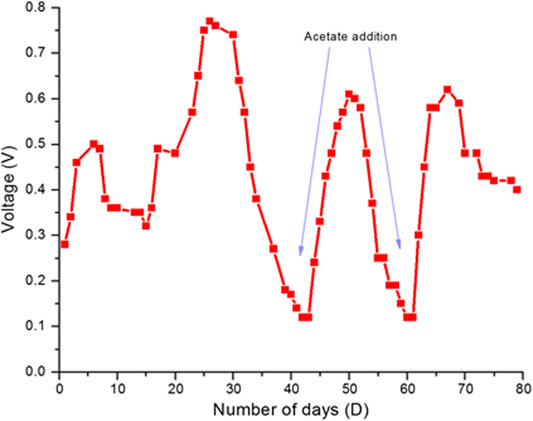
FIGURE 4. Open circuit potential of MFC during biofilm development.
The carbon-fiber anode was recovered from the MFC and analysed by SEM after 180 days operation of MFC. A micrograph of the carbon fiber felt electrode is shown in Figure 5. The SEM image of the fiber felt was found to be coated by rod-shaped Geobacter sulfurreducens bacterial cells of 1–2 µm in length. The electrode surface revealed that the bacterial community was densely coated and well distributed on the electrode surface.
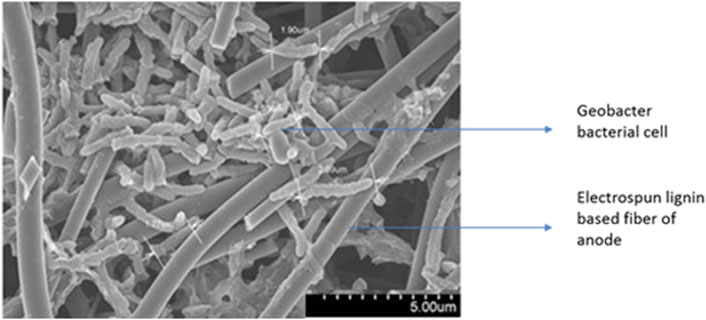
FIGURE 5. SEM image of Geobacter sulfureducens biofilm grown on electrospun lignin anode.
Performance of the MFC Under Different Operating Conditions
The polarization measurement of a cathode–anode configuration represents the overall MFC performance such as composition of anolyte with and without dye and various losses including mass transport, Ohmic and activation losses. IR drop in or between the different components of the cell and transport effects influence the MFC performance. The performance of the cell in terms of I-V curves were measured using fixed applied external resistances, in the absence of dye. Figure 6A shows the initial performance at the three anolyte states; the sole buffered media; acetate with buffered media; and acclimatized bacteria with acetate without dye loadings.
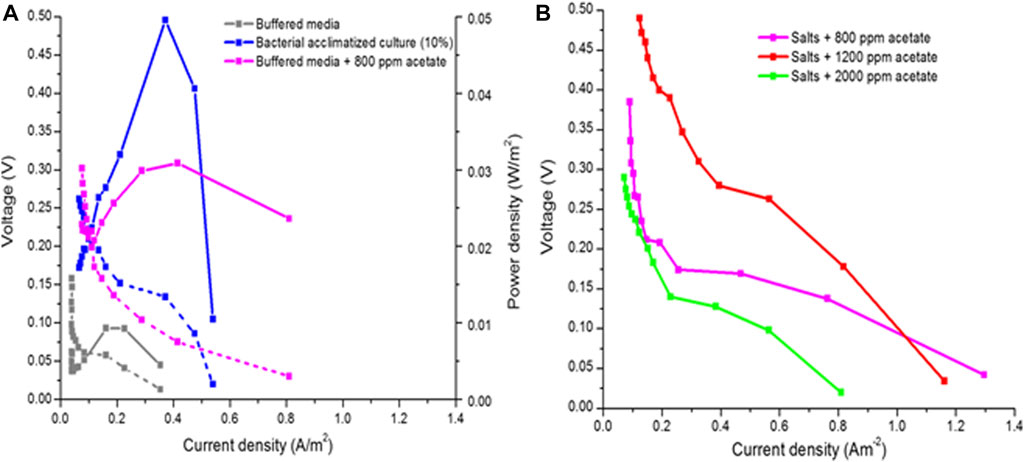
FIGURE 6. 1–4 curves and power density curves of MFC (A) with buffered media alone, with acetate concentration of 800 ppm and with additional suspended bacterial culture of 10% at 30°C and 5HRT (B) Imoroved performance with additional salts (NaCl + Na2SO4) and acetate.
With increasing current densities, i.e., decreasing external resistance from 1,100 to 10 Ω, a significant polarisation was observed in all cases. The rapid loss at low currents was related to limitations imposed on the electrode reaction kinetics and electron transfer, in line with observations (Menicucci et al., 2006). At moderate resistance of 100 Ω (Figure 6A), the current density was stabilized with only buffered media and observed in between 0.1 and 0.2 Am−2. The performance was increased in the presence of suspended bacteria and with additional acetate of 800 ppm, indicating that the biofilm activity was a major limitation to the performance. In the case of the acclimatized culture, the curve bended off at 0.53 Am−2, which was typical for concentration polarisation and indicative of a limited supply of the acetate for the biofilm as it was consumed by the suspended bacteria. The current densities obtained was 0.39 Am−2 for the acclimatized culture and 0.3 Am−2 for the media with 800 ppm acetate and the respective power density peaks obtained were 0.049 and 0.03 Wm−2, respectively.
One of the issues with MFC is the high Ohmic resistance due to the low electrolyte conductivity of the neutral media solution. To improve the performance, the ionic conductivity of anolyte was improved by adding 2% auxiliary salts (1 wt. % NaCl: 1 wt% Na₂SO₄ *6H₂O). Inorganic salts of chloride, sulfate and metal ions are commonly found in the wastewater of dyeing industry (Patel et al., 2018). Naturally, the electroactive bacteria are found in sea water and are expected to grow in saline environment. Thus, as a second step the effect of acetate substrate concentration along with salts was evaluated. It was observed (Figure 6B) that the performance of the MFC was enhanced; the current density reached to 0.49 Am−2at 0.26 V with media having 2% salts and 800 ppm acetate. Similar to these findings (Liu et al., 2005), reported that high current densities were achieved in single chamber MFCs inoculated with anaerobic mixed cultures at 0.6–2.3% salt contents. According to previous studies, salts provided a technical support to sustain more charge in MFCs (Du et al., 2015; Zhang et al., 2020). The electrochemical activity was also significantly enhanced and biofilm activity at low currents was improved by increasing the acetate concentration to 1,200 ppm in the anolyte. However, 2,000 ppm acetate caused negative effects on MFC performance because of extra unused substrate resulting in a drop of activity and thus, a much poorer performance was observed. The result clearly showed that an active growth environment for Geobacter culture was created, which stimulated the efficiency of MFC toward the generation of electricity.
Performance of the MFC With Different Organic Dye Loadings
The electrochemical performance of the MFC under different loadings of AO5 in the range of 20–80 ppm along with 800 ppm acetate was studied (Figure 7A). In comparison with pure 800 ppm acetate (Figure 6A), the electrochemical performance was observed about same for 20 ppm dye with maximum current density of 0.36 Am−2, which was noticeable as with pure 800 ppm acetate. However, the decrease was significant at higher concentrations, indicating that electron transfer from the oxidation reaction of acetate was hindered by another process affecting the cell voltage. As the cleavage of the azo bond is a reduction reaction, it will consume electrons produced from the oxidation of acetate by the anaerobic microbes. The shuttling of electrons towards azo dye instead of the anode lowers the cell potential. The decrease in polarization activity at higher concentrations of AO5 observed can be explained by the fact that the electrons were consumed by the reduction of the dye to a larger extent at higher concentration with the drop of OCP from 0.36 V at 20 ppm to 0.26 V at 80 ppm.
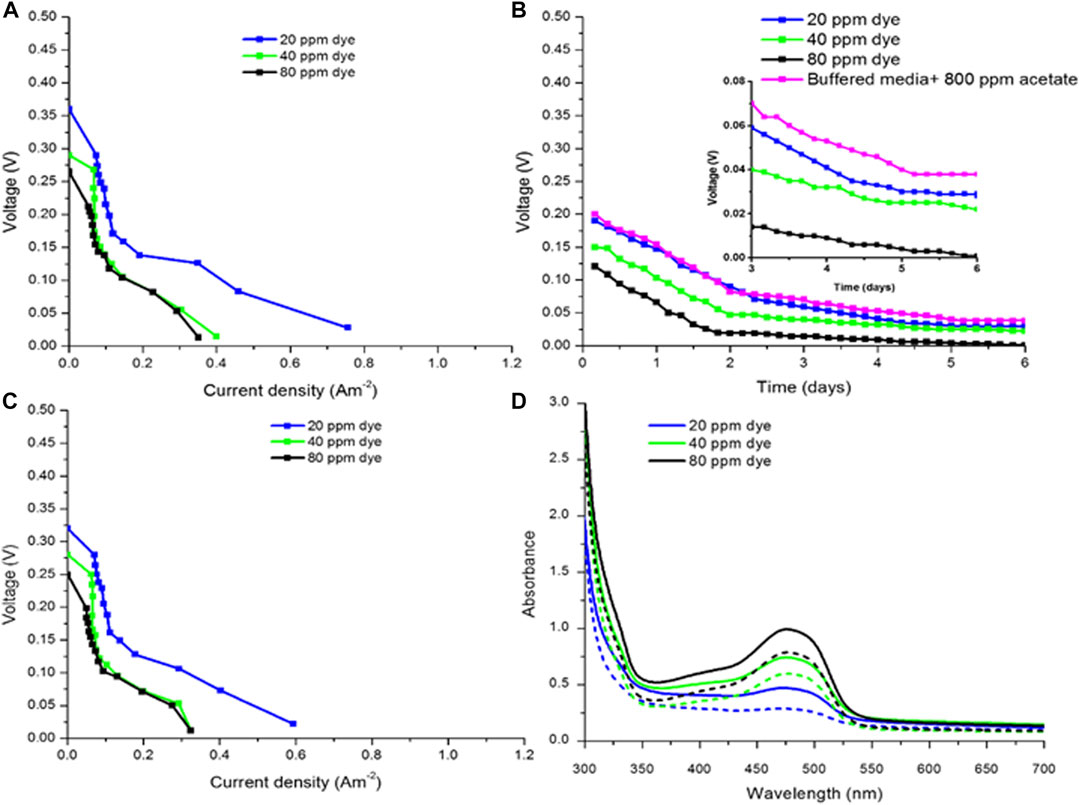
FIGURE 7. MFC performance and dye decomposition with 20–80 ppm of A05 in the presence of 800 ppm acetate (A) 1–4 (dotted lines) and power curves (lines) B)Performance of MFC at constant load of 100Ω (C) Loss in MFC performance before (thick lines) and after constant load in (B) (dotted lines) (D) UV-vis spectra of A05 at λ483 nm before (thick lines) and after dotted 1 h load at 100 Ω.
The development of cell voltage at a constant load of 100 Ω of the MFC over time 6 days) for the three different dye loadings is shown in Figure 7B. This load, being the 10th point in the sequence taken from high to low resistances was selected for constant operation. It is known that the reductive decolourisation kinetic constant is higher at a moderate load, at which the electron transfer of the anodic microbes is more efficient and participates in the dye degradation kinetics (Menicucci et al., 2006). The graph shows the linear drop of performance with time irrespective of dye concentration even in the absence of dye during the first 2 days. After this period, the curve declines at a slower rate. A similar decline with time was observed for all conditions even in the absence of dye. This indicates that the biofilm activity losses are not dependent specifically on the dye loadings. After 3 h of constant load, the I-V curves (Figure 7C) showed slightly lower performance but the changes were not significant. The degradation of AO5 during the MFC operation was investigated by UV-visible spectroscopy. The spectra before and after 1 h of MFC operation at 100 Ω and different concentrations are shown in Figure 7D. This absorbance peak of AO5 at 483 nm decreased with operation along with dye concentration. After operating MFC for 1 h, the peak areas were decreased to 36% of 20 ppm dye with 7.2 ppm decrease in concentration, 18% of 40 ppm dye with 7.2 ppm decrease in concentration, 27% of 80 ppm dye with 21.6 ppm decrease in concentration respectively. This clearly shows that the azo dye is effectively degraded during the simultaneous generation of electricity in this system.
It is expected that MFC performance is enhanced in the presence of salt and acetate during the decolourization of 40 ppm AO5 dye. The effect of salinity and acetate concentration on potential, current density and power density during the first day of operation is shown in Figure 8A. By adding 2% salt to an anolyte (40 ppm dye and 800 ppm acetate), the maximum current density was increased from 0.22 Am−2 to 0.34 Am−2at 100 Ω showing the benefit of decreased ohmic resistance on the general performance.
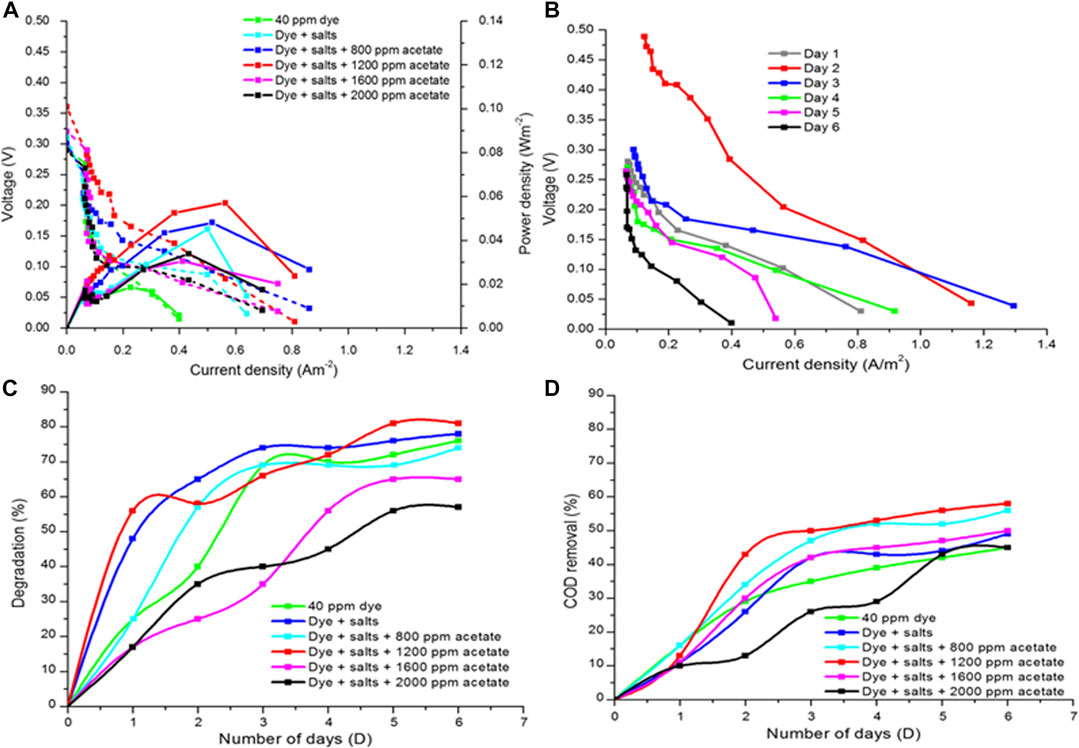
FIGURE 8. (A) MFCI-5 curves measured 1 st day with 40 ppm dye and 800–2000 ppm acetate loading, with and without 2% salt addition (B) Performance development for each day after constant load at 100 ohm operation with circulating anolyte for an MFC with 40 ppm dye, 1200 ppm acetate, and 2% salt addition (NaCl+Na2SO4) (C) Percentage decolourisation of AO5 from UV-vis for the curves in (B) and (D) percentage of COD removal ovet time.
Comparing the effect of acetate on the polarization curves at 100 Ω, the optimal performance was reached with an acetate concentration of 1,200 ppm, for which the current density increased to 0.39 Am−2 and a peak power density of 0.059 Wm−2as shown in Figure 8A. For 1,600 ppm, the current density and power density dropped to 0.26 Am−2 and 0.03 Wm−2, respectively. However, at even higher acetate concentration of 2,000 ppm, lower performance was registered, indicating that the substrate oxidation by anodic biofilm was halted. The high concentration of acetate might be increased the proton concentration within the immobilized layer during acetate oxidation and led to reduction in enzymatic activities (Menicucci et al., 2006). The OCP values plotted at the Y-axis followed the same trend at different anolyte compositions as discussed previously. To summarise, additional acetate loading favoured efficient growth of biofilm, resulting in enhanced electron generation and transfer at the anode which was evident from high voltage and current response in the cell.
The voltage and current densities of biofilm was measured every day at various resistances of 10–1,100 Ω. Anodic biofilm was exposed to a specific resistance for 10 min before moving to next higher resistance (Figure 8B). The measurements were completed in 140 min each day and biofilm were kept at 100 Ω for the rest of the time. Every day, potentiometric analysis was conducted at the same time while repeating the same procedure. The MFC performance trend during 6 days of operation at continuous circulating condition of anolyte having composition of 40 ppm dye, 1,200 ppm acetate and 2% auxiliary was measured. The trend shows the large improvement in current density between day 1 (0.4) and 2 (0.59 Am−2) at 100 Ω. The current densities showed a continuous decline thereafter. High current density at second day was due to electrochemical activation of the bacteria, which was anticipated by the increased current density. However, electrochemical activation of bacteria was reduced due to the consumption of substrate with time.
The decolourization of AO5 and the removal of COD during MFC operation are shown in Figures 8C,D, respectively. The decolourisation follows the same trend as the electrochemical performance, showing higher decolourisation efficiency in the presence of salt and acetate concentration below 1,600 ppm. At the optimum condition (1,200 ppm acetate and 2% auxiliary salts), the decolourization of AO5 on first day was 58% and at sixth day the removal was 81%. The COD removal efficiency was also higher at these optimal conditions. The COD concentration was reduced from 11,600 to 4,800 mgL−1 during 6 days, corresponding to around 58% of COD removal. The COD removal (Figure 8D) was less effective in comparison with the decolourisation, indicating that the dye and acetate were only partially decomposed in the MFC. It is likely that the remaining COD in the anolyte is due to the residuals of degraded metabolite of the AO5 such as aromatic amines (Fatima et al., 2017). A better removal of COD may have required a second step of treatment in aerobic environment for further degradation of the AO5 metabolites. An attempt was made to study the effect of decreasing the HRT from 5 h (0.2 ml min−1) used above to the double 10 h (0.1 ml min−1), however significant changes were not observed.
The substantial drop of current density (Figure 8B) at 10 Ω for the anolyte having 1,200 ppm acetate (dye with salts) from day 4 (0.94 Am−2) to day 5 (0.55 Am−2) was noticed. Similar trend in decolourization was detected (Figure 8C). Sharp increase in decolourization from 72% at day 4–80% at day 5 was observed. However, significant change in COD removal was not identified.
Evaluation of the Metabolites and Byproducts
The drastic decrease in current density and increase in decolourization predict that an unusual change may have appeared in anolyte or in the dye (Performance of the MFC With Different Organic Dye Loadings). In order to illustrate the unexpected decrease in current density and increase of decolourization after day 4, UV-HPLC characterization of anolyte at different time periods was conducted. The effluent was therefore studied with UV-HPLC at 290 nm along with a standard 2-aminobenzensulfonic acid for comparison. The reference amine found some features between 0.8 and 1.0 min and peaks were appeared after 3.3 min of retention time (Figure 9A), while the anolyte containing the intact dye (Figure 9B) had peaks found at retention time of 0.2, 0.4, 0.6, and 1.35 min. Moreover, the chromatogram confirmed the decolourization by substantial decrease in AO5 peaks from day 1–4. At day 4, new peaks appeared at the retention time of 2.9 and 3.3 min. These are comparable with the peaks of 2-aminobenzenesulfonic acid reference with the same retention time. This indicates that the main degradation mechanism of the dye is the breakage of the azo bond, producing the corresponding amines. It is likely that the amines produced have a negative effect on the biofilm activity. However further studies are required to explore biofilm activity in the presence of dye.
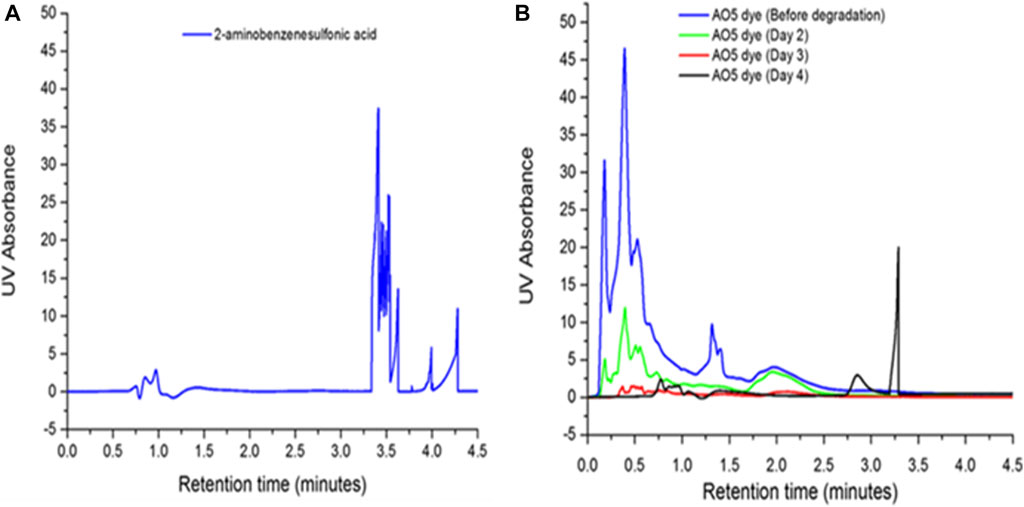
FIGURE 9. UV-HPLC spectrum (A) Standard peak of 2-aminobenzenesulfonic acid (B) Degradation peaks of AO5 dye and apperance of new metabolities.
The current study depicts that electrospun lignin-based carbon fibre felt is a suitable electrode support as a bioanode in MFC. The performance is enhanced by additional salt, decreasing the ohmic drop in the cell, but more optimisation concerning the biofilm, anolyte composition, cell design and anolyte flow conditions is needed to maintain an even continuous performance of the cell. It is shown that this MFC can function in the presence of toxic azo dyes AO5. During operation 81% decolourisation and 58% COD removal after 6 days was achieved. This indicates that the MFC can be used for textile wastewater remediation for aat least first step of secondary treatment. In the presence of 40 ppm AO5, 1,200 ppm acetate, 2% auxiliary salts, a maximum performance measured was 0.59 Am−2 at a load of 100 Ω and 1.28 Am−2 at 10 Ω and a peak power density of 0.12 Wm−2 (graphical abstract), which is appreciable in comparison to reported performances of MFC used for other dyes (Table 1). However, the initial substantial activation polarisation of about 0.1 V is significant and likely due to the metabolic activity and adaptation of the bacterial strains at the anode. Whether the dye in itself or the products produced has a poisoning effect on the bacteria and this is another aspect that has to be further investigated. It is possible that a longer inoculum and a mixed culture would improve the activity.
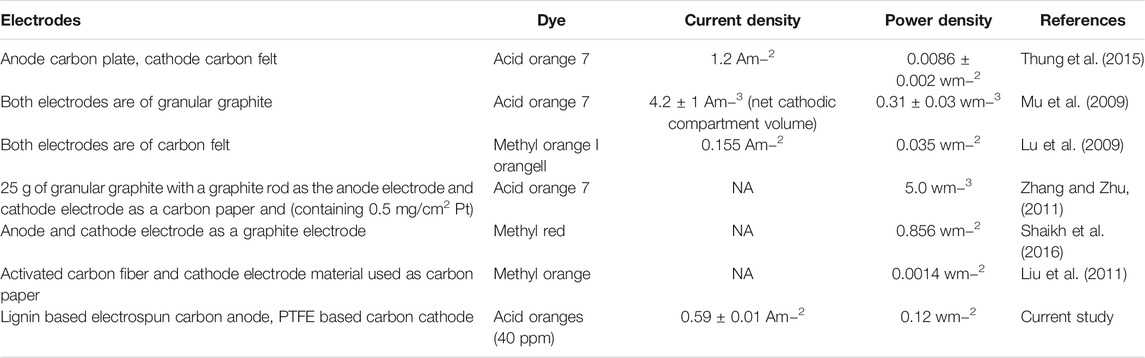
TABLE 1. Electrochemical performance of MFC during azo dye degradation in various reported studies.
According to various studies, the types and structures of dyes, working chambers in anaerobic sequential reactor, operating conditions, such as inoculum and co-substrates (formic acid, glucose, acetate, etc.), salinity, maximum temperature for growth of bacteria and catalysts are vital for decolourisation, COD removal and concomitant electric generation (Li et al., 2010; Sun et al., 2011; Fernando et al., 2013; Kong et al., 2013; Solanki et al., 2013; Fernando et al., 2018; Thung et al., 2018). The present study clearly emphasized the enhancement that can be achieved by increasing anolyte ion conductivity and by adjusting the substrate concentration to benefit the activity of the biofilm and hence the MFC performance. The general performance of the MFC in the absence of dye is satisfactory and well in comparison with other reported studies (Li et al., 2010; Kong et al., 2013; Solanki et al., 2013; Thung et al., 2018). However, the air-cathode based on non-precious metal active carbon is not attempted previously. Thus, optimum reaction conditions with bioreactors should be applied in order to decompose recalcitrant pollutants and increase the generation of electric power.
Conclusion
Fabrication and optimization of single chamber microbial fuel cell composed of porous carbon with PPM catalyst on carbon as cathode and novel bioanode for efficient removal of dyes and COD reduction has been demonstrated. The bioanode was prepared by depositing biofilm of Geobacter sulfurreducens on electrospun lignin-based carbon felt substrate. Exploiting advantages of the electrospun lignin-based fiber with the specific surface area, a superior performance has been achieved for dye removal. There is a competition between AO5 dye and anode to attract electrons generated during acetate oxidation. Enough electrons are not available to reduce all of the organic compounds of the dye at higher concentrations. The performance of MFC in terms of power density and dye decolourization was optimized by tuning the acetate concentration. Due to the competing azo breakage reduction reaction of substrate oxidation at the bioanode, higher concentration of dye results in significantly lower current density. In an anolyte composition of 40 ppm of AO5 and 1,200 ppm of acetate, the highest electrochemical performance was registered. At these conditions, the decolouration was maximized to 81% of AO5 with 58% reduction of COD within 6 days of operation. Using the high porosity bioanode electrode support, favourable for anchoring the Geobacter biofilm a peak power density of 0.12 Wm−2 could be reached, reflecting the significant potential of the single chamber anaerobic MFC to degrade recalcitrant azo dyes from wastewater.
Data Availability Statement
The original contributions presented in the study are included in the article/Supplementary Material, further inquiries can be directed to the corresponding author.
Author Contributions
MF conducted the experimental work, data collection, wrote the first draft of the article, while YK, RF, and RL contributed by writing some sections of the article, read, improved and approved the final version.
Funding
The authors declare that the Higher Education Commission, Pakistan and VR-SIDA research links, Sweden received funding during the course of the project.
Conflict of Interest
The authors declare that the research was conducted in the absence of any commercial or financial relationships that could be construed as a potential conflict of interest.
Acknowledgments
The authors would like to thank the Higher Education Commission, Pakistan and VR-SIDA research links, Sweden for providing research funding to the different parts of the project. Thanks to Dr Darren A. Baker and Alice Landmér at–RISE Bioeconomy, Sweden for providing the lignin-based carbon fiber felt anode material. Hyeyun Kim and Lara Kristin Stefansdottir are acknowledged for assistance with the SEM imaging.
References
Ahmad, R., Aslam, M., Park, E., Chang, S., Kwon, D., and Kim, J. (2018). Submerged Low-Cost Pyrophyllite Ceramic Membrane Filtration Combined with GAC as Fluidized Particles for Industrial Wastewater Treatment. Chemosphere 206, 784–792. doi:10.1016/j.chemosphere.2018.05.045
Baker, D. A., and Hosseinaei, O. (2014). High Glass Transition Lignins and Lignin Derivatives for the Manufacture of Carbon and Graphite Fibers. US Patent No 20140271443, 453 Application No. 14/215.
Cao, Y., Hu, Y., Sun, J., and Hou, B. (2010). Explore Various Co-substrates for Simultaneous Electricity Generation and Congo Red Degradation in Air-Cathode Single-Chamber Microbial Fuel Cell. Bioelectrochemistry 79 (1), 71–76. doi:10.1016/j.bioelechem.2009.12.001
Carliell, C. M., Barclay, S. J., Shaw, C., Wheatley, A. D., and Buckley, C. A. (1998). The Effect of Salts Used in Textile Dyeing on Microbial Decolourisation of a Reactive Azo Dye. Environ. Technol. 19, 1133–1137. doi:10.1080/09593331908616772
Du, Y., Feng, Y., Teng, Q., and Li, H. (2015). Effect of Inorganic Salt in the Culture on Microbial Fuel Cells Performance. Int. J. Electrochem. Sci. 10, 1316–1325.
Fatima, M., Farooq, R., Lindström, R. W., and Saeed, M. (2017). A Review on Biocatalytic Decomposition of Azo Dyes and Electrons Recovery. J. Mol. Liquids 246, 275–281. doi:10.1016/j.molliq.2017.09.063
Fazal, T., Saif ur Rehman, M., Mushtaq, A., Hafeez, A., Javed, F., Aslam, M., et al. (2019). Simultaneous Production of Bioelectricity and Biogas from Chicken Droppings and Dairy Industry Wastewater Employing Bioelectrochemical System. Fuel 256, 115902. doi:10.1016/j.fuel.2019.115902
Fernando, E., Keshavarz, T., and Kyazze, G. (2014). Complete Degradation of the Azo Dye Acid Orange-7 and Bioelectricity Generation in an Integrated Microbial Fuel Cell, Aerobic Two-Stage Bioreactor System in Continuous Flow Mode at Ambient Temperature. Bioresour. Technol. 156, 155–162. doi:10.1016/j.biortech.2014.01.036
Fernando, E., Keshavarz, T., and Kyazze, G. (2013). Simultaneous Co-metabolic Decolourisation of Azo Dye Mixtures and Bio-Electricity Generation under Thermophillic (50°C) and saline Conditions by an Adapted Anaerobic Mixed Culture in Microbial Fuel Cells. Bioresour. Technol. 127, 1–8. doi:10.1016/j.biortech.2012.09.065
Fernando, E. Y., Keshavarz, T., and Kyazze, G. (2018). The Use of Bioelectrochemical Systems in Environmental Remediation of Xenobiotics: a Review. J. Chem. Tech. Biotechnol 94. doi:10.1002/jctb.5848
Haug, W., Schmidt, A., Nörtemann, B., Hempel, D. C., Stolz, A., and Knackmuss, H. J. (1991). Mineralization of the Sulfonated Azo Dye Mordant Yellow 3 by a 6-Aminonaphthalene-2-Sulfonate-Degrading Bacterial Consortium. Appl. Environ. Microbiol. 57, 3144–3149. doi:10.1128/aem.57.11.3144-3149.1991
Illergård, J., Wågberg, L., and Ek, M. (2015). Contact-active Antibacterial Multilayers on Fibres: a Step towards Understanding the Antibacterial Mechanism by Increasing the Fibre Charge. Cellulose 22, 2023–2034. doi:10.1007/s10570-015-0629-8
Javed, F., Aslam, M., Rashid, N., Shamair, Z., Khan, A. L., Yasin, M., et al. (2019). Microalgae-based Biofuels, Resource Recovery and Wastewater Treatment: A Pathway towards Sustainable Biorefinery. Fuel 255, 115826. doi:10.1016/j.fuel.2019.115826
Kiros, Y., Pirjamali, M., and Bursell, M. (2006). Oxygen Reduction Electrodes for Electrolysis in Chlor-Alkali Cells. Electrochimica Acta 51, 3346–3350. doi:10.1016/j.electacta.2005.10.024
Kiros, Y., Quatrano, T., and Björnbom, P. (2004). Determination of the Thicknesses of the Active Layer and Cathode Limiting Currents in AFC. Electrochemistry Commun. 6, 526–530. doi:10.1016/j.elecom.2004.03.015
Kong, F., Wang, A., Liang, B., Liu, W., and Cheng, H. (2013). Improved Azo Dye Decolorization in a Modified Sleeve-type Bioelectrochemical System. Bioresour. Technol. 143, 669–673. doi:10.1016/j.biortech.2013.06.050
Kong, F., Wang, A., and Ren, H.-Y. (2015). Improved Azo Dye Decolorization in an Advanced Integrated System of Bioelectrochemical Module with Surrounding Electrode Deployment and Anaerobic Sludge Reactor. Bioresour. Technol. 175, 624–628. doi:10.1016/j.biortech.2014.10.091
Lee, D.-J., Chang, J.-S., and Lai, J.-Y. (2015). Microalgae-microbial Fuel Cell: A Mini Review. Bioresour. Tech. 198, 891–895. doi:10.1016/j.biortech.2015.09.061
Li, Z., Zhang, X., Lin, J., Han, S., and Lei, L. (2010). Azo Dye Treatment with Simultaneous Electricity Production in an Anaerobic-Aerobic Sequential Reactor and Microbial Fuel Cell Coupled System. Bioresour. Technol. 101, 4440–4445. doi:10.1016/j.biortech.2010.01.114
Liu, H., Cheng, S., and Logan, B. E. (2005). Power Generation in Fed-Batch Microbial Fuel Cells as a Function of Ionic Strength, Temperature, and Reactor Configuration. Environ. Sci. Technol. 39, 5488–5493. doi:10.1021/es050316c
Liu, L., Li, F.-b., Feng, C.-h., and Li, X.-z. (2009). Microbial Fuel Cell with an Azo-Dye-Feeding Cathode. Appl. Microbiol. Biotechnol. 85, 175–183. doi:10.1007/s00253-009-2147-9
Liu, R.-H., Sheng, G.-P., Sun, M., Zang, G.-L., Li, W.-W., Tong, Z.-H., et al. (2011). Enhanced Reductive Degradation of Methyl orange in a Microbial Fuel Cell through Cathode Modification with Redox Mediators. Appl. Microbiol. Biotechnol. 89 (1), 201–208. doi:10.1007/s00253-010-2875-x
Lovley, D. R. (2006). Bug Juice: Harvesting Electricity with Microorganisms. Nat. Rev. Microbiol. 4, 497–508. doi:10.1038/nrmicro1442
Lu, N., Zhou, S.-g., Zhuang, L., Zhang, J.-t., and Ni, J.-r. (2009). Electricity Generation from Starch Processing Wastewater Using Microbial Fuel Cell Technology. Biochem. Eng. J. 43 (3), 246–251. doi:10.1016/j.bej.2008.10.005
Maaz, M., Yasin, M., Aslam, M., Kumar, G., Atabani, A., Idrees, M., et al. (2019). Anaerobic Membrane Bioreactors for Wastewater Treatment: Novel Configurations, Fouling Control and Energy Considerations. Netherlands: Bioresource technology.
Madigan, M. T., and Martinko, J. M. (2006). in Brock Biology of Microorganisms. 11th ed. (Upper Saddle River, New Jersey (NJ): Pearson Prentice Hall), 1–20.Microorganisms and Microbiology
Malvankar, N. S., and Lovley, D. R. (2014). Microbial Nanowires for Bioenergy Applications. Curr. Opin. Biotechnol. 27, 88–95. doi:10.1016/j.copbio.2013.12.003
Menicucci, J., Beyenal, H., Marsili, E., Veluchamy, P., Demir, G., and Lewandowski, Z. (2006). Procedure for Determining Maximum Sustainable Power Generated by Microbial Fuel Cells. Environ. Sci. Technol. 40, 1062–1068. doi:10.1021/es051180lDemir
Mu, Y., Rabaey, K., Rozendal, R. A., Yuan, Z., and Keller, J. (2009). Decolorization of Azo Dyes in Bioelectrochemical Systems. Environ. Sci. Technol. 43 (13), 5137–5143. doi:10.1021/es900057f
Patel, U. D., Ruparelia, J., and Patel, M. (2018). Biodegradation of a Real Dye Wastewater Containing High Concentration of Total Dissolved Inorganic Salts (TDIS) in a Lab-Scale Activated Sludge Unit. J. Inst. Eng. India Ser. A. 99, 11–16. doi:10.1007/s40030-017-0260-9
Sato, C., Martinez, R. G., Shields, M. S., Gracia, A. P., and Schoen, M. P. (2009). Behaviour of Microbial Fuel Cell in a Start-Up Phase. Ijee 1, 36–51. doi:10.1504/ijee.2009.026441
Selvam, K., Swaminathan, K., and Chae, K.-S. (2003). Decolourization of Azo Dyes and a Dye Industry Effluent by a white Rot Fungus Thelephora Sp. Bioresour. Tech. 88, 115–119. doi:10.1016/s0960-8524(02)00280-8
Shaikh, J., Patil, N., Shinde, V., and Gaikwad, V. (2016). Simultaneous Decolorization of Methyl Red and Generation of Electricity in Microbial Fuel Cell by Bacillus Circulans NPP1. J. Microb. Biochem. Technol. 8, 428–432.
Solanki, K., Subramanian, S., and Basu, S. (2013). Microbial Fuel Cells for Azo Dye Treatment with Electricity Generation: A Review. Bioresour. Tech. 131, 564–571. doi:10.1016/j.biortech.2012.12.063
Song, T.-S., and Jiang, H.-L. (2011). Effects of Sediment Pretreatment on the Performance of Sediment Microbial Fuel Cells. Bioresour. Tech. 102, 10465–10470. doi:10.1016/j.biortech.2011.08.129
Sun, Y., Wei, J., Liang, P., and Huang, X. (2011). Electricity Generation and Microbial Community Changes in Microbial Fuel Cells Packed with Different Anodic Materials. Bioresour. Tech. 102, 10886–10891. doi:10.1016/j.biortech.2011.09.038
Tan, N. C., Borger, A., Slenders, P., Svitelskaya, A., Lettinga, G., and Field, J. A. (2000). Degradation of Azo Dye Mordant Yellow 10 in a Sequential Anaerobic and Bioaugmented Aerobic Bioreactor. Water Sci. Tech. 42, 337–344. doi:10.2166/wst.2000.0533
Thung, W.-E., Ong, S.-A., Ho, L.-N., Wong, Y.-S., Ridwan, F., Lehl, H. K., et al. (2018). Biodegradation of Acid orange 7 in a Combined Anaerobic-Aerobic Up-Flow Membrane-Less Microbial Fuel Cell: Mechanism of Biodegradation and Electron Transfer. Chem. Eng. J. 336, 397–405. doi:10.1016/j.cej.2017.12.028
Thung, W.-E., Ong, S.-A., Ho, L.-N., Wong, Y.-S., Ridwan, F., Oon, Y.-L., et al. (2015). A Highly Efficient Single Chambered Up-Flow Membrane-Less Microbial Fuel Cell for Treatment of Azo Dye Acid Orange 7-containing Wastewater. Bioresour. Technol. 197, 284–288. doi:10.1016/j.biortech.2015.08.078
Vijaykumar, M. H., Vaishampayan, P. A., Shouche, Y. S., and Karegoudar, T. B. (2007). Decolourization of Naphthalene-Containing Sulfonated Azo Dyes by Kerstersia Sp. Strain VKY1. Enzyme Microb. Tech. 40, 204–211. doi:10.1016/j.enzmictec.2006.04.001
Vilela, C., Cordeiro, D. M., Boas, J. V., Barbosa, P., Nolasco, M., Vaz, P. D., et al. (2020). Poly(4-styrene Sulfonic Acid)/bacterial Cellulose Membranes: Electrochemical Performance in a Single-Chamber Microbial Fuel Cell. Bioresour. Tech. Rep. 9, 100376. doi:10.1016/j.biteb.2019.100376
Zhang, B., and Zhu, Y. (2011). “Simultaneous Decolorization and Degradation of Azo Dye with Electricity Generation in Microbial Fuel Cells”, in Mechanic Automation and Control Engineering (MACE) Second Int. Conf. on Mechanic Automation and Control Engineering, 2570–2573. doi:10.1109/MACE.2011.5987508
Zhang, L., Wang, J., Fu, G., and Zhang, Z. (2020). Simultaneous Electricity Generation and Nitrogen and Carbon Removal in Single-Chamber Microbial Fuel Cell for High-Salinity Wastewater Treatment. J. Clean. Prod. 276, 123203. doi:10.1016/j.jclepro.2020.123203
Zheng, L., Wang, C., Shu, Y., Yan, X., and Li, L. (2015). Utilization of Diatomite/chitosan-Fe (III) Composite for the Removal of Anionic Azo Dyes from Wastewater: Equilibrium, Kinetics and Thermodynamics. Colloids Surf. A: Physicochemical Eng. Aspects 468, 129–139. doi:10.1016/j.colsurfa.2014.12.015
Keywords: microbial fuel cell, textile wastewater, lignin-based bioanode, organic removal, recalcitrant contaminant
Citation: Fatima M, Kiros Y, Farooq R and Lindström RW (2021) Low-Cost Single Chamber MFC Integrated With Novel Lignin-Based Carbon Fiber Felt Bioanode for Treatment of Recalcitrant Azo Dye. Front. Energy Res. 9:672817. doi: 10.3389/fenrg.2021.672817
Received: 26 February 2021; Accepted: 14 May 2021;
Published: 21 June 2021.
Edited by:
Pei-Chen Su, Nanyang Technological University, SingaporeReviewed by:
Vassilis Stathopoulos, National and Kapodistrian University of Athens, GreeceHao Zhang, The University of Edinburgh, United Kingdom
Copyright © 2021 Fatima, Kiros, Farooq and Lindström. This is an open-access article distributed under the terms of the Creative Commons Attribution License (CC BY). The use, distribution or reproduction in other forums is permitted, provided the original author(s) and the copyright owner(s) are credited and that the original publication in this journal is cited, in accordance with accepted academic practice. No use, distribution or reproduction is permitted which does not comply with these terms.
*Correspondence: Rakel W. Lindström, cmFrZWwyQGt0aC5zZQ==