 Ze Tian1
 Qin-Wen Xiao
 Fang-Rong Ren
95% of researchers rate our articles as excellent or good
Learn more about the work of our research integrity team to safeguard the quality of each article we publish.
Find out more
ORIGINAL RESEARCH article
Front. Energy Res. , 02 June 2021
Sec. Sustainable Energy Systems
Volume 9 - 2021 | https://doi.org/10.3389/fenrg.2021.672183
China has become the largest wind power installation market in the world, and on such a large scale its wind power industry contributes to the sustainability of electricity generation and reduction of carbon emissions, yet has problems such as wind curtailment, insufficient wind power consumption, and regional disparities. Thus, this research uses an epsilon-based measure (EBM) data envelopment analysis (DEA) model to evaluate and compare wind power electricity generation efficiency and CO2 emission reduction efficiency in the eastern, central, western, and northeastern regions of China for the period 2013–2017. The empirical results show that the nation’s overall wind power efficiency presents a significant upward trend, in which the western and northeastern regions have increased the most, while the east region has increased the least. Technical inefficiency is mainly due to diseconomies of scale in China’s wind power industry. Moreover, CO2 emission reduction in the four regions exhibits high efficiency, and the regions’ efficiencies are very consistent with that of installed capacity efficiency. Finally, this study’s policy implications are that industry development plans should be made according to local conditions as well as cross-regional trade of wind power electricity and that the upgrading of wind power generation capacity should be encouraged.
Electricity-related carbon emissions account for over 40% of global carbon emissions and are the main contributor to global warming (Wei et al., 2020). Reducing the burning of fossil energy and accelerating the utilization of renewable energy to reduce greenhouse gas emissions have thus become a consensus of nearly all countries around the world. In 2014, global newly-added capacity of renewable energy power generation exceeded newly-installed capacity of conventional energy power generation for the first time, marking a structural change in the global power system (IRENA, 2018).1 Among various kinds of renewable energy power generation, wind power has gradually attracted people’s attention due to the huge amounts of available wind, its high cost-effectiveness rate (Kaldellis, 2011; Dawn et al., 2019), and its large potential for energy savings and emission reduction (Yang and Chen 2013).
For the achievement of “carbon peak and carbon neutralization” and sustainability of power production, China is also actively developing its own renewable energy power generation industry. Studies show that increasing the proportion of renewable energy can help China adjust its energy structure, ensure energy security, and reduce CO2 emissions (Li et al., 2013; Du et al., 2015). Because of the country’s large wind energy reserves and wide distribution, wind power generation has in fact been vigorously promoted.
China has since become the largest wind power installation market in the world [Global Wind Energy Council (GWEC), 2021].2 In 2019, its wind power production was 405.30 billion kWh, or the third largest source of domestic electricity (China Electricity Statistical Yearbook, 2020).3 Although the development of China’s wind power industry is soaring, the problems of downtime and wind power curtailment in some areas caused by the mismatch between wind energy resources and wind power demand in different regions have also appeared (Tan et al., 2016; Chen et al., 2017). According to data released by China National Energy Administration, its average electricity losses caused by wind curtailment from 2011 to 2019 were 25.8 billion kWh, or an average wind curtailment rate of 12%. Wind curtailment directly benefits wind farms, but restricts the installed scale of wind power, thus becoming a bottleneck for the sustainable development of the domestic wind power industry and carbon emission reduction (Bird et al., 2016; Yu et al., 2017; Dong and Shi, 2019).
Some scholars have conducted research on the efficiency of wind power in China at the macro-level (Fan et al., 2015; Liu et al., 2015; Zhao and Zhen, 2019; Wang et al., 2020) or micro-level (Lu et al., 2009; Wu et al., 2016; Zhang et al., 2017), but there are scant existing studies involving regional comparisons. The differences in the wind power industry’s efficiency in China’s different regions with large disparities in natural and economic conditions require further empirical validation. There are other studies in the literature that have linked carbon emissions with wind power electricity generation. As emphasized by Wang et al. (2019), Li et al. (2020) and Bahramian et al. (2021), wind power offers excellent emission reduction potential.
This research thus evaluates electricity generation efficiency and CO2 emission reduction efficiency of China’s regional wind power industry. The huge wind power market in China has brought considerable carbon emission reduction benefits, and in order to analyze whether the regional supply and demand mismatch affects regional power generation efficiency and carbon emission reduction efficiency, a subregional comparative study becomes very necessary. Our study therefore fills the gap in the literature and presents policy implications not only on the sustainable development of wind power, but also how to achieve “carbon peak and carbon neutralization.” This research divides China into four distinctive regions (eastern, central, western, and northeastern) to enhance our understanding on the efficiency of regional wind power industries through efficiency evaluation and comparative analysis. Our paper is also different from the previous literature in that we creatively analyze the relationship between installed capacity and CO2 emission reduction to discuss the contribution of China’s wind power industry investment to CO2 emission reduction. Based on the analysis herein, we offer policy recommendations to improve electricity generation efficiency and CO2 emission reduction efficiency in each region and to promote the industry’s sustainable development. In terms of methodology, we apply an epsilon-based measure (EBM) data envelopment analysis (DEA) model to evaluate the efficiency of China’s wind power industry to avoid the problem of underestimation or overestimation of the calculated efficiency value and improvement space, which can easily be caused by other DEA models. So far, no previous studies have applied the same methods and samples used on this research topic.
The rest of the paper runs as follows. Section 2 is the Literature Review about the research methods and research objects. Section 3 covers the Research Method. Section 4 presents the empirical Results and Discussions about the efficiency of China’s wind power industry. Section 5 is Conclusions and Proposals.
Due to its practicality and simplicity, DEA is commonly used for energy efficiency assessment in a wide range of fields. Wang et al. (2013) proposed a new method based on the meta-frontier DEA approach for measuring energy efficiency by considering the technology gap and analyzed energy efficiency and the technology gap in the east, central, and west regions of China. Mou (2014) used the slacks-based measure (SBM) DEA model to analyze the efficiency of China’s coal-fired power plants. Munisamy and Arabi (2015) employed the SBM DEA model to evaluate the productivity of 48 Iranian thermal power plants. Camioto et al. (2016) utilized the SBM DEA model and window analysis to calculate G7 and BRICS total-factor energy efficiency. Ewertowska et al. (2017) combined the Banker-Charnes-Cooper (BCC) DEA model with life cycle assessment and stochastic modelling to evaluate the environmental efficiency of 11 power generation technologies. Sartori et al. (2017) implemented DEA to evaluate the sustainable development efficiency of Brazil’s power industry. Alsaleh et al. (2016) and Alsaleh et al. (2017) applied the DEA model to measure the efficiency of the bioenergy industry in the EU28 countries. Saglam (2017) applied a two-stage DEA model based on Charnes-Cooper-Rhodes (CCR) and BCC to evaluate the efficiency of wind power generation in 39 states of the United States. Long et al. (2018) measured the environmental efficiency of 192 thermal power plants in the Yangtze River Delta of China based on the SBM DEA model. Wu et al. (2018) employed the super efficiency DEA model to measure the ecological efficiency of coal-fired power plants in China. Akbari et al. (2020) evaluated the CCR DEA model to evaluate the efficiency of 71 offshore wind farms in five countries of northwest Europe. Mohsin et al. (2021) used the extension of the SBM model to measure the energy economic-environmental performance of 48 countries in five different regions. Zhu and Lin (2021) adopted the non-radial directional distance function (NDDF) to measure the energy efficiency of China’s mining industry. We find that linear models such as CCR and BCC or non-linear models such as SBM are mostly used in these research studies, but linear and non-linear models may easily lead to misestimation of the efficiency value as well as the room for improvement of the research subjects.
The rapid growth of China’s wind power industry has attracted many scholars to explore related issues in the development of this industry. Liu et al. (2015) applied the DEA model to analyze the efficiency of China’s wind power industry from 2008 to 2012 and found that industry performance is on the rise. Fan et al. (2015) compared China’s wind power utilization level with other countries and noted that its total wind power utilization level is equivalent to that of the United States. Wu et al. (2016) analyzed the production efficiency of 42 large wind farms in China and concluded that these wind farms are operating at acceptable levels. Zhang et al. (2017) compared the conditions of eight inland, coastal, and offshore wind power plants and noted that the energy performances of inland and coastal wind farms are similar, but there is a big difference in their energy performances vs. offshore wind farms. Zhao and Zhen (2019) concluded that China’s wind power industry from 2011 to 2015 exhibits inefficiency and believed that its wind power industry is still in the early stages of development. Wang et al. (2020) studied the efficiency of China’s wind energy industry from 2014 to 2017, with results showing low efficiency. Dong and Shi (2019) found through their research that the main factors affecting the performance of wind power generation in China are local power consumption capacity, the degree of economic development, and the rate of wind curtailment. Lin and Luan (2020) argued that the innovation efficiency of China’s wind power industry is low, but the overall trend is rising. Zhang et al. (2021a) discussed the main factors (generation proportion, transmission structure, power self-sufficiency, generation proportion, resource development, power consumption, and resource utilization) affecting the significant decline in wind power electricity generation in China. These studies all examined China’s wind power development from many perspectives, but few focused on comparing the efficiency of the wind power industry in the country’s different regions. Sub-regional research can thus help understand the specific situations of wind power efficiency within the industry.
Some scholarly research on wind power also has focused on energy savings and emission reduction. Tan et al. (2013) analyzed the operating efficiency of the wind power manufacturing industry from a macro-level perspective and believed that the use of wind power can lower standard coal consumption and effectively reduce emissions. Yang and Chen (2013) found that wind power is competitive in terms of energy conservation and emission reduction vs. other power generation systems. Yang et al. (2017) conducted a quantitative study on the synergistic effects of wind power penetration and energy efficiency in China. From the perspective of the life cycle, Gao et al. (2019) found that desert wind farms have the least impact on the environment, followed by grassland and woodland wind farms. Wang et al. (2019) calculated the environmental impact of the whole life cycle of wind power electricity generation. Li et al. (2020) considered that wind power electricity generation has greater emission reduction potential compared to general coal-fired electricity generation. Bahramian et al. (2021) discovered that wind power electricity generation has reduced CO2 emissions in the United States and Ontario, Canada via the replacement of thermal power electricity generation. Scholars have also analyzed the performance of wind power for energy savings and emission reduction under various research methods, but there is little analysis on the relationship between wind power industry investment and carbon emission reduction.
A thorough literature review shows that most energy efficiency research is based on linear models such as CCR and BCC or non-linear models such as SBM. These two different types of models may easily lead to the problem of underestimation or overestimation of the calculated efficiency value and room for improvement. Existing studies have analyzed China’s wind power development from many perspectives, but scant studies compare the efficiency of the wind power industry in its different regions, making it difficult to understand the specific conditions of the wind power industry throughout the country. Thus, this paper fills the gap in the literature on this topic.
This study applies the EBM method to evaluate and compare the wind power efficiency of four regions in China. The findings herein should help make up for the inadequacy of previous studies on a regional evaluation of wind power efficiency in China. In addition, CO2 emission reduction is taken as one output indicator and installed capacity is taken as one input indicator in the EBM model to deconstruct the relationship between wind power input and environmental benefits, which past research has not yet discussed.
DEA is a non-parametric technical efficiency analysis method based on a relative comparison among evaluated objects (decision-making units, DMUs). Charnes et al. (1978) developed the CCR DEA model with a constant-returns-to-scale assumption, after which Banker et al. (1984) extended it to a variable-returns-to-scale assumption and proposed a BCC model that measures technical efficiency and scale efficiency. However, both CCR and BCC are radial DEA models in which all factors are reduced in the same proportion, which makes the evaluated efficiency inconsistent with the actual situation. Tone (2001) proposed non-radial estimation methods to present SBM efficiency values of between 0 and 1. However, as SBM is a non-radial DEA model, it fails to consider radial characteristics; that is, it ignores those characteristics that have the same radial proportions. To address the shortcomings in both the radial and non-radial models, Tone and Tsutsui (2010) proposed the EBM DEA model, which is input-oriented, output-oriented, and non-oriented. The EBM DEA model considers the differences in DMUs’ radial scale and non-radial slack variables at the same time. It makes up for the defect of radial DEA models, which ignore non-radial slacks, and non-radial DEA models, which ignore radial characteristics. Thus, the EBM model not only effectively calculates the efficiency of the evaluated unit, but also reflects the difference between the radial and non-radial parts (He et al., 2018; Li et al., 2018; Wu et al., 2019; Zeng and Wei, 2021; Zhou and Li, 2021). Although the EBM model has been applied to discuss various areas’ efficiency, it is rarely seen in wind power industry efficiency research.
This paper therefore selects the EBM model to accurately measure the efficiency of China’s wind power industry. A non-oriented EBM DEA description for the basic model and solution (Tone and Tsutsui, 2010) goes as follows.
Suppose there are
Y: DMU output,
X: DMU input,
In this paper DMUj represents province j of China, Xj represents the input factor of the wind power industry in each province, Yj represents the output factor of the wind power industry in each province, and K* represents the efficiency value of the wind power industry in each province. If DMU0 K∗ = 1 is the best efficiency for non-oriented EBM and if an inefficient DMU wants to achieve an appropriate efficiency goal, then the following adjustments are needed:
To overcome any possible bias in the traditional energy efficiency indicators, this paper uses a total-factor energy efficiency indicator. For each specific evaluated municipality or province, installed capacity efficiency and CO2 emission reduction (CO2 ER) efficiency are calculated using Eqs. 3, 4.
If the target installed capacity input equals the actual input, then installed capacity efficiencies equal one, indicating overall effective. If the target installed capacity input is less than the actual input, then installed capacity efficiencies are less than one, indicating overall ineffective.
If the target CO2 ER desirable output is equal to the actual CO2 ER desirable output, then CO2 ER efficiencies equal one, indicating overall effective. If the actual CO2 ER desirable output is less than the target CO2 ER desirable output, then CO2 ER efficiencies are less than one, indicating overall ineffective.
Figure 1 shows the research framework of the EBM model.
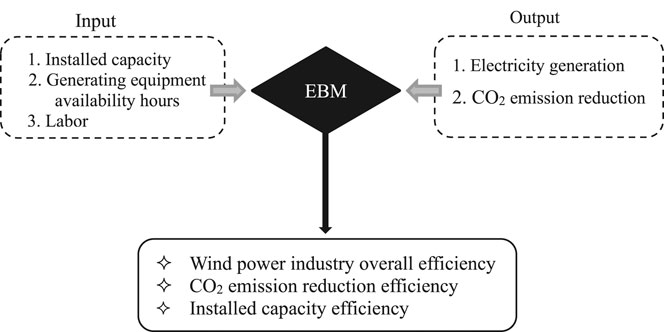
FIGURE 1. Research framework
This paper collected data from 30 provinces in China between 2013 and 2017. In order to analyze whether there is a difference in the efficiency of the wind power industry between regions with different resource endowments, we divide the provinces with different natural and social resources into eastern, central, western, and northeastern regions (Figure 2). The eastern region includes Beijing, Tianjin, Hebei, Shanghai, Jiangsu, Zhejiang, Fujian, Shandong, Guangdong, and Hainan. The central region includes Shanxi, Anhui, Jiangxi, Henan, Hubei, and Hunan. The western region includes Inner Mongolia, Guangxi, Chongqing, Sichuan, Guizhou, Yunnan, Shaanxi, Gansu, Qinghai, Ningxia, and Xinjiang. The northeast region includes Liaoning, Jilin, and Heilongjiang.
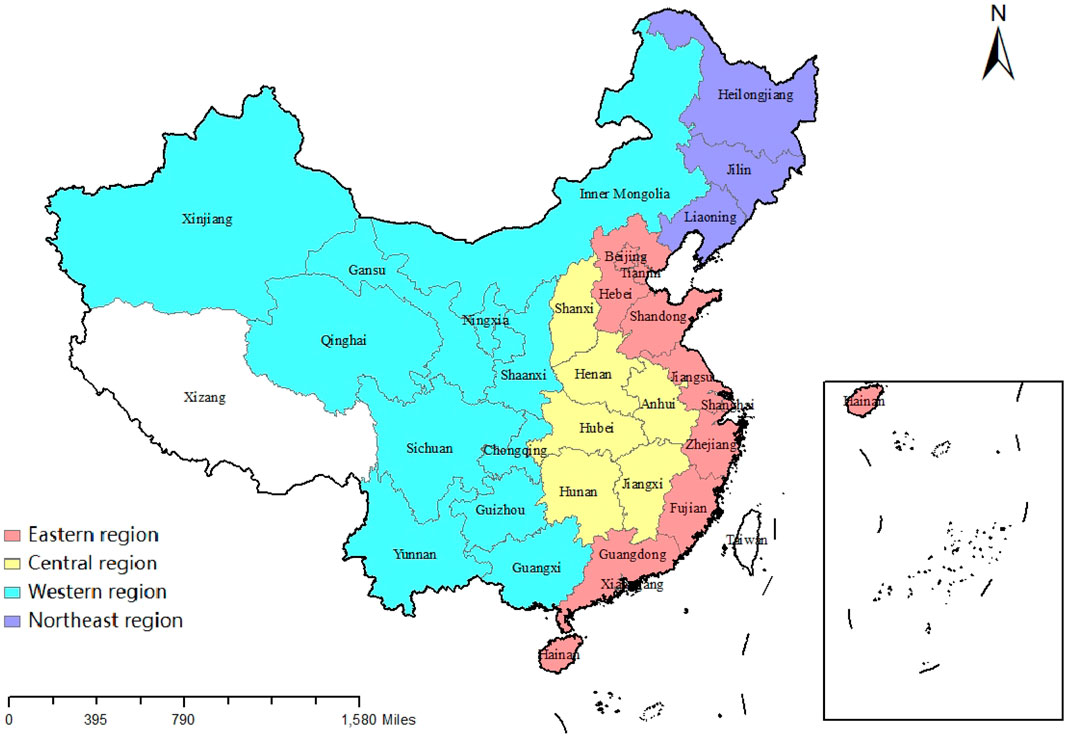
FIGURE 2. Distribution of the four regions in China.
The efficiency calculation of the evaluation areas by the DEA model is based on the selected variables. Thus, whether the selected variables are appropriate is critical to the reliability of the evaluation results. The selection of variables in this paper follows two principles: 1) variable data can be obtained; and 2) validity must be proved by the relevant literature. According to the principle of variable selection, the input indicator variables used in this study are labor, generating equipment availability hours, and installed capacity, and the output indicators are electricity generation and CO2 emission reduction (Table 1).

TABLE 1. Input and output variables.
Installed capacity has a strong positive correlation with electricity generation and represents fixed asset investment in the wind power industry (Saglam, 2017). Thus, it is one of the important input indicators in the DEA model for wind power efficiency evaluation. Like installed capacity, labor input also is the primary input of the wind farm production process (Wu et al., 2016). Generating equipment availability hours reflect the degree of utilization and level of production capacity of the power generation equipment invested by the wind power industry. Electricity generation is important and the most common output indicator in DEA for wind power efficiency evaluation research (Saglam, 2017; Zhang, 2019). In order to explore the performance of wind power in reducing carbon emissions, CO2 emission reduction is a very essential and intuitive output indicator. Through the evaluation of CO2 emission reduction efficiency, the contribution of wind power electricity generation to CO2 emission reduction can be analyzed (Papiez et al., 2019).
Installed capacity (Cap): The sum of the rated effective power of the generator set installed. Installed capacity unit: MKW.
Generating equipment availability hours (Hours): The number of operating hours calculated by dividing the generating capacity of the reporting period by the capacity of the equipment. Unit: hour.
Labor (Lab): This study uses the number of employees in the production and supply industries of electricity, gas, and water in each municipality/province at the end of each year (Zhao and Zhen, 2019). Unit: 10,000 people.
Electricity generation (Elec): The amount of electrical energy produced by a generator through energy conversion. Unit: KWh.
CO2emission reduction (Red): Based on CO2 emissions from thermal power generation under the same generating capacity, the generating capacity is converted into standard coal, and one degree of power consumes 360 g of standard coal; 1 ton of raw coal = 0.714 tons of standard coal. The carbon dioxide emission coefficient per ton of raw coal is 1.9003 kg-co2/kg. Therefore, the formula is: CO2 emission reduction = power generation * 0.36/0.714*1.9003/10. Unit: Mt.
In order to prove the reliability of the five selected variables for efficiency evaluation, principal component analysis (PCA-DEA) is used by referring to Adler and Golany (2002) and Nataraja and Johnson (2011). IBM SPSS Statistics 23.0 is employed to get the test result. (As shown in Table 2, the KMO measure is 0.613, which is larger than 0.50). The Bartlett test’s approximate chi-square is 1,605.792, and the corresponding significance is 0.000. According to the results of the KMO measure and Bartlett’s test for sphericity, the five selected variables for efficiency evaluation are relevant.
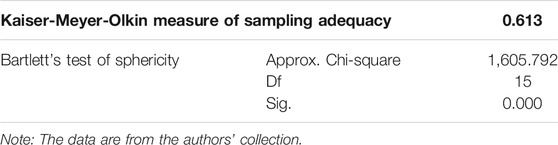
TABLE 2. KMO and Bartlett’s test.
Table 3 lists the results of principal component analysis. It shows that the extraction of the selected five variables used for efficiency evaluation is larger than 0.75. Hence, these variables are suitable for evaluating China’s wind power industry efficiency.
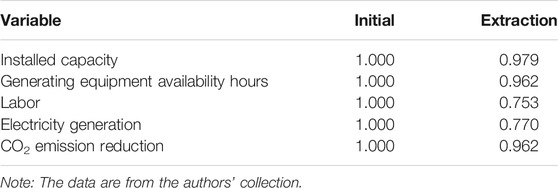
TABLE 3. Communalities.
The average, maximum, and standard deviation of installed wind power capacity are increasing year by year. The average value of labor has declined. The average hours of generating equipment availability are the lowest in 2015.
The average value, maximum value, and standard deviation of wind power electricity generation and CO2 emission reduction show a significant upward trend. From the statistical characteristics of output indicators, the capacity of China’s wind power industry is growing rapidly. Figure 3 shows the statistical analysis of installed wind power capacity (Cap), generating equipment availability hours (Hours), electricity generation (Elec), and CO2 emission reduction (Red) of China’s wind power industry.
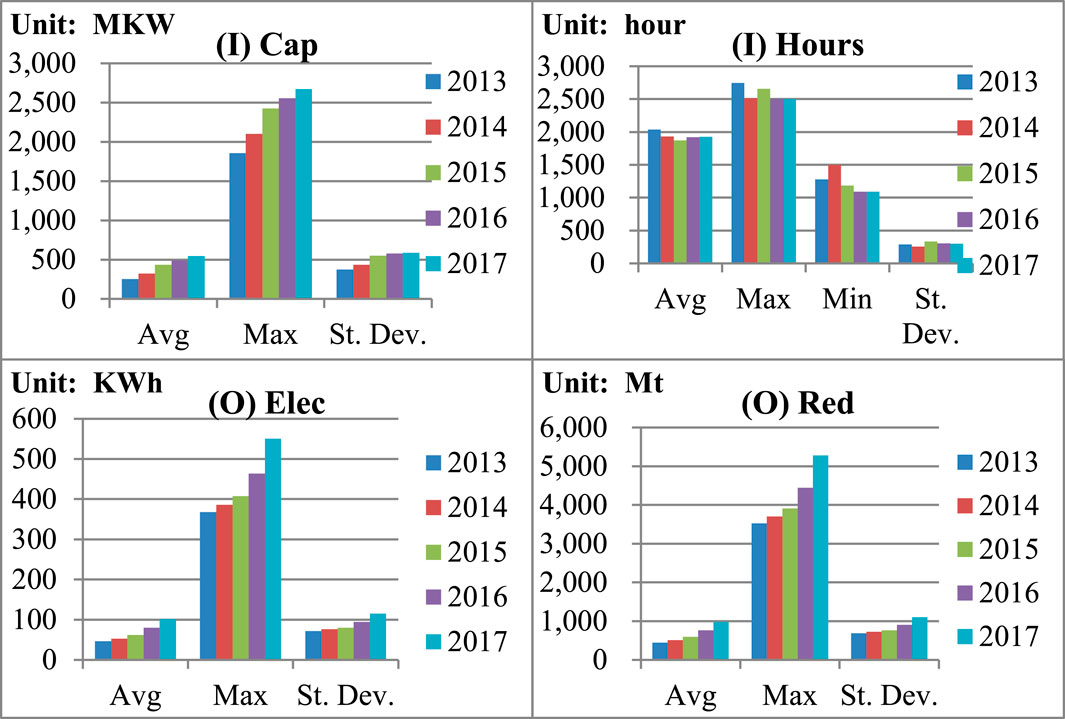
FIGURE 3. Statistical description of indicators by year.
To measure the efficiency of China’s wind power industry, this paper takes data of its wind power industry from 2013 to 2017 as the research object and uses the EBM model to calculate the efficiency values. Table 4 shows its four regions’ efficiency scores and rankings. The average overall efficiency of China’s wind power industry is 0.617. Among the four regions, the eastern region ranks the highest in average annual total efficiency (0.662), northeast is second (0.636), western is third (0.608), and central is the lowest (0.549). We see that the annual average overall efficiency of China is on the rise. Among all areas, the western and northeastern regions’ annual average efficiency values increase the most, reaching 0.22. The eastern region’s annual average efficiency value increased the least during the study period at 0.10.
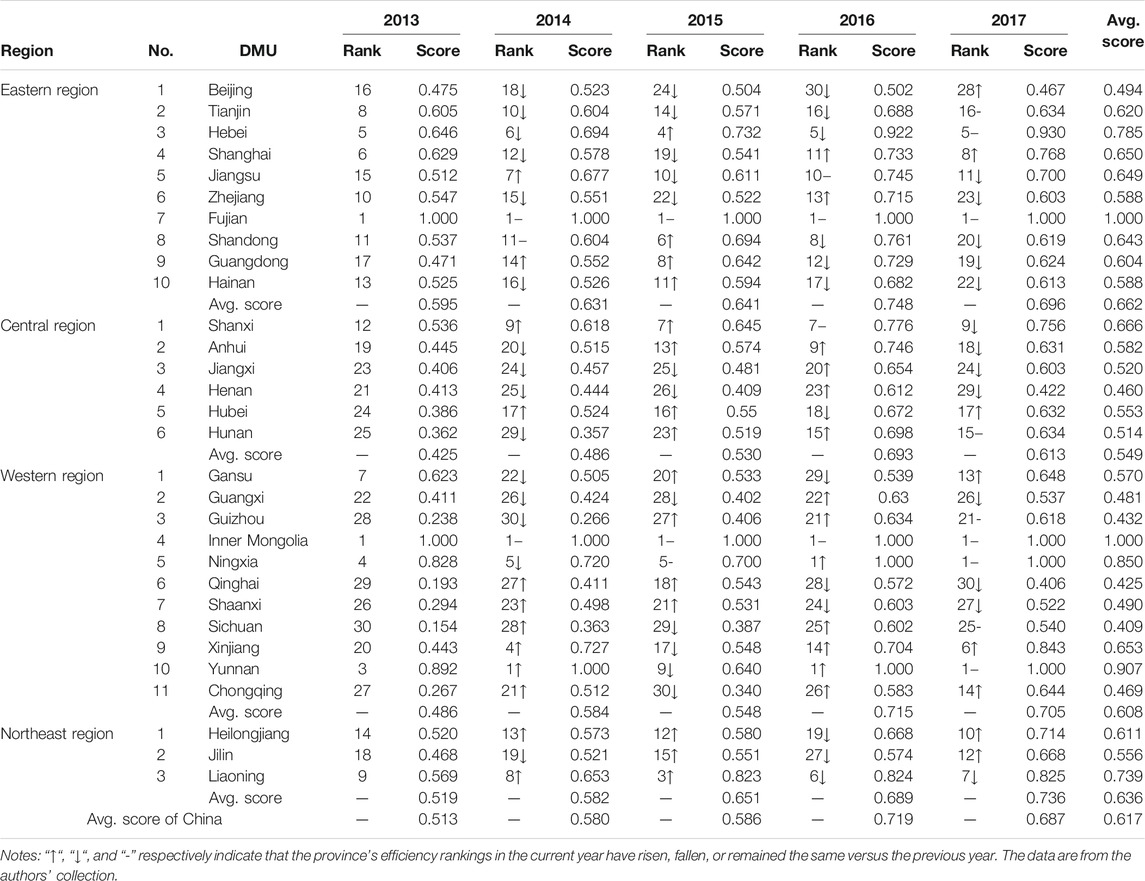
TABLE 4. Overall efficiency and ranking.
Figure 4 shows more intuitively the regional differences in the efficiency of the wind power industry, where the darker the color is, the better is the wind power performance. In Figure 4 the average annual electricity generation efficiency of provinces in the eastern region, which have large electricity demand and rich offshore wind energy, is generally higher. Slightly lower is the efficiency of provinces in the northeast region, which have no shortage of wind energy, but find it difficult to completely absorb wind power electricity in winter. Except for Inner Mongolia, Xinjiang and Yunnan, which have abundant wind energy resources, the annual average power generation efficiency of the central provinces and western provinces is generally low, because of their small resident population and insufficient demand.
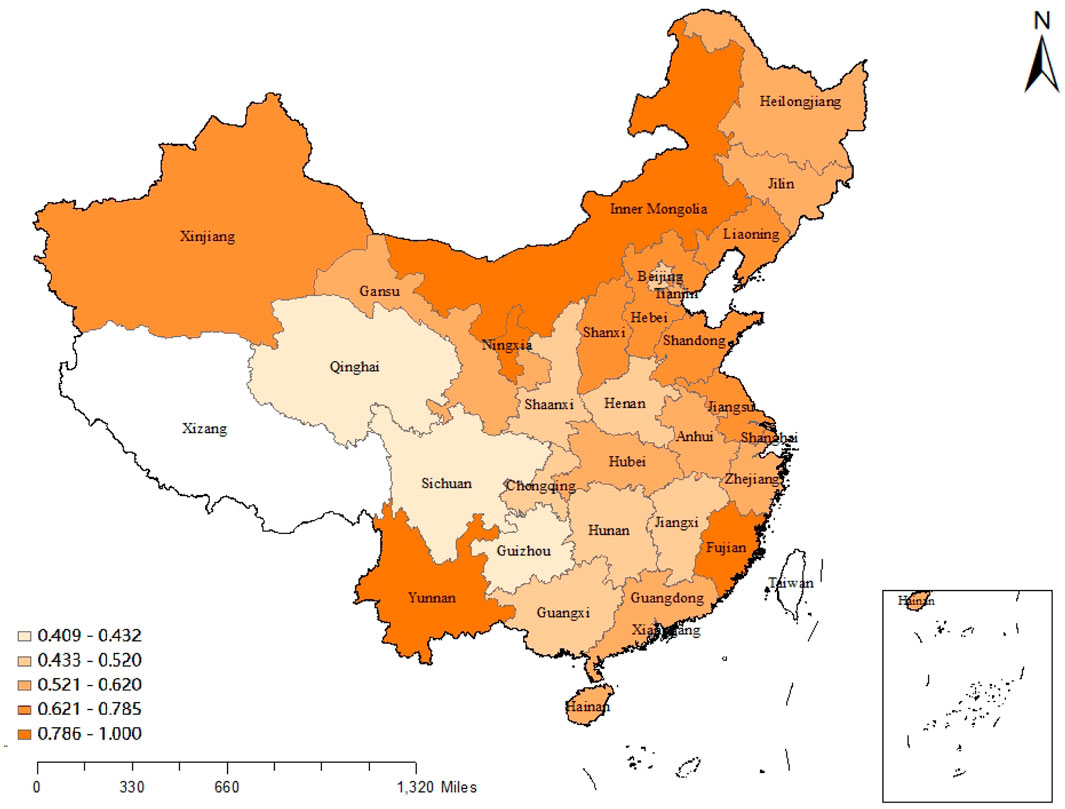
FIGURE 4. Average annual overall efficiency in various regions.
Both Fujian in the eastern region and Inner Mongolia in the western region have an overall efficiency score of one, indicating that they have no need for improvement. The specific analysis of the overall efficiency in the remaining regions is as follows.
From the eastern region, Beijing dropped 12 places in 5 years, Tianjin dropped eight places, Zhejiang dropped 13 places, and Shandong and Hainan dropped by nine spaces. The average wind power efficiency in Beijing for 5 years is the lowest in the eastern region at only 0.494. The overall efficiency score of Fujian is one, and the remaining eight provinces and cities are concentrated between 0.588 and 0.785. The ranking of Jiangsu has risen, while Hebei’s ranking has not changed, but its efficiency value has increased from 0.646 to 0.930.
From the central region, Shanxi, Hubei, and Hunan have significantly improved their overall efficiency scores and rankings. Hunan’s efficiency improvement is the most obvious. Its ranking increases from 25 to 15, and its overall efficiency score increases from 0.362 to 0.634. The overall efficiency rankings of Anhui and Jiangxi are stable, with a slight increase in scores. The only decline in the overall efficiency ranking in the central region is in Henan, from 21 in 2013 to 29 in 2017. The difference in wind power efficiency values is small.
The provinces with the highest efficiency scores and rankings in the western region are Guizhou, Ningxia, Sichuan, Xinjiang, Yunnan, and Chongqing. Xinjiang has risen by as many as 14 places, and its efficiency value has increased from 0.443 to 0.843. The overall efficiency rankings in Gansu and Guangxi have declined. The overall efficiency rankings of Inner Mongolia, Qinghai, and Shaanxi are stable.
The overall efficiency score and ranking in the northeast have increased. Jilin rose from 18 in 2013 to 12 in 2017. The most significant increase in efficiency is in Liaoning, which rose from 0.569 to 0.825.
With reference to Alsaleh et al. (2017), this paper uses the radial DEA model to measure the technical efficiency of China’s wind power industry and decomposes it into pure technical efficiency and scale efficiency to explore whether changes in the technical efficiency of the domestic wind power industry are due to technological progress or changes in scale. Table 5 displays technical efficiency (TE), pure technical efficiency (PTE), and scale efficiency (SE) of each province in the four regions. Among them, Fujian, Yunnan, and Inner Mongolia have technical efficiency scores of one.
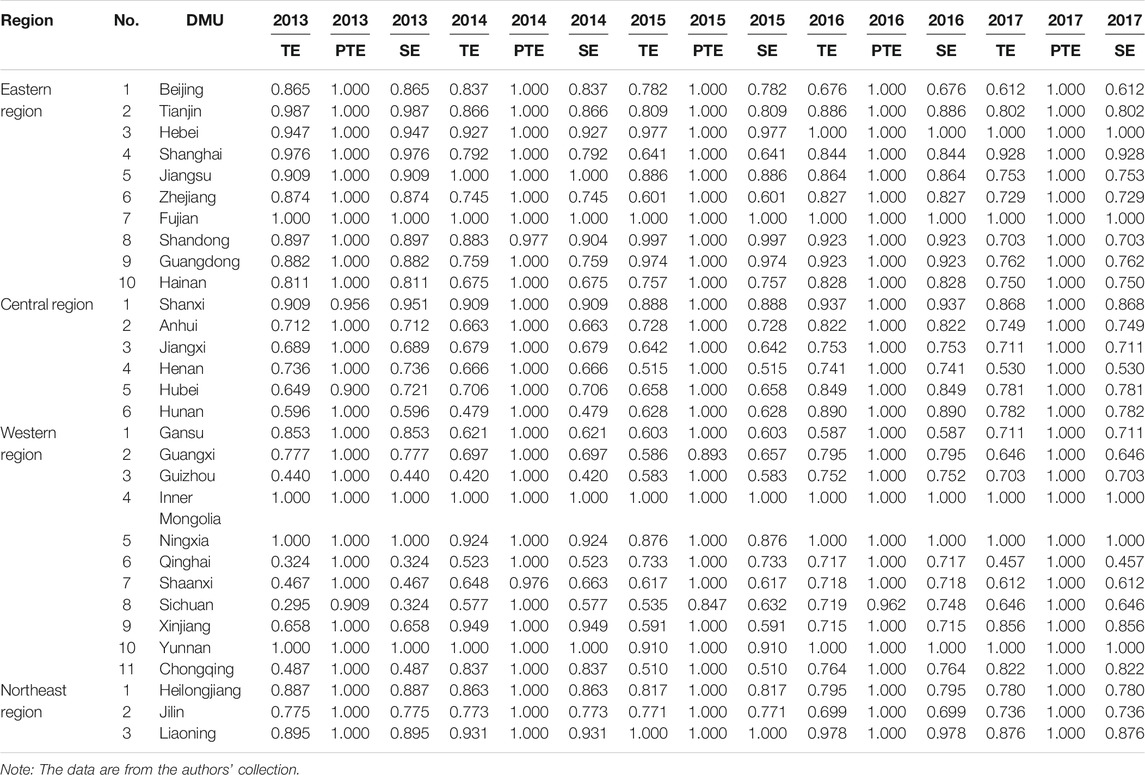
TABLE 5. 2013–2017 Decomposition of technical efficiency score.
Figure 5 shows the average annual technical efficiency of the wind power industry in each province in the form of a map, where the darker color represents higher efficiency. It can be seen that the color distribution in Figure 4 is similar to that in Figure 3. Provinces in the eastern region, which have higher average annual overall efficiency, have greater technical efficiency scores than provinces in other regions. The two efficiency values of provinces in other regions have the same relationship.
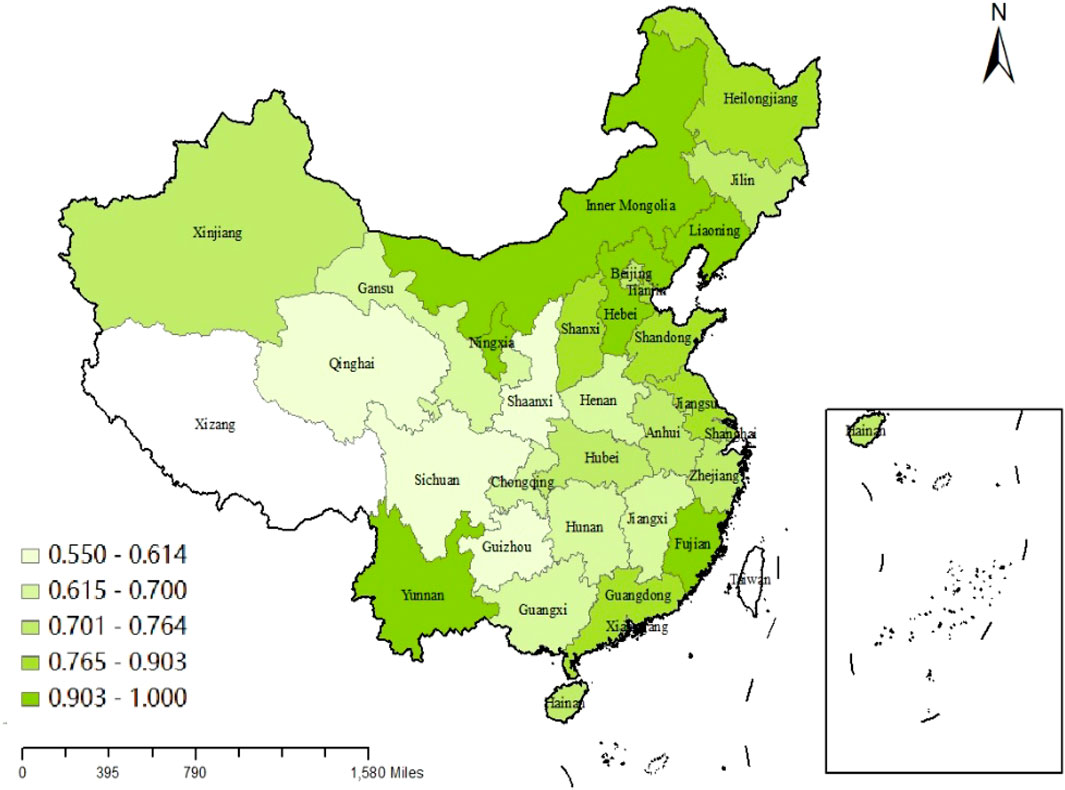
FIGURE 5. Average annual technical efficiency in various regions.
As shown in Table 6, the annual average technical efficiency of China’s wind power industry is 0.788, and the annual average pure technical efficiency (0.997) is higher than the annual average scale efficiency (0.791) after decomposition. The pure technical efficiency value in 2013–2017 is between 0.99 and 1, which is high and stable. The scale efficiency value in 2013–2017 is between 0.76 and 0.84, which is low and fluctuating. Technical efficiency is more affected by scale efficiency.
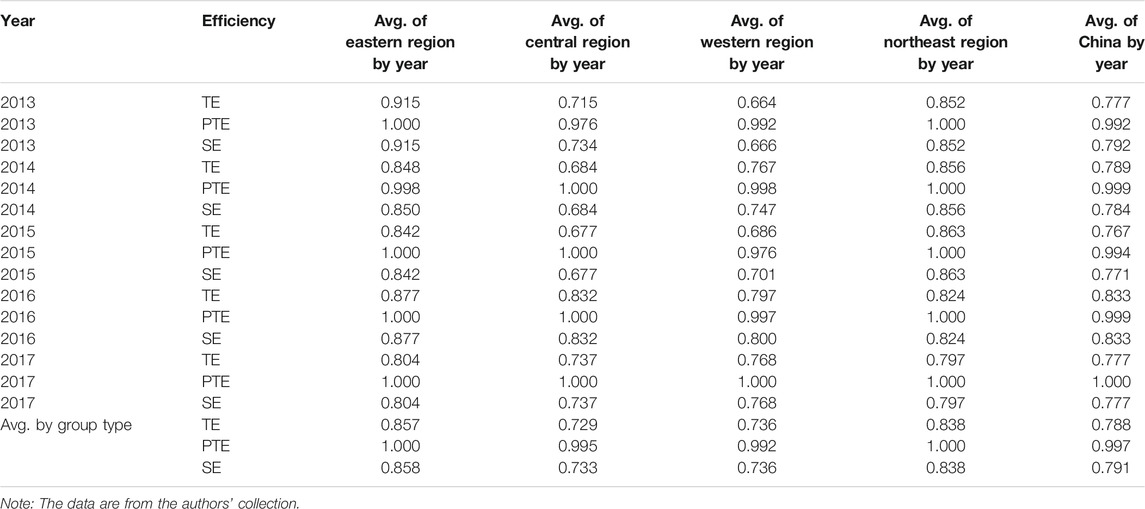
TABLE 6. Average technical efficiency score.
From a regional perspective, the respective average annual pure technical efficiencies of the eastern, central, western, and northeastern regions are also higher than their average annual scale efficiencies. Among the four regions, the eastern region has the highest annual average technical efficiency (0.857), pure technical efficiency (1.000), and scale efficiency (0.858); the northeast region has the second highest annual average technical efficiency (0.838) and scale efficiency (0.838), while its pure technology is efficient (1.000); the eastern region’s technical efficiency (0.736) and scale efficiency (0.736) rank third, but its pure technical efficiency (0.992) is the lowest; and the central region’s technical efficiency (0.729) and scale efficiency (0.733) are the lowest, but its pure technical efficiency (0.995) ranks third.
Figure 6 shows the changing trends of technical efficiency, pure technical efficiency, and scale efficiency in China’s four regions from 2013 to 2017. The pure technical efficiency values of the four regions are stable between 0.97–1.0 with minimal changes. The changes in technical efficiency are mainly affected by scale efficiency. The technical efficiency and scale efficiency of the eastern and northeastern regions both show a downward trend, but the eastern region has a greater decline. The western region’s technical efficiency and scale efficiency show a fluctuating upward trend. The technical efficiency and scale efficiency of the central region fluctuate greatly, but the overall change is not obvious.
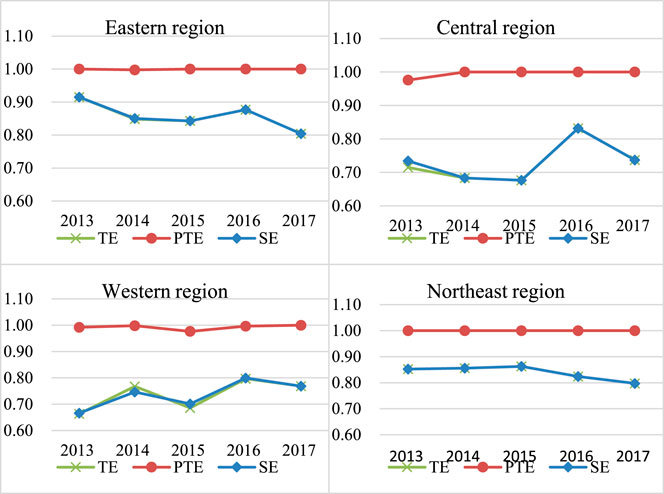
FIGURE 6. Statistical description of indicators by year and by region.
Table 7 shows the installed efficiency and CO2 emission reduction efficiency scores for the four regions during 2013–2017. The installed capacity efficiency rankings of the provinces are almost the same as the CO2 emission reduction efficiency rankings. The rapid development of the wind power industry exhibits a clear positive relationship with CO2 emission reduction.
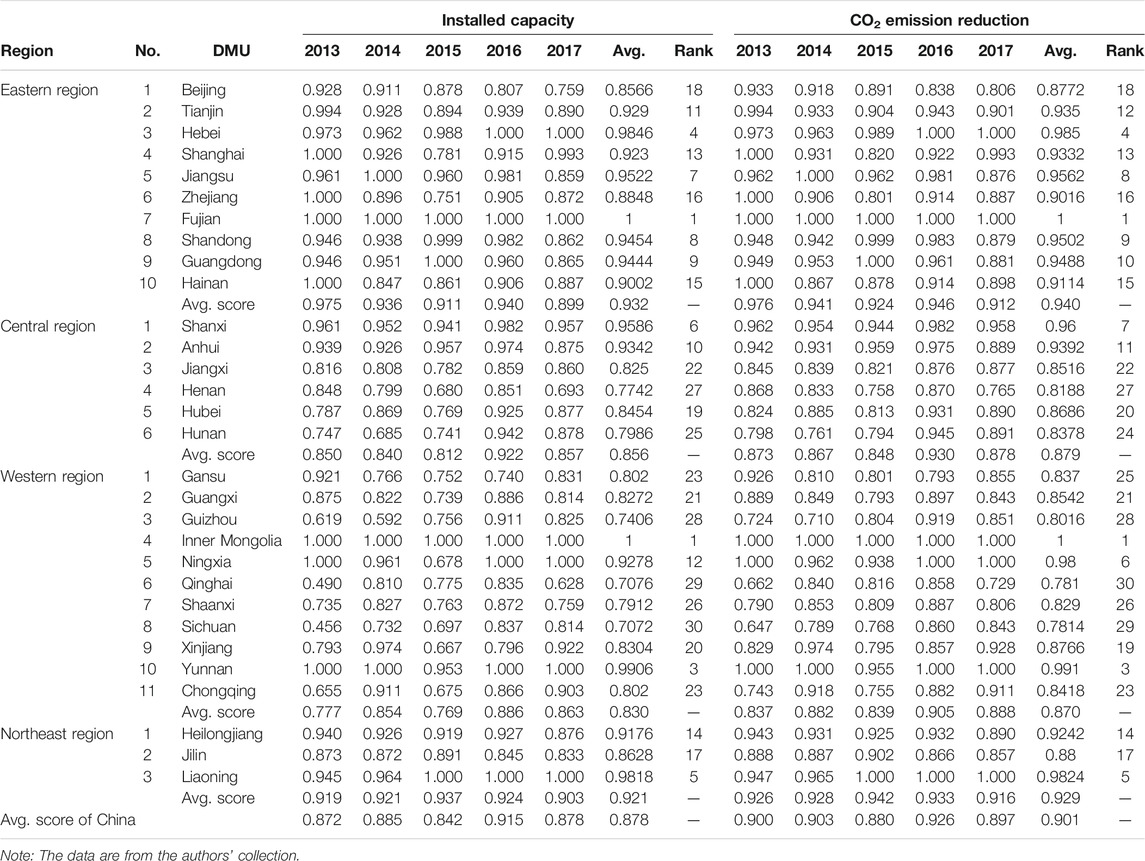
TABLE 7. 2013–2017 Installed efficiency and CO2 emission reduction efficiency score.
As shown in Figure 7, the average installed capacity efficiency in the eastern region is the highest among the four regions, followed by the northeast region and the central region. The average installed capacity in the western region is the least efficient. The average installed capacity efficiency in the eastern region shows a downward trend, while the average installed capacity efficiency in the western region presents an undulating upward trend. The changes of average installed capacity efficiency in the central and northeastern regions are less obvious.
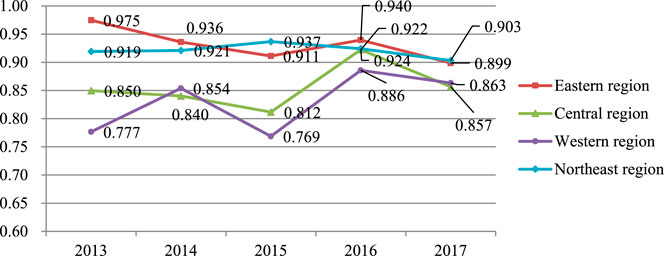
FIGURE 7. Efficiency values of installed capacity in various regions by year.
In the eastern region, Zhejiang has the highest installed capacity efficiency and the most stable performance, with its efficiency value steady at one. Beijing has the lowest annual average installed capacity efficiency, and its efficiency value has decreased year by year, from 0.928 in 2013 to 0.759 in 2017. Beijing currently has less land for wind farm construction, thus resulting in relatively small installed capacity. Although the other eight eastern provinces have relatively high efficiency values, they all show a downward trend. The eastern region has the advantage of developing offshore wind power since it is close to East China Sea and rich in wind energy resources. Therefore, the installed capacity is relatively high.
In the central region, Shanxi’s installed capacity efficiency is the best, with a five-year average of 0.959. This closely relates to Shanxi’s energy transformation in recent years, and its overall installed capacity of wind power has ranked at the forefront of China. Henan has the lowest efficiency value and ranks 27th in the country. The installed capacity in the central region increased and reached its highest efficiency in the 5 years in 2016.
The western region is China’s second-largest wind energy resource area due to westerly winds all year round, and its wind energy is widely distributed. The installed capacity efficiency of Inner Mongolia is one for all 5 years, while Qinghai, Sichuan, and Shaanxi rank 20th in the country. The efficiency values of Gansu, Guizhou, and Ningxia declined in 2017, which is inconsistent with the conditions of superior wind energy resources in the western region. Hidden behind the current situation is the problem of a lack of coordination between wind power resources, grid planning, and economic development. An oversupply of wind power electricity generation creates the embarrassing situation of many wind power plants and the phenomenon of “abandoning wind.”
In the northeastern region, the installed capacity efficiency of Liaoning has increased year by year, and its stability value is one from 2015 to 2017. Heilongjiang and the eastern part of Jilin are the third largest wind energy resource areas in China. The installed capacity efficiency of these two provinces is declining year by year, which undoubtedly implies a waste of wind energy resources.
The average carbon emission reduction efficiency values in the four regions are all above 0.8 (Figure 8), which is high. The average carbon emission reduction efficiency values in the eastern and northeast regions exceed 0.9 in the 5 years, which is higher than that in the other two regions, and thus their room for improvement is small. The gap between the average carbon emission efficiencies in the eastern and northeast regions is narrowing. The average carbon emission reduction efficiencies in the central and western regions have increased slightly.
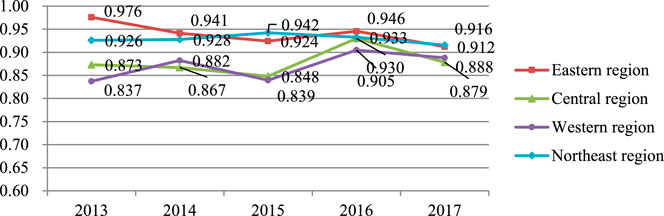
FIGURE 8. CO2 emission reduction efficiency in various regions by year.
The trend of the average CO2 emission reduction efficiency in the four regions is similar to that of the average installed capacity efficiency. The average installed capacity efficiency in the eastern region shows a downward trend, while the average installed capacity efficiency in the western region shows an upward trend. The changes of average installed capacity efficiencies in the central and northeastern regions are less obvious.
Emission reduction efficiency of CO2 in the eastern region declined in 2017 compared to 2013. Zhejiang and Hainan do not maintain optimal efficiency. Fujian’s efficiency value is one for the 5 years, and Hebei reaches one in 2017. Except for Beijing, the average efficiency of the remaining nine provinces is above 0.9. Electricity requirements are huge, which makes any wind power electricity generation completely digested by the local market, and the amount of CO2 emissions reduced by the wind power production process is very considerable. Therefore, the carbon emission reduction efficiency of the eastern region is higher than that of other regions. However, the installed capacity in the eastern region has grown slowly, which leads to the downward trend of CO2 emission reduction efficiency.
In the central region, the CO2 emission reduction efficiencies of Jiangxi, Hubei, and Hunan increased significantly in 2017 compared with 2013, and the decline is more obvious in Anhui and Henan. The average CO2 emission reduction efficiency of the four provinces ranked 20th in the country. In the northeast, Liaoning’s CO2 emission reduction efficiency has improved significantly. After reaching one in 2015, it maintained a stable and optimal state. The CO2 emission reduction efficiency values of Heilongjiang and Jilin have decreased slightly.
The provinces with the best CO2 emission reduction efficiency in the western region are Inner Mongolia, Yunnan, and Ningxia. Their mean values of efficiency are 1, 0.991, and 0.980, respectively, ranking first, third, and sixth. The CO2 emission reduction efficiency values and rankings in the western region are very different. Aside from the above three provinces, the remaining provinces in the region rank over 18th. Although the CO2 emission reduction efficiency in the western region does not rank well, the efficiency values of the six provinces have increased significantly.
The electricity demand market in the central and western regions is small, and so current wind power still has a surplus after filling the gap in the local thermal power market. Many wind farms are forced to adopt measures of “abandoning wind” due to the size of consumer market restrictions. The CO2 reduction efficiency in the central and western regions also has large room for improvement due to this reality.
Relationship Between Installed Capacity Efficiency and Carbon Emission Reduction Efficiency Annual average installed capacity efficiency is generally less than annual average carbon emission reduction efficiency, but the relationship between them is very consistent (Figure 9). Regions with higher installed capacity efficiency have the same higher CO2 emission reduction efficiency, which is clearly visible in Figure 8.
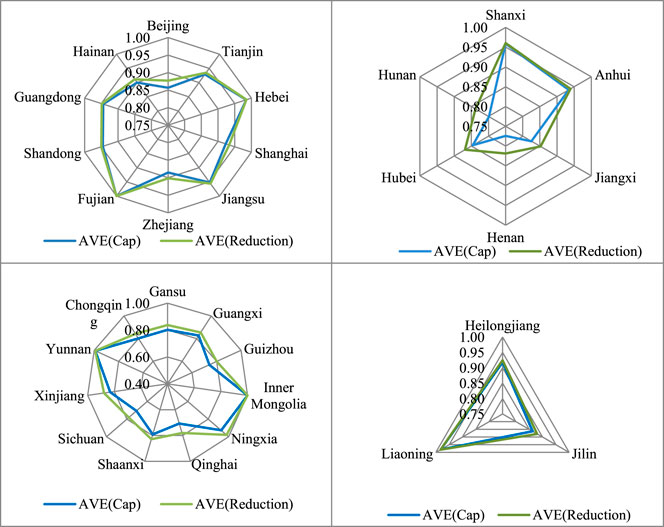
FIGURE 9. Average annual installed capacity efficiency and average annual carbon emission reduction efficiency in various regions.
As shown in Figure 10, the annual average installed capacity efficiency of the eastern and northeastern provinces is close to their annual average carbon emission reduction efficiency, and the efficiency values are all greater than 0.80. The central and western regions have large differences within their regions, with provinces having annual average efficiency values close to or equal to one, such as Yunnan, Inner Mongolia, and Shanxi. Others like Sichuan, Guizhou, and Henan have annual average efficiency values between 0.7 and 0.8.
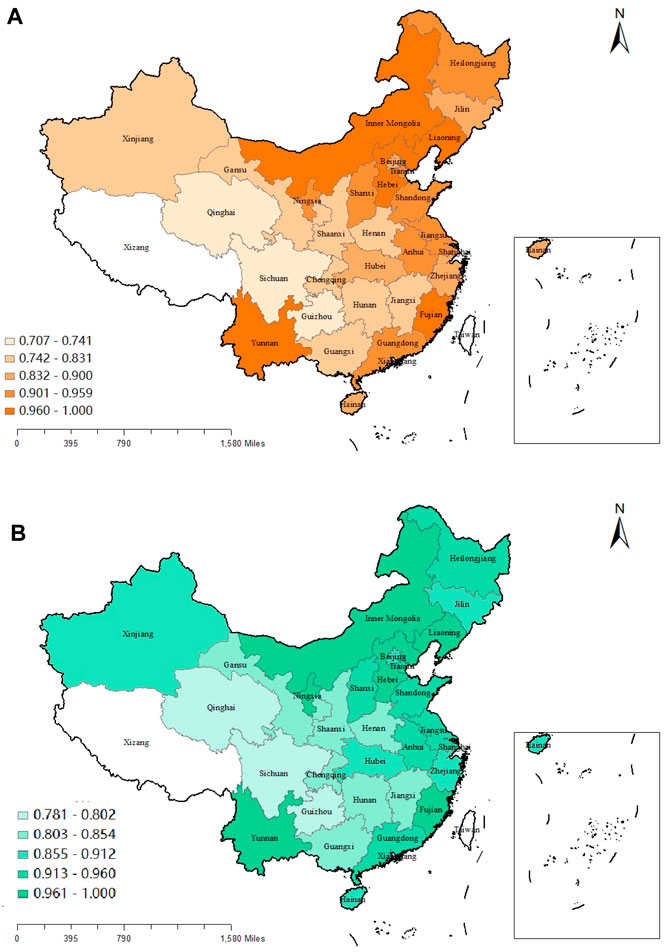
FIGURE 10. (A) Average annual installed capacity efficiency in various regions. (B) Average annual carbon emission reduction efficiency in various regions.
The annual average installed capacity efficiency and annual carbon emission reduction efficiency of Beijing and Zhejiang in the eastern region are significantly different from those in the other provinces. Although the installed capacity of these two provinces is low, there is still room for improvement in the investment of wind power generators. Increasing the installed capacity of the two provinces will help promote carbon emission reduction. The annual installed capacity efficiency and annual carbon emission reduction efficiency of Sichuan, Qinghai, Hunan, and Henan in the central and western regions vary a lot, but the difference in efficiency values is close to 0.1.
According to the research results, we see that the installed capacity efficiency of all regions in China is generally consistent with CO2 emission reduction efficiency. Therefore, increasing the share of wind power in power production will help reduce the pressure on carbon emissions and achieve carbon peak and carbon neutralization.
To compare the efficiency within China’s wind power industry, this paper uses the EBM model to calculate the efficiency of the wind power industry in each province and discusses the efficiency differences among the eastern, central, western, and northeastern regions. Wind power technology efficiency is decomposed, and the relationship between installed capacity efficiency and CO2 emission reduction efficiency is analyzed.
Like Liu et al. (2015), Shen and Lyu (2019), Lin and Luan (2020) and Zhang et al. (2021b), the empirical results of this study also find that the efficiency of China’s wind power industry exhibits a significant upward trend. However, due to the differences in time period, samples, and models used in research, the average annual efficiency value scores calculated by this study are different from the efficiency values obtained in a previous study. Findings show that China’s vigorous development of its wind power industry has achieved great results in energy security and environmental protection.
Through a decomposition of technical efficiency in China’s wind power industry, this study presents that the annual average pure technical efficiency of its wind power industry is higher than annual average scale efficiency, which is consistent with Dong and Shi (2019) and Wang et al. (2020). The annual average value of pure technical efficiency is 0.997, which is high and has little room for improvement. Scale efficiency fluctuates more obviously, with an annual average value of 0.791, which means more room for improvement. Consistent with the findings of Zhao and Zhen (2019), the low technical efficiency of China’s wind power is mainly due to the uneconomic scale of the wind power industry. Therefore, if decision-makers want to improve the technical efficiency of China’s wind power industry, then the key point lies in how to improve the industry’s scale efficiency aside from maintaining technological innovation.
This study also obtains some results that have not been reached before. First, the development of the wind power industry in different regions indeed varies, which can be found by comparing the efficiency of China’s wind power industry by region. The western region and the northeastern region have actively promoted the construction of the wind power industry, and the gap between the efficiencies of these two regions and that of the eastern region is narrowing. Decision-makers need to pay attention to the slow development of the wind power industry in the central region and focus on promoting wind power construction there.
Second, the changes in installed wind power capacity efficiency and CO2 emission reduction efficiency in the four regions are very consistent. Among the four regions, only the western region’s carbon dioxide emission reduction efficiency and installed capacity have increased. This indicates that in order to improve CO2 emission reduction efficiency, decision-makers should speed up the construction of wind power plants in the east region, central region, and northeast region.
Third, comparing the overall efficiency value of China’s wind power industry calculated by EBM with the technical efficiency value of this industry calculated by the radial DEA model, we find that the efficiency value calculated by EBM (0.617) is lower than that calculated by the radial DEA model (0.788). The efficiency trends of China’s wind power industry measured by the two also vary (Figure 11). Since the DEA model measures the relative efficiency between comparable DMUs, the radial DEA model only considers the radial ratio gap between the input or output orientation of the DMU and the frontier, while the EBM model additionally considers the non-radial slacks variable differentiated by each DMU. It reflects that the DMU value and improvement space represented by the EMB model calculation results are more accurate and offer more reference value.
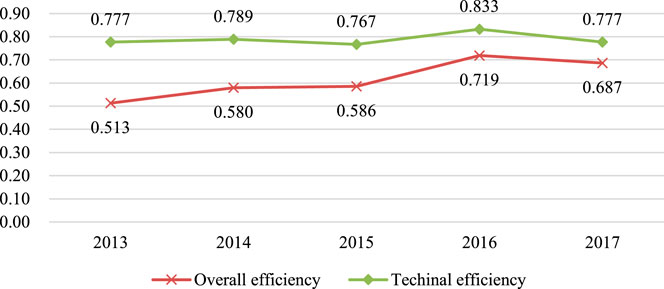
FIGURE 11. Total efficiency and technical efficiency of China’s wind power industry.
In future work, the impacts of wind power demand, wind energy resources, technology, investment, and other factors on the efficiency of wind power electricity generation and carbon emission reduction will be analyzed to find out the factors restricting the improvement of wind power efficiency in China. This will improve current research results and help achieve carbon peak and carbon neutralization.
This study uses EBM to measure the wind power industry efficiency of 30 provinces in China from 2013 to 2017. On this basis, the wind power industry efficiencies in the eastern, central, western, and northeastern regions are comparatively analyzed, and the relationship between installed efficiency and CO2 emission reduction efficiency is discussed. The results are as follows.
The annual average value of pure technical efficiency obtained by dismantling the technical efficiency of China’s wind power industry is 0.997, which is high and has little room for improvement. Scale efficiency fluctuates more obviously, with an annual average value of 0.791, thus denoting more room for improvement. Technical inefficiency is mainly affected by no efficiency problems arising from diseconomies of scale in China’s wind power industry.
This study finds that CO2 emission reduction of China’s wind power industry exhibits high efficiency (≥0.8). The average efficiency of the eastern provinces is the highest among all four regions, while that of the western region is the lowest. Moreover, CO2 emission reduction efficiency of each region is very consistent with the installed capacity efficiency, which means wind power industry investment contributes to carbon emission reduction and the achievement of carbon peaking and carbon neutralization.
The overall efficiency scores of various regions’ wind power industry in China are less than 1, but do present a significant upward trend. Among the four regions, the eastern region ranks the highest in average annual total efficiency (0.662), the northeast is second (0.636), the western is third (0.608), and the central is the lowest (0.549).
Based on the above research conclusions and combined with the actual situation of each region, the following measures are proposed for each province and city. The goal is to help improve wind power electricity generation efficiency and carbon emission reduction efficiency.
Industry development plans should be made according to local conditions. Comparing the efficiency of China’s wind power industry by region shows gaps in the development of the wind power industry in different regions. Therefore, the government and/or authorities should analyze the demand and wind energy resources of each region, select the most suitable wind power electricity generation area, and increase the average installed density of wind farms. Large wind farms can be built in areas with abundant wind energy resources and a low population, such as the northeast region and western region. The coastal eastern region should take advantage of its coastal terrain to develop offshore wind power. Due to the low average wind speed and complex terrain conditions, conditions for wind power construction in the central region are poor. To change the low efficiency of the wind power industry, this region needs to vigorously develop low-speed wind turbine technology.
Cross-regional trade of wind power electricity in China should be encouraged. China’s wind power technology inefficiency is mainly due to the diseconomies of scale of the wind power industry. At this stage, China is adopting a guaranteed purchase policy for the wind power industry. Except for some provinces in the western region, few provinces allow wind power electricity to enter the electricity wholesale market, which makes it difficult for the wind power industry to trade freely across regions and achieve economies of scale. Promoting China’s wind power electricity cross-regional transactions through the formulation of policies is conducive to promoting the enhancement of the wind power industry to achieve economies of scale.
Encourage the upgrading of wind power generation capacity. Policies are needed to inspire China’s wind power industry to expand installed capacity. As CO2 emission reduction efficiency is highly synchronized with installed wind power capacity efficiency, the expansion of installed capacity can help China to increase CO2 reduction efficiency. The government should formulate tax and fiscal incentive policies or initiate a lowest price protection policy for wind power electricity to stimulate the expansion of installed wind power capacity.
The raw data supporting the conclusion of this article will be made available by the authors, without undue reservation.
Conceptualization, Q-WX and F-RR; methodology, F-RR; software, ZT; validation Q-WX; formal analysis, Q-WX; investigation, Q-WX and F-RR; resources, ZT; data curation, F-RR; writing—original draft preparation, Q-WX; writing—review and editing, ZT; visualization, Q-WX; supervision, ZT; project administration, F-RR; funding acquisition, F-RR.
This study was supported by the Fundamental Research Funds for the Central Universities (No. B200203170, B210203151, B200207043), Postgraduate Research and Practice Innovation Program of Jiangsu Province (No. KYCX20_0512) and University level scientific research project of Xi'an Innovation College of Yan'an University (No. 2020XJKY-2).
The authors declare that the research was conducted in the absence of any commercial or financial relationships that could be construed as a potential conflict of interest.
The Supplementary Material for this article can be found online at: https://www.frontiersin.org/articles/10.3389/fenrg.2021.672183/full#supplementary-material
DMUs; decision-making units, Y; DMU output, X; DMU input,
1Renewable Energy Statistics, 2015
2Global Wind Report 2021
3China Electricity Statistical Yearbook, 2020
Adler, N., and Golany, B. (2002). Including Principal Component Weights to Improve Discrimination in Data Envelopment Analysis. J. Oper. Res. Soc. 53, 985–991. doi:10.1057/palgrave.jors.2601400
Akbari, N., Jones, D., and Treloar, R. (2020). A Cross-European Efficiency Assessment of Offshore Wind Farms: A DEA Approach. Renew. Energ. 151, 1186–1195. doi:10.1016/j.renene.2019.11.130
Alsaleh, M., Abdul-Rahim, A. S., Mohd-Shahwahid, H. O., Chin, L., and Kamarudin, F. (2016). An Empirical Analysis for Technical Efficiency of Bioenergy Industry in EU28 Region Based on Data Envelopment Analysis Method. Int. J. Energ. Econ. Pol. 6, 290–304. doi:10.1016/j.rser.2017.04.049
Alsaleh, M., Abdul-Rahim, A. S., and Mohd-Shahwahid, H. O. (2016). Determinants of Technical Efficiency in the Bioenergy Industry in the EU28 Region. Renew. Sust. Energ. Rev. 78, 1331–1349. doi:10.1016/j.rser.2017.04.049
Bahramian, P., Jenkins, G. P., and Milne, F. (2021). The Displacement Impacts of Wind Power Electricity Generation: Costly Lessons from Ontario. Energy Policy 152, 112211. doi:10.1016/j.enpol.2021.112211
Banker, R. D., Charnes, R., and Cooper, W. W. (1984). Some Models for Estimating Technical and Scale Inefficiencies in Data Envelopment Analysis Manag. Sci. 30, 1078–1092. doi:10.1287/mnsc.30.9.1078
Bird, L., Cochran, J., and Wang, X. (2016). Wind and Solar Energy Curtailment: A review of international experience. Renewable Sustainable Energy Rev. 65, 577–586. doi:10.2172/1126842
Camioto, F. d. C., Moralles, H. F., Mariano, E. B., and Rebelatto, D. A. d. N. (2016). Energy Efficiency Analysis of G7 and BRICS Considering Total-Factor Structure. J. Clean. Prod. 122, 67–77. doi:10.1016/j.jclepro.2016.02.061
Charnes, A., Cooper, W. W., and Rhodes, E. (1978). Measuring the Efficiency of Decision Making Units. Eur. J. Oper. Res. 2, 429–444. doi:10.1016/0377-2217(78)90138-8
Chen, W., Zhou, K., and Yang, S. (2017). Evaluation of China's Electric Energy Efficiency under Environmental Constraints: A DEA Cross Efficiency Model Based on Game Relationship. J. Clean. Prod. 164, 38–44. doi:10.1016/j.jclepro.2017.06.178
China Electricity Statistical Yearbook (2020). China Electricity Statistical Yearbook 2020. Beijing, China: China Statistics Press.
Dawn, S., Tiwari, P. K., Goswami, A. K., Singh, A. K., and Panda, R. (2019). Wind Power: Existing Status, Achievements and Government's Initiative towards Renewable Power Dominating India. Energ. Strategy Rev. 23:178–199.doi:10.1016/j.esr.2019.01.002
Dong, F. G., and Shi, L. (2019). Regional Differences Study of Renewable Energy Performance: A Case of Wind Power in China. J. Clean. Prod 233, 490–500. doi:10.1016/j.jclepro.2019.06.098
Du, X. W., Hu, H. T. L., Tian, Z. Y., Yuan, H. R., Zhao, D. D., and Chen, Y. (2015). Analysis of China's Energy Development and Transformation in the Context of Ecological Civilization. Eng. Sci. 17, 46–53.
Ewertowska, A., Pozo, C., Gavalda, J., Jimenez, L., and Guillen-Gosalbez, G. (2017). Combined Use of Life Cycle Assessment, Data Envelopment Analysis and Monte Carlo Simulation for Quantifying Environmental Efficiencies under Uncertainty. J. Clean. Prod. 166, 771–783. doi:10.1016/j.jclepro.2017.07.215
Fan, X., Wang, W., Shi, R., and Li, F. (2015). Review of Developments and Insights into an index System of Wind Power Utilization Level. Renew. Sust Energ. Rev 48, 463–471. doi:10.1016/j.rser.2015.04.003
Gao, C., Na, H., Song, K., Dyer, N., Tian, F., Xu, Q., et al. (2019). Environmental Impact Analysis of Power Generation from Biomass and Wind Farms in Different Locations. Renew. Sust Energ. Rev 102, 307–317. doi:10.1016/j.rser.2018.12.018
Global Wind Energy Council (GWEC) (2021). Global Wind Report 2021. Brussels, Belgium: Global Wind Energy Council.
He, Y. X., Guang, F. T., and Wang, M. Y. (2018). The Efficiency of Electricity-Use of China and its Influencing Factors. Energy 163, 258–269. doi:10.1016/j.energy.2018.08.126
IRENA (2018). Renewable Energy Statistics 2015. Abu Dhabi: The International Renewable Energy Agency.
Kaldellis, J. K. (2011). Critical Evaluation of Financial Supporting Schemes for Wind-Based Projects: Case Study Greece. Energy Policy 39, 2490–2500. doi:10.1016/j.enpol.2011.02.015
Li, J. F., Yang, X., and Zhang, M. S. (2013). The Fourth Energy Revolution and Ecological Civilization Construction. Energy. China 35, 5–9+40.
Li, J. Y., Li, S. S., and Wu, F. (2020). Research on Carbon Emission Reduction Benefit of Wind Power Project Based on Life Cycle Assessment Theory. Renew. Energ. 155, 456–468. doi:10.1016/j.renene.2020.03.133
Lin, B. Q., and Luan, R. R. (2020). Are Government Subsidies Effective in Improving Innovation Efficiency? Based on the Research of China’s Wind Power Industry. Sci. Total Environ. 710. doi:10.1016/j.scitotenv.2019.136339
Liu, Y., Ren, L., Li, Y., and Zhao, X. (2015). The Industrial Performance of Wind Power Industry in China. Renew. Sust Energ Rev. 43, 644–655. doi:10.1016/j.rser.2014.11.003
Long, X. L., Wu, C., Zhang, J. J., and Zhang, J. (2018). Environmental Efficiency for 192 thermal Power Plants in the Yangtze River Delta Considering Heterogeneity: A Metafrontier Directional Slacks-Based Measure Approach. Renew. Sust. Energ. Rev. 82, 3962–3971. doi:10.1016/j.rser.2017.10.077
Lu, T., Wu, W. R., Li, X. G., and Wang, Q. A. (2009). Dimensionless Evaluation on Economic Operation of Wind Farm. New York: IEEE, 1103.
Mohsin, M., Hanif, I., Taghizadeh-Hesary, F., Abbas, Q., and Iqbal, W. (2021). Nexus between Energy Efficiency and Electricity Reforms: A DEA-Based Way Forward for Clean Power Development. Energy Policy 149, 112052. doi:10.1016/j.enpol.2020.112052
Mou, D. G. (2014). Understanding China's Electricity Market Reform from the Perspective of the Coal-Fired Power Disparity. Energy Policy 74, 224–234. doi:10.1016/j.enpol.2014.09.002
Munisamy, S., and Arabi, B. (2015). Eco-efficiency Change in Power Plants: Using a Slacks-Based Measure for the Meta-Frontier Malmquist-Luenberger Productivity index. J. Clean. Prod 105, 218–232. doi:10.1016/j.jclepro.2014.12.081
Nataraja, N. R., and Johnson, A. L. (2011). Guidelines for Using Variable Selection Techniques in Data Envelopment Analysis. Eur. J. Oper. Res. 215, 662–669. doi:10.1016/j.ejor.2011.06.045
Papiez, M., Smiech, M., and Frodyma, K. (2019). Factors Affecting the Efficiency of Wind Power in the European Union Countries. Energy Policy 132, 965–977. doi:10.1016/j.enpol.2019.06.036
Saglam, U. (2017). A Two-Stage Data Envelopment Analysis Model for Efficiency Assessments of 39 State’s Wind Power in the United States. Energy Convers. Manage. 146, 52–67. doi:10.1016/j.enconman.2017.05.023
Sartori, S., Witjes, S., and Campos, L. M. S. (2017). Sustainability Performance for Brazilian Electricity Power Industry: An Assessment Integrating Social, Economic and Environmental Issues. Energy Policy 111, 41–51. doi:10.1016/j.enpol.2017.08.054
Shen, X., and Lyu, S. (2019). Wind Power Development, Government Regulation Structure, and Vested Interest Groups: Analysis Based on Panel Data of Province of China. Energy Policy 128, 487–494. doi:10.1016/j.enpol.2019.01.023
Tan, Z., Chen, K., Ju, L., Liu, P., and Zhang, C. (2016). Issues and Solutions of China’s Generation Resource Utilization Based on Sustainable Development. J. Mod. Power Syst. Cle 4, 147–160. doi:10.1007/s40565-016-0199-2
Tan, Z., Ngan, H. W., Wu, Y., Zhang, H., Song, Y., and Yu, C. (2013). Potential and Policy Issues for Sustainable Development of Wind Power in China. J. Mod. Power Syst. Cle 1, 204–215. doi:10.1007/s40565-013-0037-8
Tone, K. (2001). A Slacks-Based Measure of Efficiency in Data Envelopment Analysis. Eur. J. Oper. Res. 130, 498–509. doi:10.1016/s0377-2217(99)00407-5
Tone, K., and Tsutsui, M. (2010). An Epsilon-Based Measure of Efficiency in DEA – A Third Pole of Technical Efficiency. Eur. J. Oper. Res. 207, 1554–1563. doi:10.1016/j.ejor.2010.07.014
Wang, L. K., Wang, Y., Du, H. B., Zuo, J., Li, R. Y. M., Zhou, Z. H., et al. (2019). A Comparative Life-Cycle Assessment of Hydro-, Nuclear and Wind Power: A China Study. Appl. Energ. 249, 37–45. doi:10.1016/j.apenergy.2019.04.099
Wang, Q. W., Zhao, Z. Y., Zhou, P., and Zhou, D. Q. (2013). Energy Efficiency and Production Technology Heterogeneity in China: A Meta-Frontier DEA approach. Economic Modelling 35, 283–289. doi:10.1016/j.econmod.2013.07.017
Wang, X. Z., Jiang, Z. H., and Zheng, Y. (2020). Effect of Innovation Policy Mix on Innovation Efficiency: Evidence from Chinese Wind Power Industry Chain. Science and Public Policy 47, 31–46. doi:10.1016/j.econmod.2013.07.017
Wei, W. D., Hao, S. J., Yao, M. T., Chen, W., Wang, S. S., Wang, Z. Y., et al. (2020). Unbalanced Economic Benefits and the Electricity-Related Carbon Emissions Embodied in China’s Interprovincial Trade. J. Environ. Manage. 263, 110390. doi:10.1016/j.jenvman.2020.110390
Wu, P., Wang, Y. Q., Chiu, Y. H., Li, Y., and Lin, T. Y. (2019). Production Efficiency and Geographical Location of Chinese Coal Enterprises - Undesirable EBM DEA. Resour. Pol. 64, 101527. doi:10.1016/j.resourpol.2019.101527
Wu, Y. N., Hu, Y., Xiao, X. L., and Mao, C. Y. (2016). Efficiency Assessment of Wind Farms in China Using Two-Stage Data Envelopment Analysis. Energ. Convers. Manag. 123, 46–55. doi:10.1016/j.enconman.2016.06.014
Wu, Y. N., Ke, Y. M., and Xu, C. B. (2018). Eco-efficiency Measurement of Coal-Fired Power Plants in China Using Super Efficiency Data Envelopment Analysis. Sust. Cities Soc. 36, 157–168. doi:10.1016/j.scs.2017.10.011
Yang, J., and Chen, B. (2013). Integrated Evaluation of Embodied Energy, Greenhouse Gas Emission and Economic Performance of a Typical Wind Farm in China. Renew. Sust Energ Rev. 27, 559–568. doi:10.1016/j.rser.2013.07.024
Yang, J., Song, D., and Wu, F. (2017). Regional Variations of Environmental Co-benefits of Wind Power Generation in China. Appl. Energ. 206, 1267–1281. doi:10.1016/j.apenergy.2017.10.016
Yu, D. Z., Qiu, H. D., Yuan, X., Li, Y., Shau, C. Z., Lin, Y., et al. (2017). “Roadmap of Retail Electricity Market Reform in China: Assisting in Mitigating Wind Energy Curtailment,” in IOP Conference Series-Earth and Environmental Science. Editors K. L. Huang, K. W. Kim, and J. Liu (Bristol: Iop Publishing Ltd).
Zeng, P. H., and Wei, X. C. (2021). Measurement and Convergence of Transportation Industry Total Factor Energy Efficiency in China. Alexandria Eng. J. 60, 4267–4274. doi:10.1016/j.aej.2021.03.032
Zhang, C. Y., Lu, X., Ren, G., Chen, S., Hu, C. Y., Kong, Z. Y., et al. (2021a). Optimal Allocation of Onshore Wind Power in China Based on Cluster Analysis. Appl. Energ. 285, 116482. doi:10.1016/j.apenergy.2021.116482
Zhang, J., Zhang, J., Cai, L., and Ma, L. (2017). Energy Performance of Wind Power in China: a Comparison Among Inland, Coastal and Offshore Wind Farms. J. Clean. Prod 143, 836–842. doi:10.1016/j.jclepro.2016.12.040
Zhang, P. (2019). Do energy Intensity Targets Matter for Wind Energy Development? Identifying Their Heterogeneous Effects in Chinese Provinces with Different Wind Resources. Renew. Energy 139, 968–975. doi:10.1016/j.renene.2019.03.007
Zhang, X., Wang, J. X., Cao, Z., Shen, S., Meng, S., and Fan, J. L. (2021b). What Is Driving the Remarkable Decline of Wind and Solar Power Curtailment in China? Evidence from Four Provinces. Renewable Energy 174, 31. doi:10.1016/j.renene.2021.04.043
Zhao, X., and Zhen, W. (2019). The Technical Efficiency of China’s Wind Power List Enterprises: An Estimation Based on DEA Method and Micro-data. Renew. Energ. 133, 470–479.
Zhou, A. H., and Li, J. (2021). Investigate the Impact of Market Reforms on the Improvement of Manufacturing Energy Efficiency under China’s Provincial-Level Data. Energy 228, 120562. doi:10.1016/j.energy.2021.120562
Keywords: wind power industry, EBM, efficiency evaluation, CO2 emission reduction, renewable energy
Citation: Tian Z, Xiao Q-W and Ren F-R (2021) Assessing the Efficiency and CO2 Reduction Performance of China’s Regional Wind Power Industry Using an Epsilon-Based Measure Model. Front. Energy Res. 9:672183. doi: 10.3389/fenrg.2021.672183
Received: 25 February 2021; Accepted: 19 May 2021;
Published: 02 June 2021.
Edited by:
Biagio Fernando Giannetti, Paulista University, BrazilReviewed by:
Muhammad Mohsin, Jiangsu University, ChinaCopyright © 2021 Tian, Xiao and Ren. This is an open-access article distributed under the terms of the Creative Commons Attribution License (CC BY). The use, distribution or reproduction in other forums is permitted, provided the original author(s) and the copyright owner(s) are credited and that the original publication in this journal is cited, in accordance with accepted academic practice. No use, distribution or reproduction is permitted which does not comply with these terms.
*Correspondence: Fang-Rong Ren, MTgwMjEzMTIwMDA4QGhodS5lZHUuY24=
Disclaimer: All claims expressed in this article are solely those of the authors and do not necessarily represent those of their affiliated organizations, or those of the publisher, the editors and the reviewers. Any product that may be evaluated in this article or claim that may be made by its manufacturer is not guaranteed or endorsed by the publisher.
Research integrity at Frontiers
Learn more about the work of our research integrity team to safeguard the quality of each article we publish.