 Ochuko K. Overen
 Edson L. Meyer
 Golden Makaka
95% of researchers rate our articles as excellent or good
Learn more about the work of our research integrity team to safeguard the quality of each article we publish.
Find out more
ORIGINAL RESEARCH article
Front. Energy Res. , 21 May 2021
Sec. Sustainable Energy Systems
Volume 9 - 2021 | https://doi.org/10.3389/fenrg.2021.668906
This article is part of the Research Topic Energy Efficient Buildings: Renewable Energy Integration and Applications in Buildings View all 4 articles
The increasing energy consumption and its resultant CO2 emission in the built environment have revolutionized the housing design. Buildings are strategically designed to harness ambient weather factors for indoor space thermal conditioning and lighting. A comparison of the daylighting and potential environmental mitigations due to the lighting energy consumption in a passive solar and the conventional house was the aim of this study. Both houses used as a case study are in Alice, Eastern Cape in South Africa. The indoor illuminance of the homes was monitored using Li-Cor 210R photometric sensors. Between 07 h00 to 16 h30, the passive solar house’s average daylighting was 217 lux and 56 lux in the conventional house on a clear sky. Under the same sky condition, there was 47% lighting energy saving. This reduces the amount of coal usage by 1.97 kg, 3.53 kg of CO2, 14.80 g of NO2, and 4.76 L of water. In contrast, no energy savings were achieved in the conventional home. The equivalent environmental impacts due to 4.20 kg of coal usage were 7.52 kg of CO2, 31.52 g of NO2 emissions, and 10.14 L of water usage. From the findings, daylight harvest through passive solar design shows the potential of energy savings and environmental mitigation measures in the housing sector.
Between 2018 and 2019, 206 Mt of CO2 and 276 GL of water was, respectively, emitted and used in generating approximately 200 TWh of energy from coal-fired stations in South Africa. In the above-generated energy, the residential sector is the second-largest consumer, with approximately 12 TWh (Eskom, 2019). Space heating, cooking, and lighting are the major energy consumers in the residential sector (Bekker et al., 2008). The modern housing design, especially in developed countries, strategically selects and locates the building envelope components to supplement electric thermal conditioning and lighting indoors. Although lighting is the least energy consumers in the residential sector, studies have shown that daylighting enhance occupant health, sense of comfort, spaciousness, security, and pleasantness (Konis and Ph, 2018). Moreover, due to the dependency rate on the coal-fired station in the country, every household’s energy consumption lends to environmental degradation.
This study compares the energy efficiency potential due to a South African conventional house’s daylighting and passive solar house design and operation.
Daylight factor (DF) is the ratio of internal illuminance to external horizontal illuminance under CIE overcast the sky condition. It is the most common metric used among researchers to evaluate buildings’ daylight performance due to its simplicity and short-term data requirement (Bian and Ma, 2017; Wong, 2017). However, DF is limited to only overcast the sky condition. Its evaluation is given in percentage, which is not a true building illuminance. The metric does not consider a building’s geographical orientation (Mardaljevic et al., 2009). Another category of metric used in evaluating building daylight performance is daylighting autonomy (DA). DA is defined as the percentage of annual daytime (occupied) hours that a given point is within a specified minimum daylight illuminance level. Although no specific threshold illuminance is given for DA, nationally recommended standards for a specific visual task is often used since most standards are based on minimum illuminance (Pellegrino et al., 2017). The limitations of DA is that it fails to take into consideration daylight illuminance that is below the threshold but still useful to occupants. Thus, it is not reliable for estimating lighting energy savings in buildings. Also, DA metric does not account for daylight illuminance, resulting in visual discomfort since there is no upper limit illuminance (Nabil and Mardaljevic, 2006). In addition to DF and DA metrics, useful daylight illuminance (UDI) is defined as the percentage of annual occupied time that a given point is within a specified range of daylight illuminance. In most research studies, the range of daylight illuminance is given as 100 to 2000 lux (Li et al., 2017). UDI can be grouped into three metric bins; daylighting below 100 lux is considered inadequate and requires electric lighting for visual comfort. Daylighting between 100 and 500 lux produces an adequate light level but can be supplemented by electric lighting, while 500–2000 lux is desirable, tolerable, and can result in discomfort with direct sunrays present (Chi et al., 2018). According to Carlucci et al., the possible limitations of UDI metric are that there are no concrete agreed illuminance limits, and the metric provides three values for each point of a space (Carlucci et al., 2015). Data availability is also a hindrance in UDI metric, as annual daylight data are typically required. Other daylighting metrics such as annual sunlight exposure (ASE) and daylight glare probability (DGP) are mainly used to illustrate levels of daylight virtual discomfort. Cumulative annual direct sunlight excluding diffuse light over 250 h with horizontal illuminance greater than 1000 lux is referred to as sunlight overexposure (ElBatran and Ismaeel, 2021). In a given space, 10% of ASE1000, 250 h is considered unsatisfactory, 7% is deemed neutral, while 3% and below is virtually comfortable. DGP assess glare based on measured vertical illuminance at the eye level (Kong and Jakubiec, 2021). Thus, DGP less than 0.35 is imperceptible, between 0.35 and 0.40 is perceptible, between 0.40 and 0.45 is disturbing, and intolerable when greater than 0.45 (Zhang and Lu, 2019).
Besides the daylight metrics mentioned above, the amount of light on a surface area or a point (work plane) quantified by illuminance is another method used to evaluate a building’s daylighting (Yu and Su, 2015). Illuminance is used to define the designed lighting level of buildings (see reviewed study above) since it is independent of the light source. Also, it considers the orientation of the light; for daylight, the building orientation is a crucial factor. Daylight illuminance can be considered a direct and purest approach to evaluating the daylight in a building, while the daylight metrics, as mentioned above, are indirect or calculation based. Such an approach requires the use of lux meters or photometric (light sensor) to measure the instantaneous or long-term amount of light on a work plane or surface area using multiple light sensors (Kruisselbrink et al., 2018).
Over the years, researchers have engaged in several studies that interrogate daylighting utilization for optimizing residential energy efficiency. Dabe and Adane (Dabe and Adane, 2018) investigate the configuration of offsets and balconies and their impact on occupants’ daylight provisions and thermal comfort in residential buildings. They found that the depth of offsets is inversely proportional to the UDI and thermal comfort. Among other findings, they recommended several building designs concerning offset, balconies, and windows orientation to achieve an optimum lighting level indoor and thermal comfort. Furthermore, the effect of daylighting and human behavior in Hong Kong housing units was studied by Xue et al. using questionnaire survey methods (Xue et al., 2014). Their findings urged policymakers, planners, and architects to implement effective daylighting in housing projects as more occupants are satisfied with daylight. They also indicated that perception of uniformity, thermal discomfort, external obstruction, summer solar access hours, winter expected sunlight hours, and housing orientation are the six key factors that influence occupant’s daylighting tolerance. Iommi (Iommi, 2019), who conducted expected daylighting levels of seven unrealized houses, highlighted the approach adopted in optimizing daylighting in the houses. These include furniture for uniform illuminance distribution, large windows, and an increasing number of transparent surfaces in relation to the floor area, the house’s geographical orientation, and use of different daylighting systems.
According to Lee et al. (Lee et al., 2018), substantial energy savings are achievable through daylight-linked lighting controls. In their study, a preset illuminance level of dimmable electronic ballast was adopted to reduce the intensity of electrical light, thereby consuming a minimal amount of energy during the period of high daylight illuminance. Chew et al. (Chew et al., 2017) share similar views in their study on smart lighting. They categorized smart lighting into commercial, energy-saving, and advanced control smart lighting system. Commercial smart lighting systems were described off the shelf LEDs integrated with sensors that allow multiple controls via mobile devices such as smartphones. The smart controls that are color, correlation color temperature, and intensity were identified as the energy savings mechanism. Energy-saving smart systems, on the other hand, involves the use of occupancy and daylight-linked sensors. Occupancy-based lighting control uses the human presence and motion to determine the lights’ operation in a specific environment and reduces lighting energy consumption by approximately 3–60% (Saha et al., 2019). The limitation of occupancy-based lighting control over its counterpart daylight-linked lighting control is its inability to consider the surrounding illuminance. As a result, lights can be triggered in an over-illuminated environment, where electric light could be avoided. Studies have shown that daylight-linked lighting control can result in energy savings ranging from 20–92% (Doulos et al., 2019).
In the wake of diminishing energy reserved margined, predicted national blackout, and increasing greenhouse gas emission, the White Paper on Renewable Energy (WPRE) was introduced in 2003 (Ateba and Jurgens Prinsloo, 2019). This was followed by the launch of a national Energy Efficiency and Demand Side Management (EEDSM) program in 2004 by the national utility company under the auspices and guidelines of the National Energy Regulation of South Africa (NERSA). Between 2004 and 2013, the name of the program was changed to Integrated Demand Management (IDM) to align its focus and scope to the changing energy landscape of the country (Monyei and Adewumi, 2018). While the 2003 WPRE aimed to pave the way for domestic and commercial renewable energy practice in the country, IDM promotes rational and efficient energy use in all sectors, including residential and commercial sectors. According to Fawkes, improved energy efficiency is required in South Africa to maintain economic competitiveness and growth (Fawkes, 2005). Monyei and Adewumi (Monyei and Adewumi, 2017) also share similar views; they indicated a 10% reduction of residential energy consumption in South Africa is required to ensure an uninterrupted power supply In the 2011 Integrated Resource Plan (IRP) revised balance scenario’s public perception process, it was suggested that increasing EEDSM is essential in reducing carbon emission and avoiding capacity expansion (Department of Energy South Africa, 2011).
Some of the major EEDSM initiatives in the residential sector are the solar water heaters (SWHs) mass rollout/rebate program, residential load management (RLM), and nationwide compact fluorescent lamp (CFL) rollout program. The two former initiatives focused on energy consumption relating to hot water usage. The SWH program aimed to completely replace electricity for water heating, thereby reducing overall energy consumption. To this effect, over 500, 000 SWH units were installed in the country at the end of the 2014/15 financial year (Thobejane et al., 2019). RLM, on the other hand, is a provincial load management initiative that remotely controls the operation of electric geysers using either a radio wave or ripple signal in the power line. The program aimed to reduce demand during peak hours. Hence, during 07h00–10h30 (morning peak) and 18h00–20h00 (evening peak), the geysers are remotely off and then on after the specified period (Rankin and Rousseau, 2008). Rural settlement dwellers and low-income household were the primary beneficiaries of the SWH program, while RLM projects were implemented mainly in urban (metros) areas and middle- to high-income households. A low-income household is defined as a home with 1–5 rooms and no car/garage. A house with 6–8 rooms with one car/garage is referred to as a middle-income household, while home with 9–10 rooms and two cars/garages is high-income household.
However, the CFL rollout program was designed for all socioeconomic status and settlements in the country. The program was implemented using the following models: door-to-door distribution, exchange initiative, RLM-accompanied CFL program, and sales campaign (Eskom, 2011; Skinner, 2012). Door-to-door distribution involves the supply and installation of CFLs in consumers' house. This model was designed for low- to middle-income households and rural settlements. Exchange initiative requires consumers to exchange their incandescent bulbs with CFLs at designated locations such as a shopping center and municipality offices. RLM accompanied the CFL program to cater to middle- to high-income households, whereby CFLs are supplied to homes where the RLM initiative was implemented. A relatively passive approach was conducted in the form of a sales campaign that saw CFLs price subsiding. Door-to-door distribution was the most practiced, amounting to over 800,000 CFLs distribution. Between 2005 and the end of 2014/15 financial year, approximately 60 million CFLs were distributed in the entire program (Fortuin, 2015). In the program, 100, 60, and 40 W incandescent bulbs were replaced with 11, 14, 15, 20, 2,1 and 22 W CFL. According to the COP17 fact sheet (Eskom, 2013), cumulative energy savings of 60 GWh per annum was achieved for every 1 million CFLs distribution. Thus, 31.8 kt of coal and 84 ML of water usage were mitigated, and the reduction of 59.4 kt of CO2 emission. The monetary savings was estimated at R2.4 billion per annum.
Based on the above study, residential energy efficiency is an utmost priority to the South African government, and lighting plays a crucial role. Although the replacement of inefficient incandescent light bulbs with efficient CFLs presented substantial (89%) energy savings, according to Roisin et al. (Roisin et al., 2008), daylighting can further increase the energy savings by 3%. Despite the large amount of solar radiation experienced in South Africa, daylighting utilization for energy efficiency is rare, and has no considerable amount of research conducted to foster the benefits of daylighting in the country.
An experimental research method was adopted in the study and focused mainly on comparing the potential daylighting energy savings of a passive solar and South African conventional housing design. The research approach as adopted in the study is summarized in Figure 1.
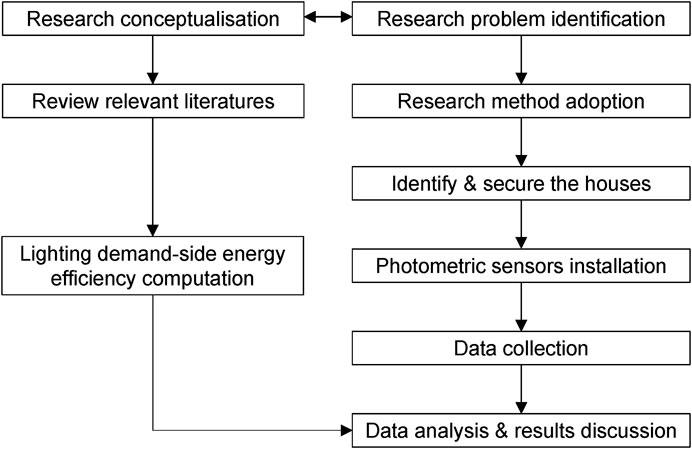
FIGURE 1. Research method steps.
In the research conceptualization, relevant literature that provides a preliminary understanding of daylighting in a residential context was reviewed and presented. The South African national power utility demand side management approach in evaluating lighting energy savings was adopted and used to compute the daylighting energy savings and environmental impact based on measured data. The results and discussions were also interrogated with identified literature studies. Discussions on the houses used in the research, illuminance measurement and procedure, and formulation of energy savings and resultant environmental impact are sequentially articulated in this section.
In this study, both houses are located in Alice, Eastern Cape Province, South Africa. Alice is located in latitude 32.8° south and longitude 26.8° east at an altitude of 540 m in the Eastern Cape of South Africa. The local climatic condition is characterized by an average dry bulb temperature of 29°C in summer and 15°C in winter. The average solar radiation experienced in summer is 606.06 W/m2 and 346.17 W/m2 in winter (Overen et al., 2017). Photos of the passive solar used in the study are presented in Figure 2.
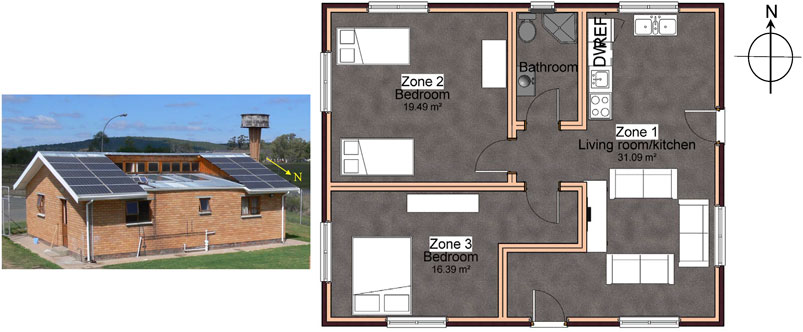
FIGURE 2. Photo of the passive solar house used in the study and its floor layout.
The passive solar house is a prototype energy-efficient low-cost house in the SolarWatt Park at the University of Fort Hare, Alice Campus. The house is approximately 15° east of north oriented and consists of two bedrooms, north and south facing, with an open-plan living room/kitchen stretching from the north to south elevation of the house. The house was designed to provide passive thermal regulation (Overen et al., 2018) and lighting.
The conventional house is a mid-cost house in the suburb of happy rest, Alice. The majority of the houses in the suburb, including the house used in the study, were built back in the 90 s in a mass housing project for junior civil servants such as teachers, police officers, and nurses. The house consists of a living room, three bedrooms, kitchen, bathroom, and lavatory. The space layout and photo of the conventional house adopted in the study are given in Figure 3.
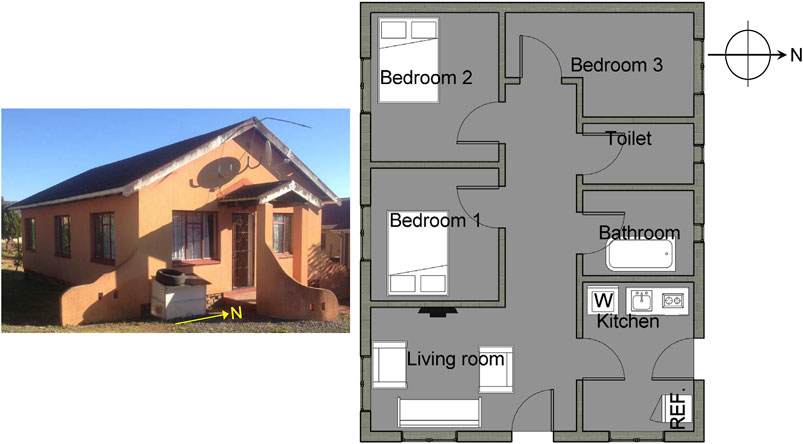
FIGURE 3. Photo of the conventional house used in the study and its floor layout.
The illuminance level of both houses' inner space was simultaneously measured by an LI-210R cosine correction photometric sensor. The sensor's sensitivity is 30 µA per 100 klux and a response time of <1 µs (Biggs, 2015). More specifications of the LI-210R cosine photometric sensor are presented in Table 1.
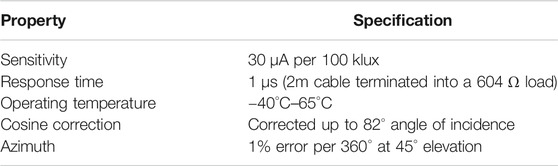
TABLE 1. Specifications of the LI-210R cosine photometric sensor (Biggs, 2015).
The photometric sensors’ setup in the living room of the conventional and passive solar houses is presented in Figure 4.
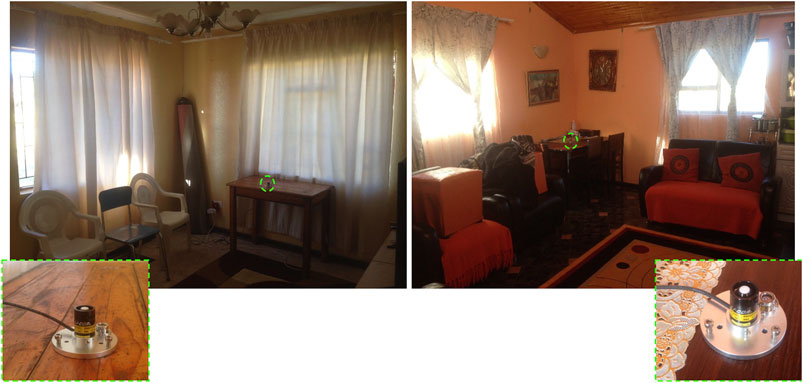
FIGURE 4. Living room of the conventional house (left) and passive solar house (right) indicating the location of the photometric sensors.
The illuminance level in the living room was the target of the measurement. In both houses, the sensors were placed on a table to prevent interference and obstruction of the occupants’ light rays. The tables were 1 m high and approximately 0.5 m from the window. Hence, the obtained illuminance represents the maximum daylighting in the living room (Acosta et al., 2015).
The recommended illuminance level for typical kitchen, living, and dining rooms is 200 lux, according to the Illuminance Engineering Society (IES) (Bradshaw, 2006), assuming that the electric lights in both houses were controlled by an adjustable photocell switch (APS). This is aided by a photoresistor which varies its resistance based on the amount of subjected light. All electric lights are off when the indoor illuminance is ≥200 lux and switched on when < 200 lux, considering the assumed lighting control technique. Therefore, the lighting energy savings can be obtained by
where
The environmental implication and mitigation due to the electric lighting energy consumption and daylighting energy saved, respectively, can be evaluated using the UNFCCC methodology (UNFCCC, 2008), which is given as follows:
where
The indoor illuminance, which comprises electric light and daylight of both houses, was monitored over a week. Figure 5 presents the indoor illuminance of the conventional and passive solar houses in the entire measurement period.
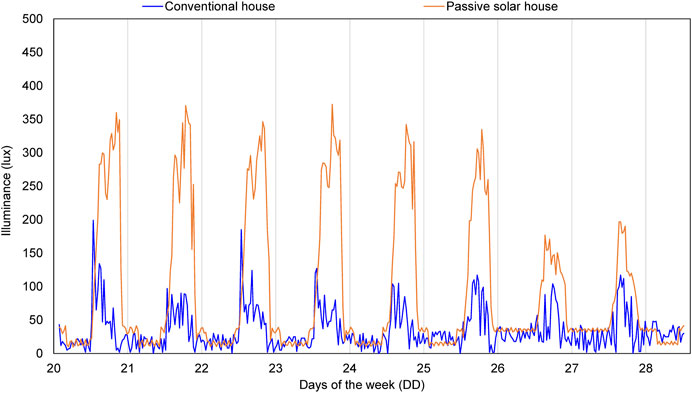
FIGURE 5. Indoor illuminance distribution.
Figure 4 shows that the average illuminance during the absence of daylighting was 20 lux in the conventional house and 25 lux in the passive solar house. The said illuminance was obtained between 17h00 and 06h30 daily, with electric lighting indoors and ambient (moon and street) lights were constituting the illuminance during this period. Furthermore, the average indoor illuminance between 7h00 and 16h30, representing daylighting, was 55 lux for the conventional house and 194 lux for the passive solar house.
Moreover, the illuminance distribution in Figure 5, can be divided into clear and overcast sky days based on the daily magnitude. In this regard, days 21–26 with an average daylighting of 57 and 220 lux in the conventional and passive solar house, respectively, served as clear sky days. Overcast sky days are represented by 27 and 28, with an average daylight illuminance of 48 lux in the conventional house and 114 lux in the passive solar house. Figures 6A,B show a typically clear and overcast skies daylight illuminance in the conventional and passive solar house, respectively.
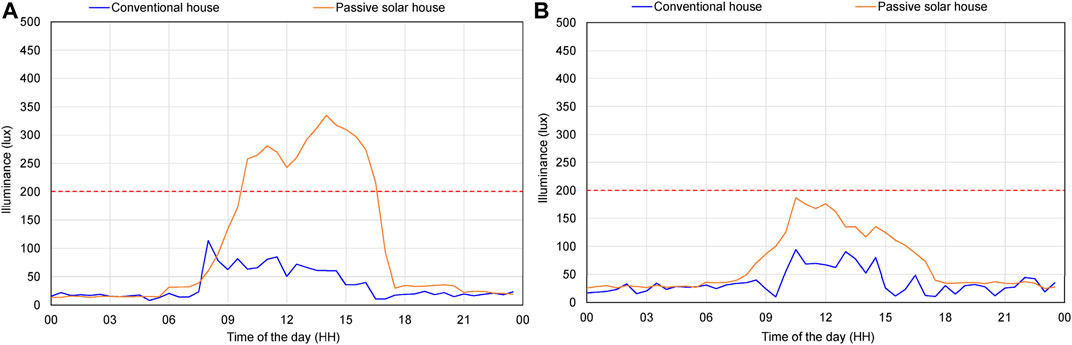
FIGURE 6. Average clear (A) and overcast (B) sky days indoor illuminance distribution.
The influence of both houses’ orientation on the indoor daylighting illuminance is visible in Figures 5A,B. As indicated in Section Literature Review, the passive solar house is north facing, which results in maximum solar ray distribution indoors. Although the living room is on the southern floor area, the clerestory windows channel solar radiation to the area. As such, uniform solar radiation is experienced daily, resulting in relatively high daylighting in both clear and overcast skies. On a typical clear sky day, the passive solar house had an average daylight of 217 lux with a maximum of 335 lux at 14h00. An average of 114 lux and a maximum of 187 lux at 10h30 were observed in the passive solar house on a typical overcast sky day.
On the other hand, the indoor daylighting in the conventional house peaked at 08h00 with 114 lux on a clear sky day and 10h30 with 94 lux on an overcast sky day. From Section Literature Review, it was also shown that the conventional house living room is located at the southern floor area with its large windows facing south and east. In the absence of north-facing windows, the living room only receives direct solar radiation in the early morning hours due to the east rising sun. Hence, the average daylight illuminance in the conventional house was 56 and 48 lux on clear and overcast skies, respectively.
Also, the equal daylight illuminance peak time observed in both houses on an overcast sky day was due to the absence of direct and dominance of diffused sun rays, which is a typical characteristic of overcast sky conditions. In both figures, according to the broken (red) lines that represent the illuminance threshold in a living room, the conventional house requires electric lighting indoor to achieve visual comfort in both sky conditions. Likewise, the passive solar house requires electric lighting under an overcast sky. However, in the daylighting period (07h00 to 16h30), electric light is not required most of the time in the passive solar house during a clear sky condition.
The passive solar house was occupied by one of the university staff and his immediate family and a domestic worker during the monitoring period. The family members include his wife, two children (boy and girl) between the ages of 6 and 10 years, and an infant. During the weekdays, the infant remained at home with the domestic worker as the other family members went about their daily activities. Typically, the father and two children leave home at 08h00 and the children return at 15h00, while the father returned at 18h00. The wife worked and lived out of the town. Hence, over the weekend, the entire family often traveled to spend time with the wife. Three sets of 11 W compact fluorescent lamp (CFL) were used in the living room.
A single family comprising an adult male and female and their six-year-old child was found to occupy the conventional house. All the family members often leave home at 8h00, the mother and child return home by 15h00, and the father by 18h00 during weekdays. On weekends, all the family members are usually at home. During the measurement period, the occupants illuminate the living room with an 11 W CFL.
Based on the occupants’ behavior and discussions with the family members in both houses, both houses’ daily lighting schedule was outlined. Daily, all-electric lights were switched off between 21h00 to 05h30, while the occupants are asleep. The lights are on from 06h00 to 06h30 as they prepare for their daily activities and 07h00–16h30 due to the domestic worker’s activities on weekdays in the passive solar house. All-electric lights were on between 17h00 and 20h30, while both families prepared dinner and spent time together before going to bed. On weekends in the conventional house, all-electric lights were assumed (worst-case scenario) to be on from 07h00 to 20h30. Vis-à-vis the above lighting schedule, a simulated lighting energy profile without (baseline) and with an APS light controller in both houses are presented in Figure 7.
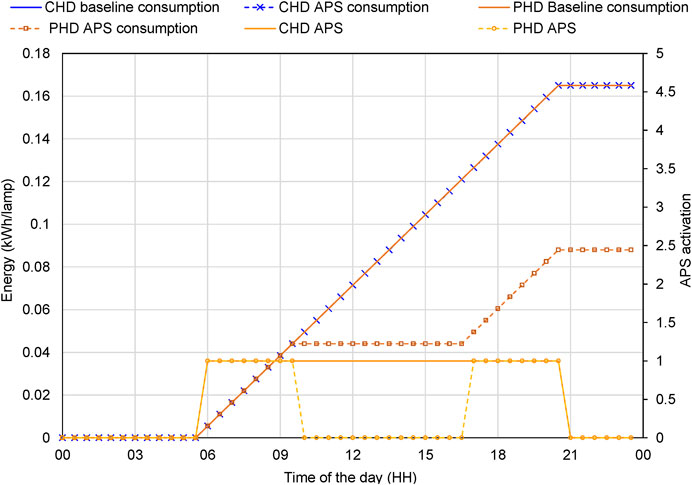
FIGURE 7. Daily cumulative lighting energy profile.
In Figure 7, CHD represents the conventional house design, while the passive solar house design is denoted by PHD. The lighting energy profile in Figure 7 only applies to clear sky days since the daylighting level under overcast skies in both houses were below the APS lighting threshold of a living room. The lighting energy consumption in both houses is equal with or without APS on overcast sky days. This is equivalent to the baseline energy consumption of the houses, as given in Figure 7. It is also the average weekdays and weekends daily cumulative energy consumption of houses. The simulated light energy consumption in Figure 7 was normalized; thus, representing energy consumption per lamp. The daily cumulative baseline lighting energy consumption in both houses was found to be 0.66 kWh/lamp. APS utilization in the passive solar house reduces the daily cumulative lighting energy by 47%, amounting to 0.35 kWh/lamp. No energy saving was achieved in the conventional house, giving that the indoor daylighting level was below the living room 200 lux threshold at all time. Thus, electric light is always required to supplement daylight to achieve visual comfort.
This section aims to quantify the annual individual environmental elements used and minimized in generating the equivalent amount of energy consumed without and with APS in both houses. Therefore, 2018/19 emission factors over 12 months of energy generation by the South African national utility company are given in Table 2 (Eskom, 2019).
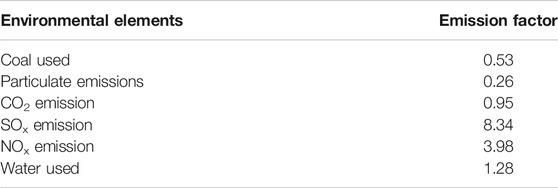
TABLE 2. Emission factors of various environmental elements (Eskom, 2019).
The indicators in Table 2 are based on total electricity generation from coal, nuclear, pumped storage, wind, hydro, and gas turbines between April 1, 2018, and March 31, 2019. The figures, however, exclude energy consumed by the national utility company. The coal used is based on coal characteristics and the power station design parameters. SOx (sulfur dioxide), NOx (nitrogen dioxide), and CO2 emissions are based on coal-fired and gas turbine power stations using coal burnt tonnage. The energy savings due to daylighting and the baseline energy consumption of both houses as presented in Figure 7 were substituted into Eq. 2 to compute the electrical lights’ environmental impacts of both houses. The emission factors required in Eq. 2 are given in Table 2. The annual environmental implications and mitigations of both houses’ lighting energy consumption are presented in Figure 8.
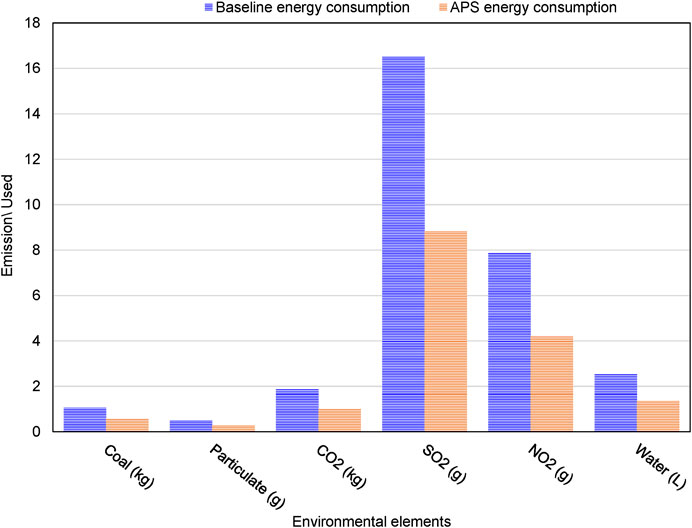
FIGURE 8. Lighting environmental implications and mitigations of the houses.
Figure 8 shows that APS used in the passive solar house resulted in 47% mitigation across all environmental elements used and emitted by a coal-fired plant in generating the energy consumption per lamp. The annual amount of coal used was reduced to 1.97 kg, resulting in an annual emission rate of 3.53 kg of CO2, 14.80 g of NO2, and 4.76 L of water used. Due to no lighting energy saving in the conventional house, annual coal used in generating the energy consumed per lamp was 4.20 kg. The resultant CO2 and NO2 gases emission were 7.52 kg and 31.52 g, respectively. Also, 10.14 L of water was used.
The findings of the study are empirical and may differ due to the following factors. Based on the CFL RLM approach (Thobejane et al., 2019), lower lamp wattage demands less power, thereby reducing its overall energy consumption over time. Consequently, the use of CFL, an energy-efficient lamp, reduces the daylight energy savings in the passive solar house. Due to the low occupancy rate, the lamp’s burning hours also reduce the light energy consumption, consequently lessening the daylighting impact. Furthermore, the sky conditions, which affect the amount of solar radiation (visible rays) reaching the earth surface, is another daylighting performance influencing factor. As shown in Figure 5, regardless of the house design, a minimal amount of daylight is perceived indoors during overcast sky conditions. This, therefore, results in the supplementary use of electric lights to maintain visual comfort. Winter season with shorter days is expected to produce minimum daylight energy savings giving the seasonal day length variation. A particularly crucial factor that also contributes to daylight energy savings is the lighting control strategy. In reality, it will be implausible to obtain optimum daylight energy savings using a mechanical switch control. Delays in operating the switch due to distractions and individual perception of the ambient light will negatively affect the savings. The illuminance-based automatic switch adopted in this study presents an excellent lighting control for optimum savings and ideal for quantifying daylight energy savings. Other lighting control strategies include occupancy sensor, individual dimming, and dimmable ballast (Lim et al., 2017).
Another influencing factor of daylight energy is the operation of the ventilation components (windows and doors). However, this aspect is not covered in this study. The occupants were allowed to use their discretion on the ventilation components operation. Opening these components increases daylight indoors, but a balance between thermal and visual comfort is paramount (Dabe and Adane, 2018). Also, the uncontrolled opening of the components may lead to over-illumination, resulting in virtual discomfort. In terms of environmental mitigation, the methodology adopted is limited to energy generated from coal-fired plants. Thus, the approach and findings of the study apply to regions with such an energy source. It is noteworthy that it was assumed that the lighting energy was generated from coal-fired plants entirely. Therefore, mix-energy sources will diminish the environmental benefits.
This study aimed to compare the daylighting and potential environmental mitigation due to lighting energy consumption in a conventional and passive solar house. A prototype low-cost, energy-efficient house in Alice in the Eastern Cape Province, South Africa, was used in the study.
It was found that under the clear sky condition, the average indoor daylighting of the conventional house was 56 lux and 217 lux for the passive solar house. This implies that the conventional house average daylighting is below the recommended threshold of 200 lux for domestic (living room) houses. Both houses were also below the APS threshold under overcast sky conditions as the occupant required electric lights to achieve visual comfort. Furthermore, no lighting energy savings were achieved in the conventional house under both sky conditions and the passive solar house on overcast sky day. On a clear sky day, there was 47% lighting energy saving. This reduces coal usage by 1.97 kg, 3.53 kg of CO2, 14.80 g of NO2, and 4.76 L of water. In contrast, no energy savings were achieved in the conventional home. The equivalent environmental impacts due to 4.20 kg of coal usage were 7.52 kg of CO2, 31.52 g of NO2 emissions, and 10.14 L of water usage.
Based on the findings, daylight harvest through the passive solar design shows the potential of energy savings and environmental mitigation measures in the housing sector. However, daylighting has greater energy management potentials in the commercial sector since typical operating hours are concise with daylight and relative more lamps. Hence, our future work will cover the daylighting potential energy management in commercial buildings.
The raw data supporting the conclusion of this article will be made available by the authors, without undue reservation.
OO and EM conceptualized and secured the passive solar and conventional house used in the study. Both authors designed and installed the data acquisition system. OO and GM were responsible for periodic data collection and analysis. OO did visualization and compilation of the manuscript. EM and GM supervised the research. All authors have read and agreed to the published version of the manuscript.
This work was based on the research supported in part by the National Research Foundation of South Africa (Grant number 129641). We also acknowledge the Department of Science and Technology, Eskom Tertiary Education Support Program (TESP), and Govan Mbeki Research and Development Center for also supporting this research.
The authors declare that the research was conducted in the absence of any commercial or financial relationships that could be construed as a potential conflict of interest.
Special thanks to the staff and student of Fort Hare Institute of technology for their technical support of this research.
DF, daylight factor; DA, daylighting autonomy; UDI, useful daylight illuminance; ASE, annual sunlight exposure; DGP, daylight glare probability; EEDSM, energy efficiency and demand side management; NERSA National Energy Regulation of South Africa; IDM, Integrated Demand Management; WPRE, White Paper on Renewable Energy; RLM, residential load management; CFL, compact fluorescent lamp; IES, Illuminance Engineering Society; APS, adjustable photocell switch; CHD, conventional house design; PHD, passive solar house design.
Acosta, I., Munoz, C., Campano, M. A., and Navarro, J. (2015). Analysis of Daylight Factors and Energy Saving Allowed by Windows under Overcast Sky Conditions. Renew. Energ. 77 (12), 194–207. doi:10.1016/j.renene.2014.12.017
Ateba, B. B., and Jurgens Prinsloo, J. (2019). Strategic Management for Electricity Supply Sustainability in South Africa. Utilities Policy 56, 92–103. doi:10.1016/j.jup.2018.10.010
Bekker, B., Eberhard, A., Gaunt, T., and Marquard, A. (2008). South Africa's Rapid Electrification Programme: Policy, Institutional, Planning, Financing and Technical Innovations. Energy Policy 36 (8), 3115–3127. doi:10.1016/j.enpol.2008.04.014
Bian, Y., and Ma, Y. (2017). Analysis of Daylight Metrics of Side-Lit Room in Canton, South China: A Comparison between Daylight Autonomy and Daylight Factor. Energy and Build. 138, 347–354. doi:10.1016/j.enbuild.2016.12.059
Biggs, W. W. (2015). Principles of Radiation Measurement. Lincoln, NE: Li-Cor, IncAvailable at: https://www.licor.com/documents/liuswfuvtqn7e9loxaut
Bradshaw, V. (2006). The Building Environment: Active and Passive Control Systems. Hoboken, NJ: John Wiley & Sons.
Carlucci, S., Causone, F., De Rosa, F., and Pagliano, L. (2015). A Review of Indices for Assessing Visual Comfort with a View to Their Use in Optimization Processes to Support Building Integrated Design. Renew. Sustainable Energ. Rev. 47 (7491), 1016–1033. doi:10.1016/j.rser.2015.03.062
Chew, I., Karunatilaka, D., Tan, C. P., and Kalavally, V. (2017). Smart Lighting: The Way Forward? Reviewing the Past to Shape the Future. Energy and Build. 149, 180–191. doi:10.1016/j.enbuild.2017.04.083
Chi, D. A., Moreno, D., and Navarro, J. (2018). Correlating Daylight Availability Metric with Lighting, Heating and Cooling Energy Consumptions. Building Environ. 132, 170–180. doi:10.1016/j.buildenv.2018.01.048
Dabe, T. J., and Adane, V. S. (2018). The Impact of Building Profiles on the Performance of Daylight and Indoor Temperatures in Low-Rise Residential Building for the Hot and Dry Climatic Zones. Building Environ. 140, 173–183. doi:10.1016/j.buildenv.2018.05.038
Department of Energy South Africa (2011). Integrated Resource Plan for Electricity 2010-2030. PretoriaSouth Africa: Department of Energy, 1–73. Available at: www.energy.gov.za/IRP/irp files/IRP2010_2030_Final_Report_20110325.pdf
Doulos, L. T., Kontadakis, A., Madias, E. N., Sinou, M., and Tsangrassoulis, A. (2019). Minimising Energy Consumption for Artificial Lighting in a Typical Classroom of a Hellenic Public School Aiming for Near Zero Energy Building Using LED DC Luminaires and Daylight Harvesting Systems, Energy and Build. 194, 201–217. doi:10.1016/j.enbuild.2019.04.033
Eskom (2011). “Efficient Lighting Programme Involving the Rollout of Compact Fluorescent Lights ( CFL ),” in United Nations Climate Change Conference. Durban, South Africa: Eskom, 1–4. Available at: https://www.thedti.gov.za/industrial_development/docs/Consumer_Energy_Saving.pdf
Eskom (2013). The Eskom National Efficient Lighting Programme : Compact Fluorescent Lamps ( CFL ) Clean Development Mechanism (CDM) Project. Johannesburg, South Africa.
Fawkes, H. (2005). Energy Efficiency in South African Industry. J. Energy South. Afr. 16 (4), 18–25. doi:10.17159/2413-3051/2005/v16i4a3073
Fortuin, W. (2015). WCOU Distribution of CFLs for Sustainability, in AMEU: Alternative Trajectories towards the SA Electricity Regime. Johannesburg, South Africa: Association of Municipality Electricity Utilities, 1–17.
Iommi, M. (2019). Daylighting Performances and Visual Comfort in Le Corbusier's Architecture. The Daylighting Analysis of Seven Unrealized Residential Buildings. Energy and Build. 184, 242–263. doi:10.1016/j.enbuild.2018.12.014
Kong, Z., and Jakubiec, J. A. (2021). Evaluations of Long-Term Lighting Qualities for Computer Labs in Singapore. Building Environ. 194 (12), 107689. doi:10.1016/j.buildenv.2021.107689
Konis, K., and Ph, D. (2018). Field Evaluation of the Circadian Stimulus Potential of Daylit and Non-daylit Spaces in Dementia Care Facilities. Building Environ. 135 (January), 112–123. doi:10.1016/j.buildenv.2018.03.007
Kruisselbrink, T., Dangol, R., and Rosemann, A. (2018). Photometric Measurements of Lighting Quality: An Overview. Building Environ. 138 (February), 42–52. doi:10.1016/j.buildenv.2018.04.028
Lee, P., Lam, P. T. I., and Lee, W. L. (2018). Performance Risks of Lighting Retrofit in Energy Performance Contracting Projects. Energ. Sustainable Develop. 45, 219–229. doi:10.1016/j.esd.2018.07.004
Li, D. H. W., Lou, S., Ghaffarianhoseini, A., Alshaibani, K. A., and Lam, J. C. (2017). A Review of Calculating Procedures on Daylight Factor Based Metrics under Various CIE Standard Skies and Obstructed Environments. Building Environ. 112, 29–44. doi:10.1016/j.buildenv.2016.11.019
Lim, G.-H., Keumala, N., and Ghafar, N. A. (2017). Energy Saving Potential and Visual Comfort of Task Light Usage for Offices in Malaysia. Energy and Build. 147, 166–175. doi:10.1016/j.enbuild.2017.05.004
Mardaljevic, J., Heschong, L., and Lee, E. (2009). Daylight Metrics and Energy Savings. Lighting Res. Technol. 41 (3), 261–283. doi:10.1177/1477153509339703
ElBatran, R. M., and Ismaeel, W. S. E. (2021). Applying a Parametric Design Approach for Optimising Daylighting and Visual Comfort in Office Buildings. Ain Shams Eng. J., 1–10.
Monyei, C. G., and Adewumi, A. O. (2017). Demand Side Management Potentials for Mitigating Energy Poverty in South Africa. Energy Policy 111 (6), 298–311. doi:10.1016/j.enpol.2017.09.039
Monyei, C. G., and Adewumi, A. O. (2018). Integration of Demand Side and Supply Side Energy Management Resources for Optimal Scheduling of Demand Response Loads - South Africa in Focus. Electric Power Syst. Res. 158, 92–104. doi:10.1016/j.epsr.2017.12.033
Nabil, A., and Mardaljevic, J. (2006). Useful Daylight Illuminances: A Replacement for Daylight Factors. Energy and Buildings. 38 (7), 905–913. doi:10.1016/j.enbuild.2006.03.013
Overen, O. K., Meyer, E. L., and Makaka, G. (2017). “Perimeter Walls Solar Heat Gain, a Mechanism for Building Design,” in 11 Built Environment Conference. Durban, South Africa: ASOCSA, 680–691.
Overen, O. K., Meyer, E. L., Makaka, G., Ziuku, S., and Mamphweli, S. (2018). Zonal Air Exchange Rate of a Passive Solar House and Resultant Sensible Air Heat Transfer. Indoor Built Environ., 1–13.
Pellegrino, A., Cammarano, S., Lo Verso, V. R. M., and Corrado, V. (2017). Impact of Daylighting on Total Energy Use in Offices of Varying Architectural Features in Italy: Results from a Parametric Study. Building Environ. 113, 151–162. doi:10.1016/j.buildenv.2016.09.012
Rankin, R., and Rousseau, P. G. (2008). Demand Side Management in South Africa at Industrial Residence Water Heating Systems Using in Line Water Heating Methodology. Energ. Convers. Management. 49 (1), 62–74. doi:10.1016/j.enconman.2007.05.022
Roisin, B., Bodart, M., Deneyer, A., and D’Herdt, P. (2008). Lighting Energy Savings in Offices Using Different Control Systems and Their Real Consumption. Energy and Buildings. 40 (4), 514–523. doi:10.1016/j.enbuild.2007.04.006
Saha, H., Florita, A. R., Henze, G. P., and Sarkar, S. (2019). Occupancy Sensing in Buildings: A Review of Data Analytics Approaches. Energy and Buildings. 188–189, 278–285. doi:10.1016/j.enbuild.2019.02.030
Skinner, T. (2012). An Overview of Energy Efficiency and Demand Side Management in South Africa, in World bank/IFC: Appropriate Incentives to Deploy Renewable Energy and Energy Efficiency. Washington, 1–16. Available at: https://www.esi-africa.com/wp-content/uploads/Tom_Skinner.pdf
Thobejane, J. S., Masekameni, D. M., Rathebe, P. C., and Mgwambani, S. L. (2019). “The Effectiveness of Solar Water Heating Geysers in South Africa : A Review,” in International Conference on Domestic Use of Energy. Wellington, South Africa: IEEE, 59–62.
UNFCCC (2008). EB41 - Annex 11: Methodological Tool: Tool to Calculate Project or Leakage CO2 Emissions from Fossil Fuel Combustion V. 02. Available at: https://cdm.unfccc.int/EB/index.html.
Wong, I. L. (2017). A Review of Daylighting Design and Implementation in Buildings. Renew. Sustainable Energ. Rev. 74 (February), 959–968. doi:10.1016/j.rser.2017.03.061
Xue, P., Mak, C. M., and Cheung, H. D. (2014). The Effects of Daylighting and Human Behavior on Luminous Comfort in Residential Buildings : A Questionnaire Survey. Building Environ. 81, 51–59. doi:10.1016/j.buildenv.2014.06.011
Yu, X., and Su, Y. (2015). Daylight Availability Assessment and its Potential Energy Saving Estimation -A Literature Review. Renew. Sustainable Energ. Rev. 52, 494–503. doi:10.1016/j.rser.2015.07.142
Keywords: passive solar design, daylighting, housing, domestic load management, environmental mitigation
Citation: Overen OK, Meyer EL and Makaka G (2021) Passive Solar and Conventional Housing Design: A Comparative Study of Daylighting Energy Efficiency Potential. Front. Energy Res. 9:668906. doi: 10.3389/fenrg.2021.668906
Received: 17 February 2021; Accepted: 04 May 2021;
Published: 21 May 2021.
Edited by:
Ana Palmero, University of Porto, PortugalReviewed by:
Ashok Kumar Singh, Galgotias Educational Institutions, IndiaCopyright © 2021 Overen, Meyer and Makaka. This is an open-access article distributed under the terms of the Creative Commons Attribution License (CC BY). The use, distribution or reproduction in other forums is permitted, provided the original author(s) and the copyright owner(s) are credited and that the original publication in this journal is cited, in accordance with accepted academic practice. No use, distribution or reproduction is permitted which does not comply with these terms.
*Correspondence: Ochuko K. Overen, b292ZXJlbkB1ZmguYWMuemE=
Disclaimer: All claims expressed in this article are solely those of the authors and do not necessarily represent those of their affiliated organizations, or those of the publisher, the editors and the reviewers. Any product that may be evaluated in this article or claim that may be made by its manufacturer is not guaranteed or endorsed by the publisher.
Research integrity at Frontiers
Learn more about the work of our research integrity team to safeguard the quality of each article we publish.